Attached files
| file | filename |
|---|---|
| EX-99.1 - EX-99.1 - FURMANITE CORP | d82178exv99w1.htm |
| 8-K - FORM 8-K - FURMANITE CORP | d82178e8vk.htm |
Exhibit 99.2
| Furmanite Corporation QUARTER ENDED MARCH 31, 2011 Charles R. Cox, Chairman & CEO Joseph E. Milliron, President & COO Robert S. Muff, Principal Financial Officer |

| Certain of the Company's statements in this presentation are not purely historical, and as such are "forward-looking statements" within the meaning of the Private Securities Litigation Reform Act of 1995. These include statements regarding management's plans, beliefs, expectations, intentions or projections of the future. Forward-looking statements involve risks and uncertainties, including without limitation, the various risks inherent in the Company's business, and other risks and uncertainties detailed most recently in this presentation and the Company's Form 10-K as of December 31, 2010 filed with the Securities and Exchange Commission. One or more of these factors could affect the Company's business and financial results in future periods, and could cause actual results to differ materially from plans and projections. There can be no assurance that the forward-looking statements made in this document will prove to be accurate, and issuance of such forward-looking statements should not be regarded as a representation by the Company, or any other person, that the objectives and plans of the Company will be achieved. All forward-looking statements made in this presentation are based on information presently available to management, and the Company assumes no obligation to update any forward-looking statements. Company assumes no obligation to update any forward-looking statements. Company assumes no obligation to update any forward-looking statements. Company assumes no obligation to update any forward-looking statements. Company assumes no obligation to update any forward-looking statements. Company assumes no obligation to update any forward-looking statements. Company assumes no obligation to update any forward-looking statements. Company assumes no obligation to update any forward-looking statements. Company assumes no obligation to update any forward-looking statements. Company assumes no obligation to update any forward-looking statements. Company assumes no obligation to update any forward-looking statements. Company assumes no obligation to update any forward-looking statements. Company assumes no obligation to update any forward-looking statements. Company assumes no obligation to update any forward-looking statements. Company assumes no obligation to update any forward-looking statements. Company assumes no obligation to update any forward-looking statements. Company assumes no obligation to update any forward-looking statements. Company assumes no obligation to update any forward-looking statements. 2 |

| Furmanite Corporation QUARTER ENDED MARCH 31, 2011 Charles R. Cox, Chairman & CEO 3 |

| Our Mission: To safely and cost-effectively provide World Class solutions for the full range of each Customer's unique local needs - from routine to the most challenging - and to make Furmanite their most trusted Global provider of every Specialty Service we offer. "Delivering World Class Solutions Locally" 4 |

| Safety above all else Integrity and Ethical conduct Customer Responsiveness Perfect Service and Products Global Teamwork and Collaboration 5 Leadership Innovation and Differentiation Continuous Improvement and Growth Urgency, Passion and Commitment Professional and Positive Make Furmanite the company our customers trust and a place we all have Fun Succeeding Together! |

| Furmanite Corporation QUARTER ENDED MARCH 31, 2011 Financial Review Robert S. Muff, Principal Financial Officer 6 |

| Consolidated Income Statements ($ in 000s except percentages and per share amounts) (Unaudited) 7 For the Three Months Ended For the Three Months Ended For the Three Months Ended For the Three Months Ended For the Three Months Ended For the Three Months Ended For the Three Months Ended March 31, March 31, March 31, March 31, March 31, March 31, March 31, 2011 % of Rev 2010 % of Rev Change Revenues $ 73,054 100.0% $ 66,435 100.0% $ 6,619 Operating costs 50,402 69.0% 44,962 67.7% 5,440 Depreciation and amortization expense 1,875 2.6% 1,549 2.3% 326 Selling, general and administrative expense 16,864 23.1% 17,609 26.5% (745) Operating income, excluding restructuring costs 3,913 5.4% 2,315 3.5% 1,598 Restructuring costs 88 0.1% 1,854 2.8% (1,766) Operating income 3,825 5.2% 461 0.7% 3,364 Interest and other income (expense), net (118) 101 (219) Income before income taxes 3,707 562 3,145 Income tax benefit (expense) 319 (171) 490 Net income $ 4,026 $ 391 $ 3,635 Diluted EPS $ 0.11 $ 0.01 $ 0.10 Diluted EPS, excluding restructuring, net of tax $ 0.11 $ 0.05 $ 0.06 |

| Adjustments for Currency Rates ($ in 000s except percentages) (Unaudited) 8 For the Three Months Ended For the Three Months Ended For the Three Months Ended For the Three Months Ended For the Three Months Ended For the Three Months Ended For the Three Months Ended March 31, March 31, March 31, March 31, March 31, March 31, March 31, 2011 2010 Change Change Change Revenues $ 73,054 $ 66,435 $ 6,619 10% Currency adjusted revenues $ 71,400 $ 66,435 $ 4,965 7% Operating income $ 3,825 $ 461 $ 3,364 730% Currency adjusted operating income $ 3,649 $ 461 $ 3,188 692% Net income $ 4,026 $ 391 $ 3,635 930% Currency adjusted net income $ 3,958 $ 391 $ 3,567 912% |

| Revenues Adjusted for Currency Rates ($ in 000s except percentages) (Unaudited) 9 For the Three Months Ended For the Three Months Ended For the Three Months Ended For the Three Months Ended For the Three Months Ended For the Three Months Ended For the Three Months Ended March 31, March 31, March 31, March 31, March 31, March 31, March 31, 2011 2010 Change Change Change Revenues Americas $ 40,227 $ 31,567 $ 8,660 27% EMEA 24,673 26,261 (1,588) -6% Asia-Pacific 8,154 8,607 (453) -5% Total revenues $ 73,054 $ 66,435 $ 6,619 10% Currency adjusted revenues: Americas $ 40,076 $ 31,567 $ 8,509 27% EMEA 24,072 26,261 (2,189) -8% Asia-Pacific 7,252 8,607 (1,355) -16% Total currency adjusted revenues $ 71,400 $ 66,435 $ 4,965 7% |
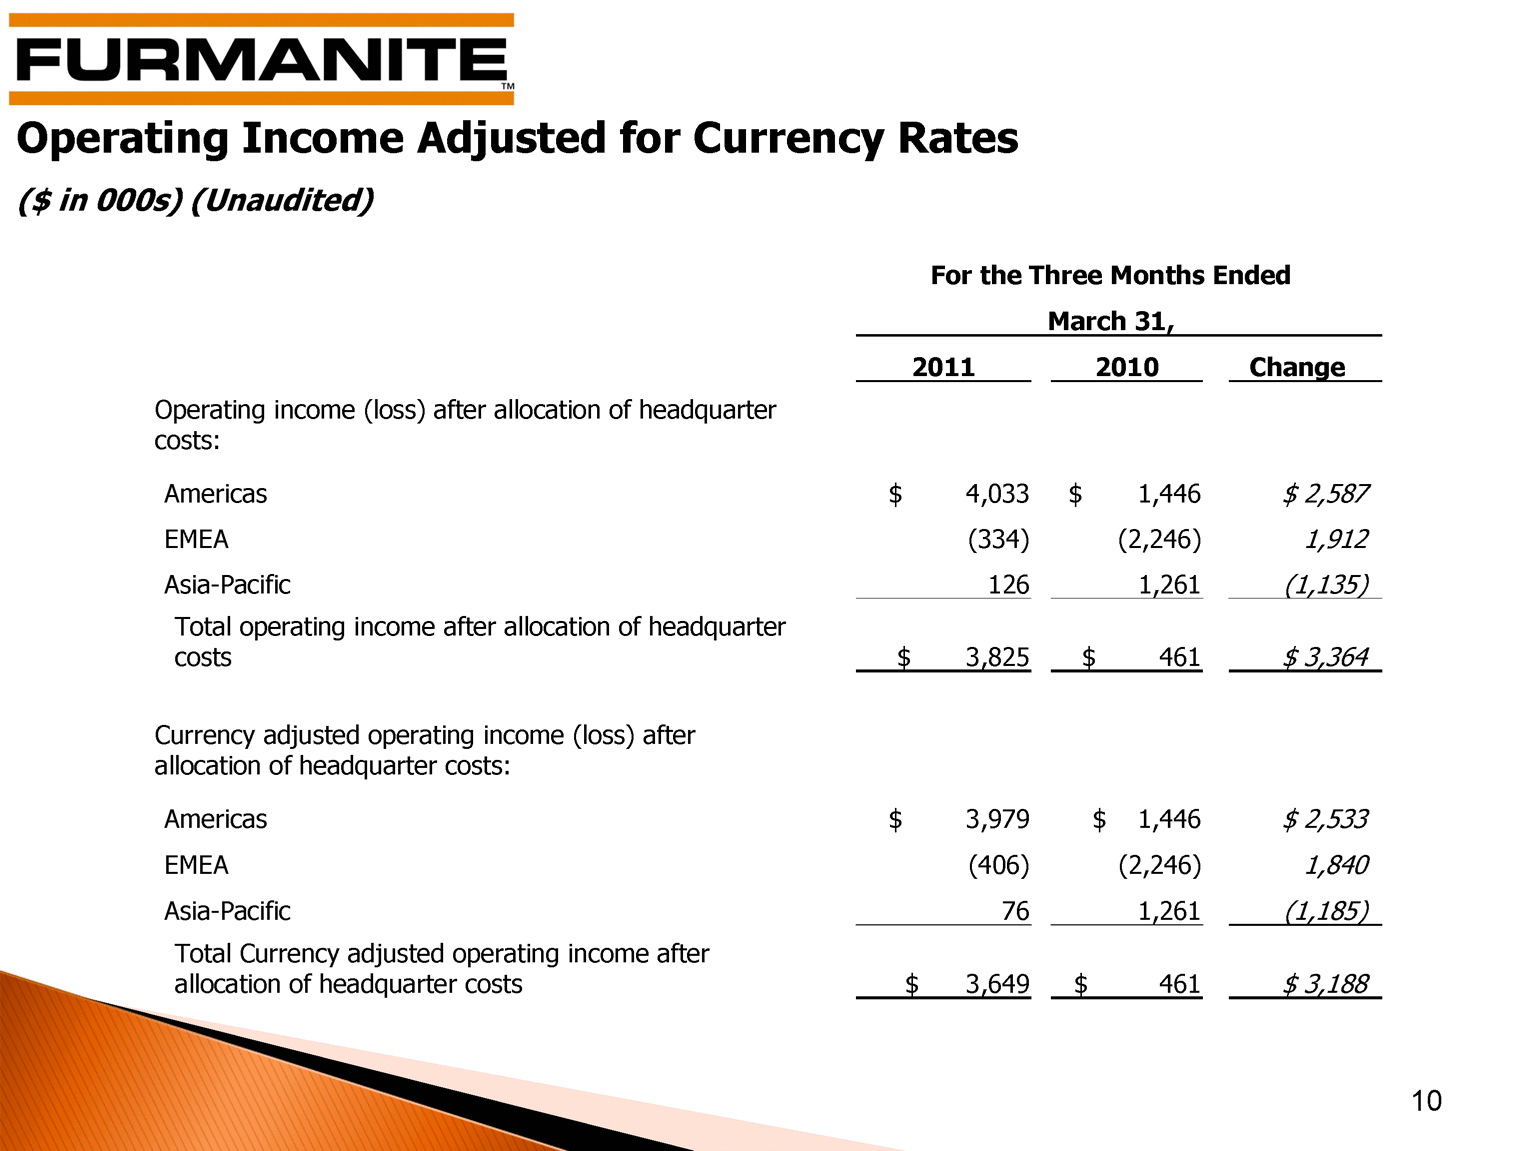
| Operating Income Adjusted for Currency Rates ($ in 000s) (Unaudited) 10 For the Three Months Ended For the Three Months Ended For the Three Months Ended For the Three Months Ended For the Three Months Ended March 31, March 31, March 31, March 31, March 31, 2011 2010 Change Operating income (loss) after allocation of headquarter costs: Americas $ 4,033 $ 1,446 $ 2,587 EMEA (334) (2,246) 1,912 Asia-Pacific 126 1,261 (1,135) Total operating income after allocation of headquarter costs $ 3,825 $ 461 $ 3,364 Currency adjusted operating income (loss) after allocation of headquarter costs: Americas $ 3,979 $ 1,446 $ 2,533 EMEA (406) (2,246) 1,840 Asia-Pacific 76 1,261 (1,185) Total Currency adjusted operating income after allocation of headquarter costs $ 3,649 $ 461 $ 3,188 |
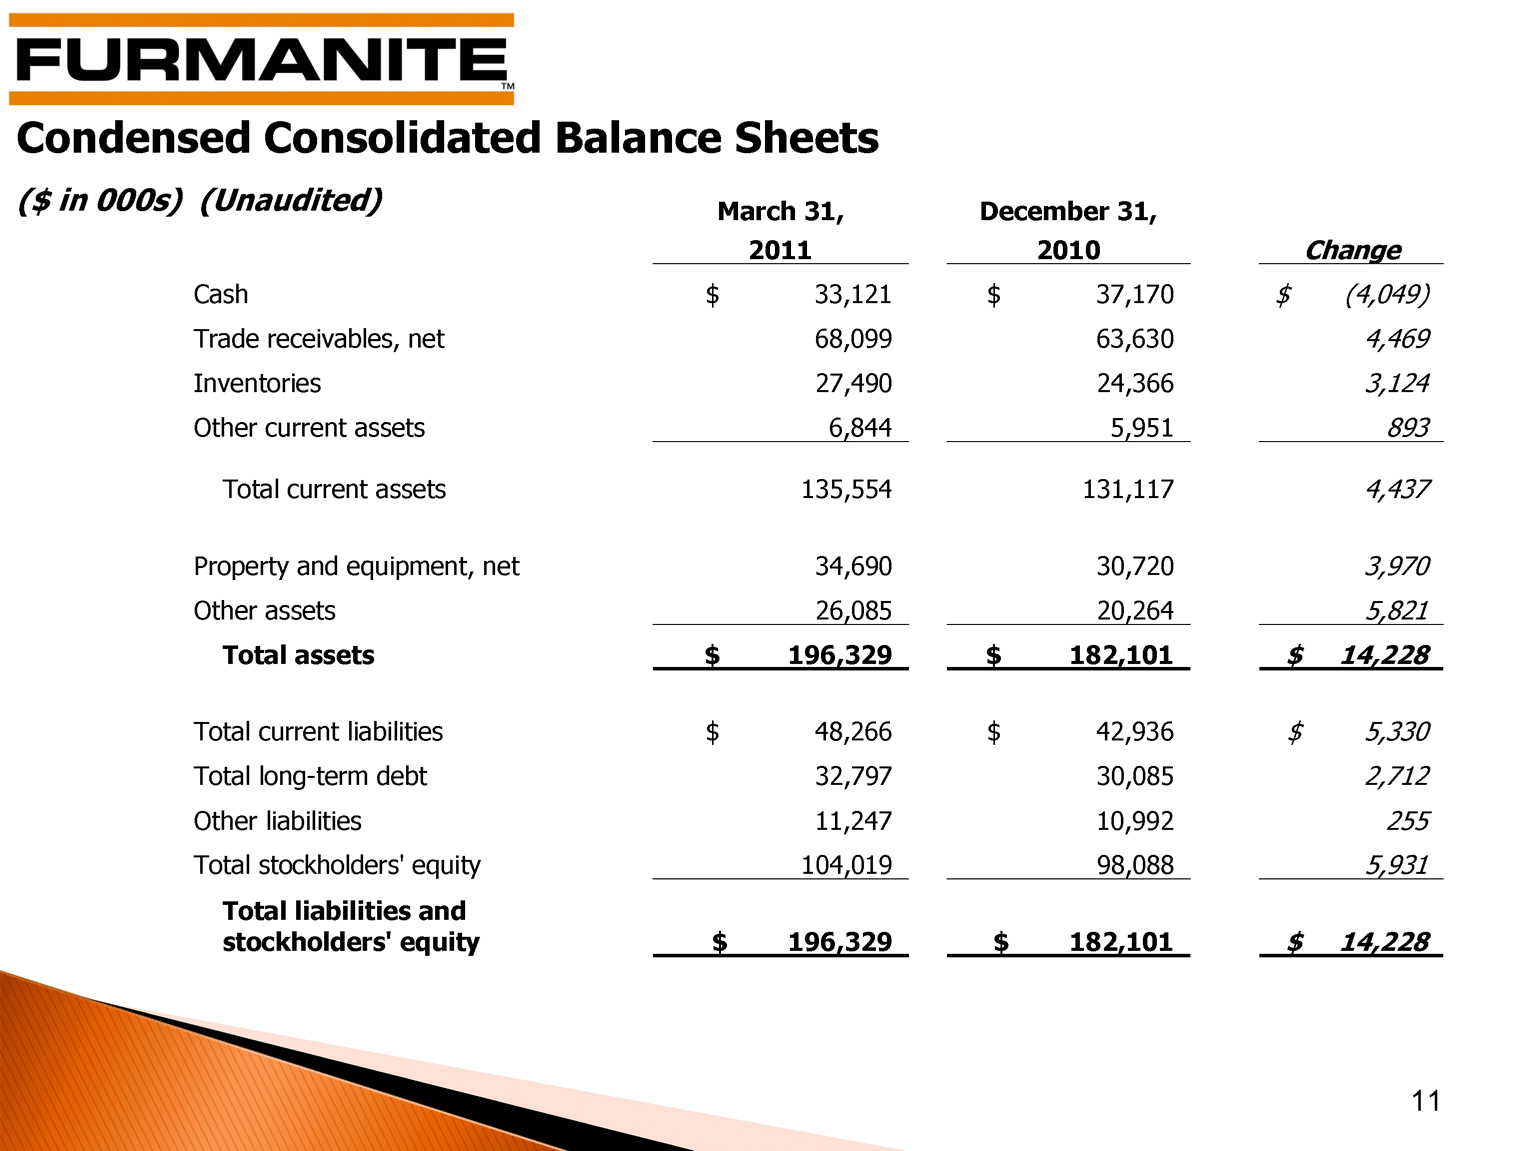
| Condensed Consolidated Balance Sheets ($ in 000s) (Unaudited) 11 March 31, December 31, 2011 2010 Change Cash $ 33,121 $ 37,170 $ (4,049) Trade receivables, net 68,099 63,630 4,469 Inventories 27,490 24,366 3,124 Other current assets 6,844 5,951 893 Total current assets 135,554 131,117 4,437 Property and equipment, net 34,690 30,720 3,970 Other assets 26,085 20,264 5,821 Total assets $ 196,329 $ 182,101 $ 14,228 Total current liabilities $ 48,266 $ 42,936 $ 5,330 Total long-term debt 32,797 30,085 2,712 Other liabilities 11,247 10,992 255 Total stockholders' equity 104,019 98,088 5,931 Total liabilities and stockholders' equity $ 196,329 $ 182,101 $ 14,228 |

| Condensed Consolidated Cash Flows ($ in 000s) (Unaudited) 12 For the Three Months Ended For the Three Months Ended For the Three Months Ended For the Three Months Ended For the Three Months Ended March 31, March 31, March 31, March 31, March 31, 2011 2010 Change Net income $ 4,026 $ 391 $ 3,635 Depreciation, amortization and other non-cash items 1,190 2,182 (992) Working capital changes (5,241) (4,521) (720) Net cash used in operating activities (25) (1,948) 1,923 Capital expenditures (759) (2,365) 1,606 Acquisition of assets and business (3,921) (200) (3,721) Payments on debt (35) (52) 17 Other, net 32 164 (132) Effect of exchange rate changes on cash 659 (298) 957 Decrease in cash and cash equivalents (4,049) (4,699) 650 Cash and cash equivalents at beginning of period 37,170 36,117 1,053 Cash and cash equivalents at end of period $ 33,121 $ 31,418 $ 1,703 |

| Furmanite Corporation Q1 2011 Operations Review Joseph E. Milliron, President and Chief Operating Officer 13 |

| As of March 31, 2011 14 |

| 15 Total Americas2 EMEA3 APAC On-line Services 1st Qtr. 2011 $ 27,924 $ 15,945 $ 9,470 $ 2,509 On-line Services 1st Qtr 2010 24,997 11,378 9,555 4,064 Variance $ 2,927 $ 4,567 $ (85) $ (1,555) Business and Geographic Data - On-line1 Services Revenues ($ in 000's) (Unaudited) 1 Formerly referred to as under-pressure services 2 U.S. and Canada 3 Europe, Middle East and Africa |

| Business and Geographic Data - Off-line1 Services Revenues ($ in 000's) (Unaudited) 16 1 Formerly referred to as turnaround services 2 U.S. and Canada 3 Europe, Middle East and Africa Total Americas2 EMEA3 APAC Off-line Services 1st Qtr. 2011 $ 32,500 $ 18,364 $ 10,096 $ 4,040 Off-line Services 1st Qtr 2010 29,717 15,363 10,636 3,718 Variance $ 2,783 $ 3,001 $ (540) $ 322 |
| Furmanite Corporation Review of 1Q 2011 May 10, 2011 www.furmanite.com 17 |