Attached files
| file | filename |
|---|---|
| 8-K - FORM 8K - PPL Corp | form8k.htm |

1
© PPL Corporation 2011
PPL Corporation
May 11, 2011
Deutsche Bank Conference
Exhibit 99.1

2
© PPL Corporation 2011
Any statements made in this presentation about future operating
results or other future events are forward-looking statements under
the Safe Harbor Provisions of the Private Securities Litigation Reform
Act of 1995. Actual results may differ materially from such forward-
looking statements. A discussion of factors that could cause actual
results or events to vary is contained in the Appendix to this
presentation and in the Company’s SEC filings.
Cautionary Statements and Factors
That May Affect Future Results
That May Affect Future Results

3
© PPL Corporation 2011
PPL has a highly attractive and differentiated position in the electric industry
Investment Highlights
§ Predominantly rate-regulated business mix with significant growth prospects
§ Operations in constructive jurisdictions
§ Approximately two-thirds of regulated capital expenditures earn real-time or near real-time
returns
returns
§ ~ 9% compound annual growth in rate base from 2011 to 2015
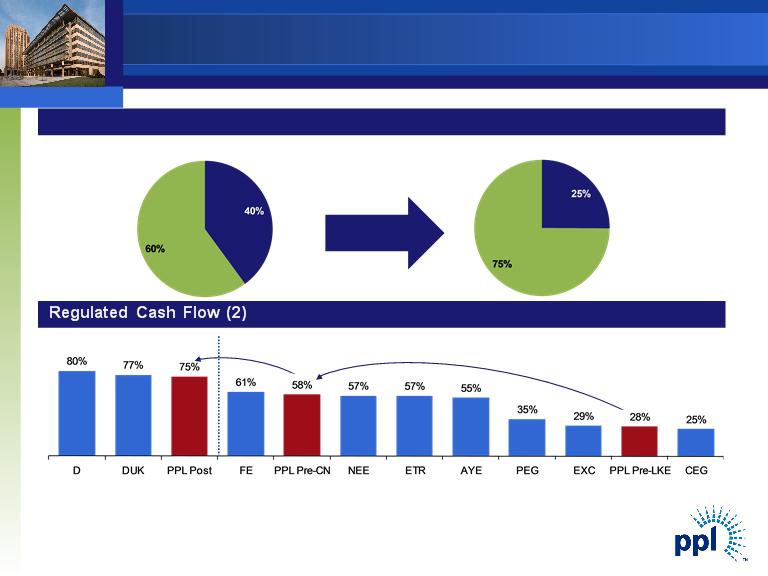
§ Expect 75% of 2013 EBITDA from regulated businesses
§ Highly attractive generation fleet
§ Competitively positioned nuclear, hydro and efficient coal
§ Complemented by flexible dispatch gas fired units
§ No significant exposure to currently proposed environmental regulations
§ Multiple drivers of significant upside
§ Increasing natural gas prices
§ Increasing heat rates
§ Environmental regulation
§ Business Risk Profile rated “Excellent” by S&P
§ Stable ratings outlooks
§ Secure dividend with strong platform for future growth

4
© PPL Corporation 2011
Our Strengths
§ Strong regulatory relationships
§ Best in class reliability, customer service
§ Strong operating performance - regulated and
competitive
competitive
§ Strong carbon and other environmental position
§ Excellent cost-management
§ Knowledgeable, dedicated employees
5
© PPL Corporation 2011
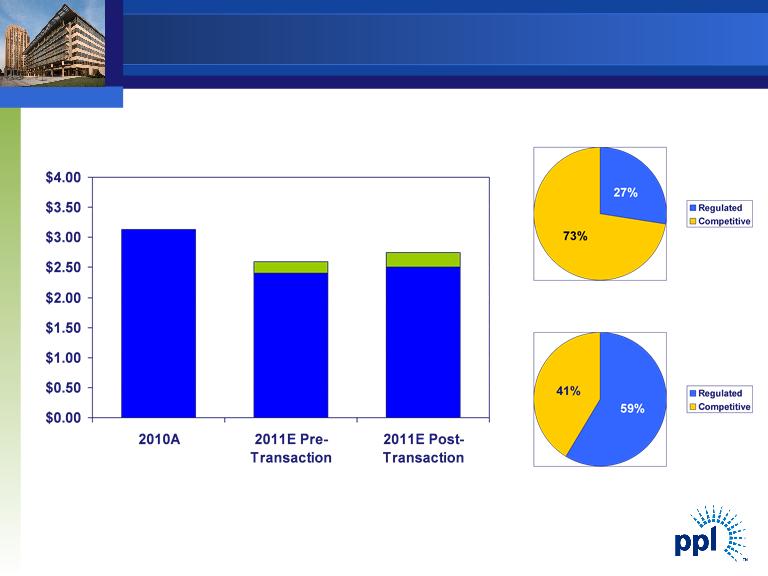
EBITDA Projection (1)
Predominantly Regulated Business Mix
(1) Approximate projections.
(2) “Does The Shale Gas Glut Pose A Threat To U.S. Integrated Power Merchants’ Credit Quality?” Standard & Poor’s, October 22, 2010.
(3) Based on EBIT estimate from company presentation.
(4) PPL estimates; CN pre-transaction figure based on 2011 FFO; post-transaction figure based on 2013 FFO for the combined entity, which includes full
realization of expected synergies.
realization of expected synergies.
2011 Pre-Transaction
2013 Post-Transaction
S&P Business Risk
Profile: Strong or Satisfactory
S&P Business Risk
Profile: Excellent
(4)
(4)
Competitive
Regulated
Regulated
Competitive
(3)
6
© PPL Corporation 2011
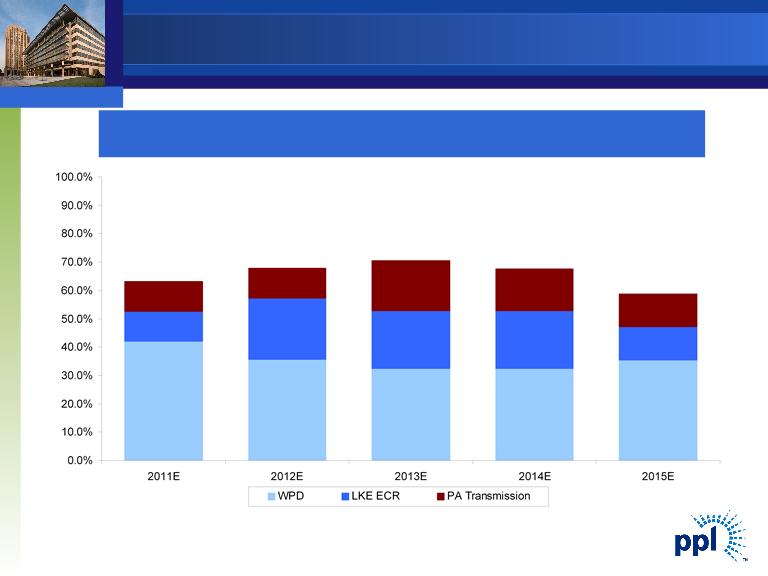
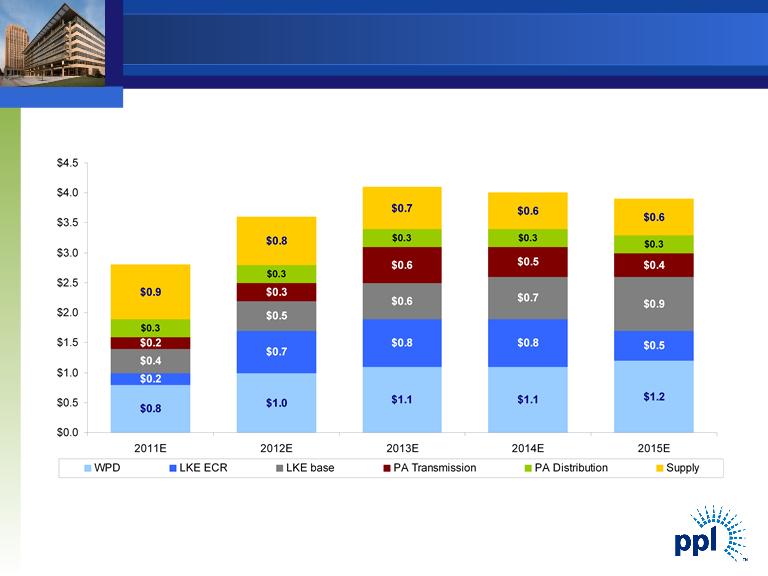
Real-Time Recovery of Majority of
Regulated Capex Spending
Regulated Capex Spending
Note: $ in billions.
(1) Figures based on assumed exchange rate of $1.60 / GBP. Includes capex for WPD Midlands.
(2) Assumes approximately 85% of timely returns via ECR mechanism based on historical experience.
Approximately two-thirds of regulated capital expenditures earn returns subject to
minimal or no regulatory lag
minimal or no regulatory lag
(1)
(2)
63%
71%
68%
68%
61%
$0.8
$0.2
$0.2
$1.0
$0.6
$0.3
$0.6
$0.7
$1.1
$1.1
$0.7
$0.5
$1.2
$0.4
$0.4
7
© PPL Corporation 2011
Regulated Rate Base Growth
($ in billions)
(1) Represents capitalization for LKE, as LG&E and KU rate constructs are based on capitalization. Represents Regulatory Asset Value (RAV) for WPD.
(2) Includes RAV for WPD Midlands. Figures based on assumed exchange rate of $1.60 / GBP and are as of year-end December 31.
$18.0
$19.2
$21.4
$23.4
$25.2
2011E - 2015E Regulatory Asset Base(1) CAGR: 8.8%
(2)
8
© PPL Corporation 2011
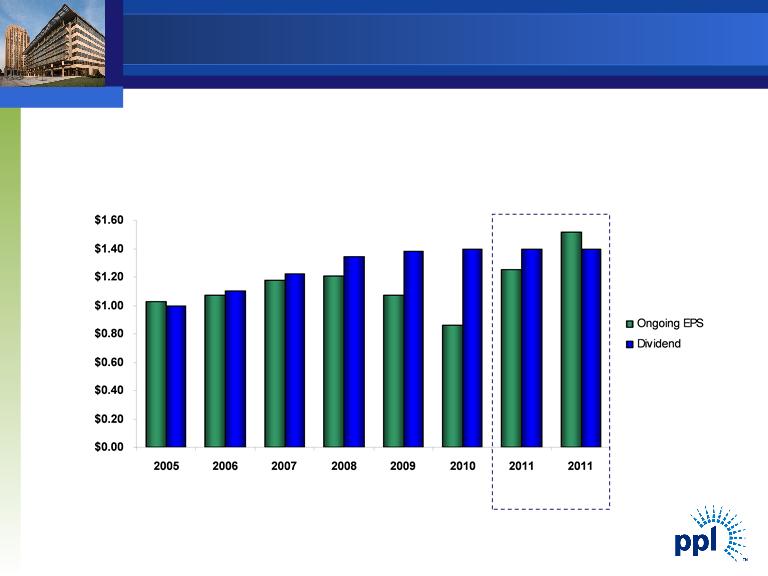
$/Share
Annualized
A significantly more rate-regulated business mix provides strong
support for current dividend and a platform for future growth
(1) Ongoing EPS based on mid-point of forecast. Annualized dividend based on 1st quarter declaration. Actual dividends to
be determined by Board of Directors.
be determined by Board of Directors.
(2) From only regulated segments.
(1)
(2)
(1)
Pre-
Transaction
Transaction
Post-
Transaction
Transaction
Dividend Profile
9
© PPL Corporation 2011
© PPL Corporation 2011

10
© PPL Corporation 2011
Appendix
11
© PPL Corporation 2011
$3.13
$2.75
$/Share
(1) Based on mid-point of forecasted earnings range.
Note: See appendix for reconciliation of earnings from ongoing operations to reported earnings.
(1)
$2.50
2010A
2011E
$2.60
$2.40
2011 Earnings from Ongoing Operations Forecast
12
© PPL Corporation 2011
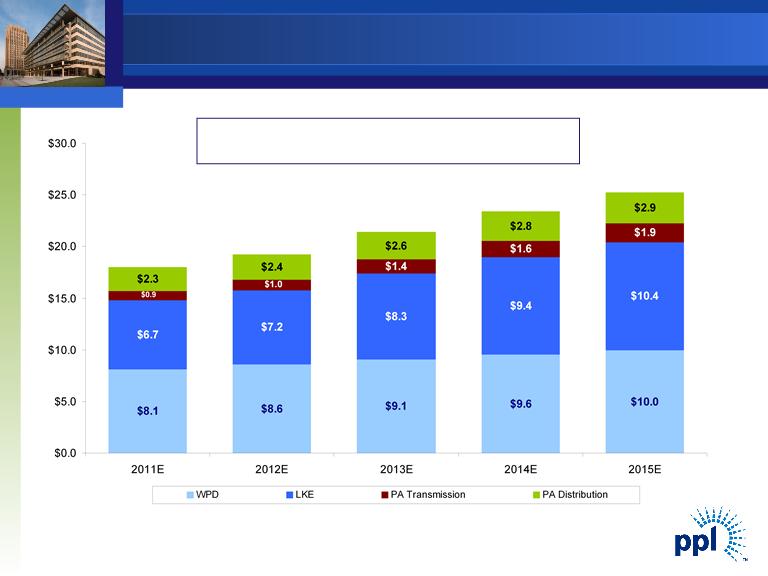
Capital Expenditures
($ in billions)
(1) Includes capex for WPD Midlands. Figures based on assumed exchange rate of $1.60 / GBP.
(2) Expect approximately 85% to receive timely returns via ECR mechanism based on historical experience.
(1)
(2)
$2.8
$3.6
$4.1
$4.0
$3.9
13
© PPL Corporation 2011
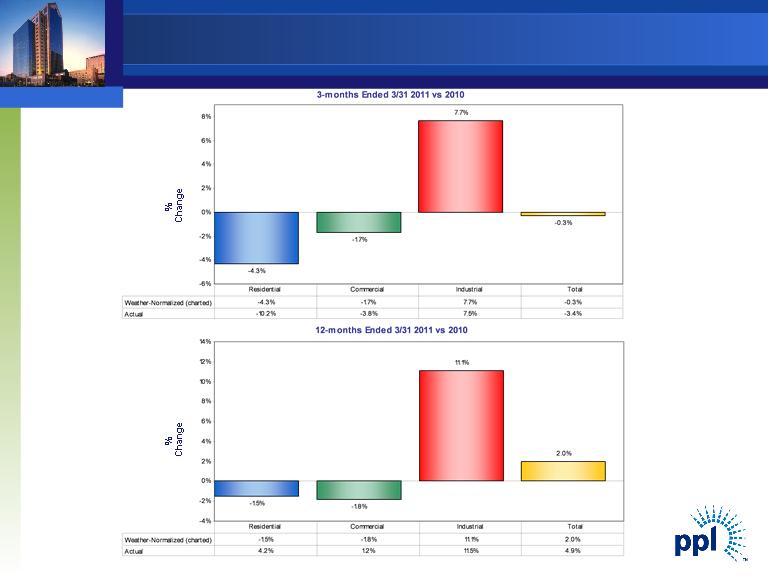
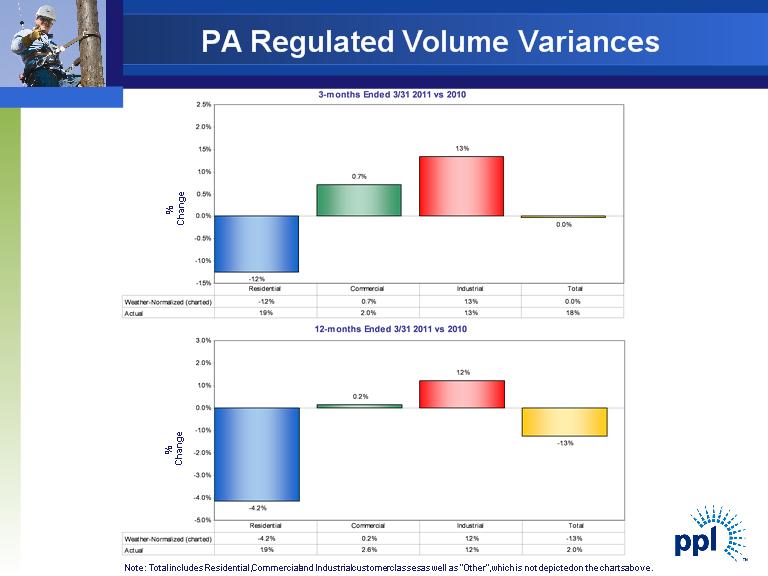
Note: Total includes Residential, Commercial and Industrial customer classes as well as “Other”, which is not depicted on the charts above.
Kentucky Regulated Volume Variances
13 © PPL Corporation 2011 12- months Ended 3/31 2011 vs 2010 -1.5% -1.8% 11.1% 2.0% -4% -2% 0% 2% 4% 6% 8% 10% 12% 14% Weather- Normalized ( charted) - 1.5% - 1.8% 11.1% 2.0% Actual 4.2% 1.2% 11.5% 4.9% Residential Commercial Industrial Total 3- months Ended 3/ 31 2011 vs 2010 -4.3% -1.7% 7.7% -0.3% -6% -4% -2% 0% 2% 4% 6% 8% Weather- Normalized ( charted) - 4.3% - 1.7% 7.7% - 0.3% Actual -10.2% -3.8% 7.5% - 3.4% Residential Commercial Industrial Total Kentucky Regulated Volume Variances % Change% Change Note: Total includes Residential, Commercial and Industrial customer classes as well as “Other” , which is not depicted on the charts above. 13 © PPL Corporation 2011 12- months Ended 3/31 2011 vs 2010 -1.5% -1.8% 11.1% 2.0% -4% -2% 0% 2% 4% 6% 8% 10% 12% 14% Weather- Normalized ( charted) - 1.5% - 1.8% 11.1% 2.0% Actual 4.2% 1.2% 11.5% 4.9% Residential Commercial Industrial Total 3- months Ended 3/ 31 2011 vs 2010 -4.3% -1.7% 7.7% -0.3% -6% -4% -2% 0% 2% 4% 6% 8% Weather- Normalized ( charted) - 4.3% - 1.7% 7.7% - 0.3% Actual -10.2% -3.8% 7.5% - 3.4% Residential Commercial Industrial Total Kentucky Regulated Volume Variances % Change% Change Note: Total includes Residential, Commercial and Industrial customer classes as well as “Other” , which is not depicted on the charts above.
14
© PPL Corporation 2011
14 © PPL Corporation 2011 PA Regulated Volume Variances % Change% Change Note: Total includes Residential, Commercial and Industrial customer classes as well as “Other” , which is not depicted on the charts above. 3- months Ended 3/31 2011 vs 2010 -1.2% 0.7% 1.3% 0.0% -1.5% -1.0% -0.5% 0.0% 0.5% 1.0% 1.5% 2.0% 2.5% Weather- Normalized ( charted) - 1.2% 0.7% 1.3% 0.0% Actual 1.9% 2.0% 1.3% 1.8% Residential Commercial Industrial Total 12- months Ended 3/ 31 2011 vs 2010 -4.2% 0.2% 1.2% -1.3% -5.0% -4.0% -3.0% -2.0% -1.0% 0.0% 1.0% 2.0% 3.0% Weather- Normalized ( charted) - 4.2% 0.2% 1.2% - 1.3% Actual 1.9% 2.6% 1.2% 2.0% Residential Commercial Industrial Total 14 © PPL Corporation 2011 PA Regulated Volume Variances % Change% Change Note: Total includes Residential, Commercial and Industrial customer classes as well as “Other” , which is not depicted on the charts above. 3- months Ended 3/31 2011 vs 2010 -1.2% 0.7% 1.3% 0.0% -1.5% -1.0% -0.5% 0.0% 0.5% 1.0% 1.5% 2.0% 2.5% Weather- Normalized ( charted) - 1.2% 0.7% 1.3% 0.0% Actual 1.9% 2.0% 1.3% 1.8% Residential Commercial Industrial Total 12- months Ended 3/ 31 2011 vs 2010 -4.2% 0.2% 1.2% -1.3% -5.0% -4.0% -3.0% -2.0% -1.0% 0.0% 1.0% 2.0% 3.0% Weather- Normalized ( charted) - 4.2% 0.2% 1.2% - 1.3% Actual 1.9% 2.6% 1.2% 2.0% Residential Commercial Industrial Total

15
© PPL Corporation 2011
Capacity revenues are expected to be $430 million, $385 million and $590 million for 2011, 2012 and 2013, respectively.
As of March 31, 2011
(1) Represents expected sales based on current business plan assumptions. Amounts do not reflect the impact of the Susquehanna turbine blade inspection/replacement outages.
(2) The 2011 average hedge energy prices are based on the fixed price swaps as of March 31, 2011; the prior collars have all been converted to fixed swaps.
(3) The 2012 ranges of average energy prices for existing hedges were estimated by determining the impact on the existing collars resulting from 2012 power prices at the 5th and 95th percentile
confidence levels.
confidence levels.
(4) Includes three months of actual results.
|
|
|
|
2011(4)
|
|
2012
|
|
|
|
Baseload
|
|
|
|
|
|
|
|
|
Expected Generation(1) (Million MWhs)
|
|
|
50.7
|
|
54.7
|
|
|
|
East
|
|
|
42.5
|
|
46.2
|
|
|
|
West
|
|
|
8.2
|
|
8.5
|
|
|
|
|
|
|
|
|
|
|
|
|
Current Hedges (%)
|
|
|
99%
|
|
86%
|
|
|
|
East
|
|
|
100%
|
|
84%
|
|
|
|
West
|
|
|
97%
|
|
94%
|
|
|
|
|
|
|
|
|
|
|
|
|
Average Hedged Price (Energy Only) ($/MWh)(2) (3)
|
|
|
|
|
|
|
|
|
East
|
|
|
$57
|
|
$55-56
|
|
|
|
West
|
|
|
$54
|
|
$53-54
|
|
|
|
|
|
|
|
|
|
|
|
|
Current Coal Hedges (%)
|
|
|
99%
|
|
96%
|
|
|
|
East
|
|
|
99%
|
|
94%
|
|
|
|
West
|
|
|
100%
|
|
100%
|
|
|
|
|
|
|
|
|
|
|
|
|
Average Hedged Consumed Coal Price (Delivered $/Ton)
|
|
|
|
|
|
|
|
|
East
|
|
|
$73-74
|
|
$76-80
|
|
|
|
West
|
|
|
$23-28
|
|
$23-29
|
|
|
|
|
|
|
|
|
|
|
|
|
Intermediate/Peaking
|
|
|
|
|
|
|
|
|
Expected Generation(1) (Million MWhs)
|
|
|
7.1
|
|
6.2
|
|
|
|
Current Hedges (%)
|
|
|
58%
|
|
26%
|
|
|
Enhancing Value Through Active Hedging

16
© PPL Corporation 2011
Market Prices
|
(1)
|
24-hour average.
|
|
(2)
|
NYMEX and TZ6NNY forward gas prices on 3/31/2011.
|
|
(3)
|
Market Heat Rate = PJM on-peak power price divided by TZ6NNY gas
price. |
16 © PPL Corporation 2011 Market Prices 2011 2012 $52 $54 $37 $40 $44 $46 $30 $39 $21 $29 $26 $35 $4.57 $ 5.06 $5.07 $ 5.83 10.2 10.6 $136.79 $123.63 88.3% 89.8% (Per MWD) EQA HEAT RATE(3) TZ6NNY PJM MARKET ATC(1) NYMEX GAS(2) CAPACITY PRICES Mid-Columbia On-Peak Off-Peak ATC(1) ELECTRIC PJM On-Peak Off-Peak (1) 24-hour average. (2) NYMEX and TZ6NNY forward gas prices on 3/31/2011. (3) Market Heat Rate = PJM on-peak power price divided by TZ6NNY gas price. 16 © PPL Corporation 2011 Market Prices 2011 2012 $52 $54 $37 $40 $44 $46 $30 $39 $21 $29 $26 $35 $4.57 $ 5.06 $5.07 $ 5.83 10.2 10.6 $136.79 $123.63 88.3% 89.8% (Per MWD) EQA HEAT RATE(3) TZ6NNY PJM MARKET ATC(1) NYMEX GAS(2) CAPACITY PRICES Mid-Columbia On-Peak Off-Peak ATC(1) ELECTRIC PJM On-Peak Off-Peak (1) 24-hour average. (2) NYMEX and TZ6NNY forward gas prices on 3/31/2011. (3) Market Heat Rate = PJM on-peak power price divided by TZ6NNY gas price.

17
© PPL Corporation 2011
Earnings Per Share
Midlands
$0.49
Legacy Ops
$0.08
Other ($0.02)
Margins $0.10
Other ($0.03)
Margins
($0.51)
Taxes
($0.25)
O&M ($0.08)
|
(1) Earnings from ongoing operations.
Note: See Appendix for the reconciliation of earnings from ongoing operations to reported earnings.
|
(1)
(1)
2010 to 2011 Earnings Walk
18
© PPL Corporation 2011
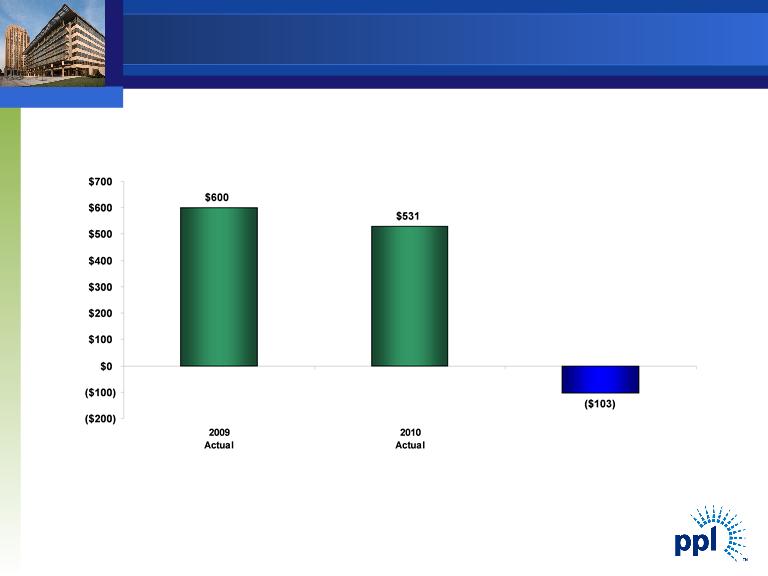
Millions of Dollars
(1) 2010 Free Cash Flow includes two months of the results of the Kentucky Regulated segment.
Note: See Appendix for reconciliation of free cash flow before dividends to cash from operations.
(1)
2011
Forecast
Free Cash Flow before Dividends
19
© PPL Corporation 2011
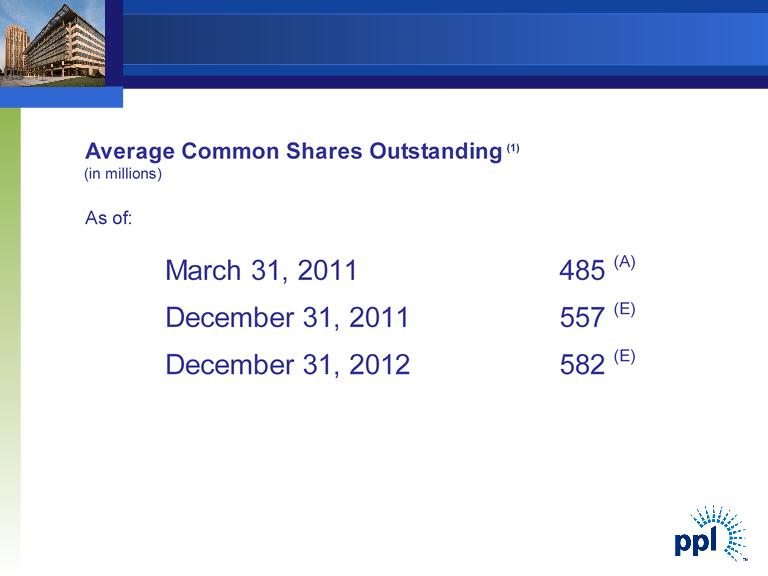
(1) Projected average common shares outstanding include common stock issued for the acquisition of WPD Midlands and projected
shares issued to satisfy DRIP and compensation-related stock requirements. These projections do not include common stock issued
to fund future growth.
shares issued to satisfy DRIP and compensation-related stock requirements. These projections do not include common stock issued
to fund future growth.
(A) Actual for quarter ended March 31, 2011.
(E) Estimate for average shares outstanding for the year indicated.
Shares Outstanding
19 © PPL Corporation 2011 Shares Outstanding (1) Projected average common shares outstanding include common stock issued for the acquisition of WPD Midlands and projected shares issued to satisfy DRIP and compensation-related stock requirements. These projections do not include common stock issued to fund future growth. (A) Actual for quarter ended March 31, 2011. (E) Estimate for average shares outstanding for the year indicated. Average Common Shares Outstanding (1) (in millions) As of: March 31, 2011 485 (A) December 31, 2011 557 (E) December 31, 2012 582 (E) 19 © PPL Corporation 2011 Shares Outstanding (1) Projected average common shares outstanding include common stock issued for the acquisition of WPD Midlands and projected shares issued to satisfy DRIP and compensation-related stock requirements. These projections do not include common stock issued to fund future growth. (A) Actual for quarter ended March 31, 2011. (E) Estimate for average shares outstanding for the year indicated. Average Common Shares Outstanding (1) (in millions)

20
© PPL Corporation 2011
|
|
2009
|
2010
|
2011
|
||
|
Cash from Operations
|
$1,852
|
|
$2,034
|
|
$2,200
|
|
Increase (Decrease) in cash due to:
|
|
|
|
|
|
|
Capital Expenditures
|
(1,265)
|
|
(1,644)
|
|
(2,837)
|
|
Sale of Assets
|
84
|
|
161
|
|
382
|
|
Other Investing Activities - Net
|
(71)
|
|
(20)
|
|
152
|
|
Free Cash Flow before Dividends
|
$ 600
|
|
$ 531
|
|
$ (103)
|
(Millions of Dollars)
PPL Corporation Reconciliation of Cash from
Operations to Free Cash Flow before Dividends
Operations to Free Cash Flow before Dividends
21
© PPL Corporation 2011
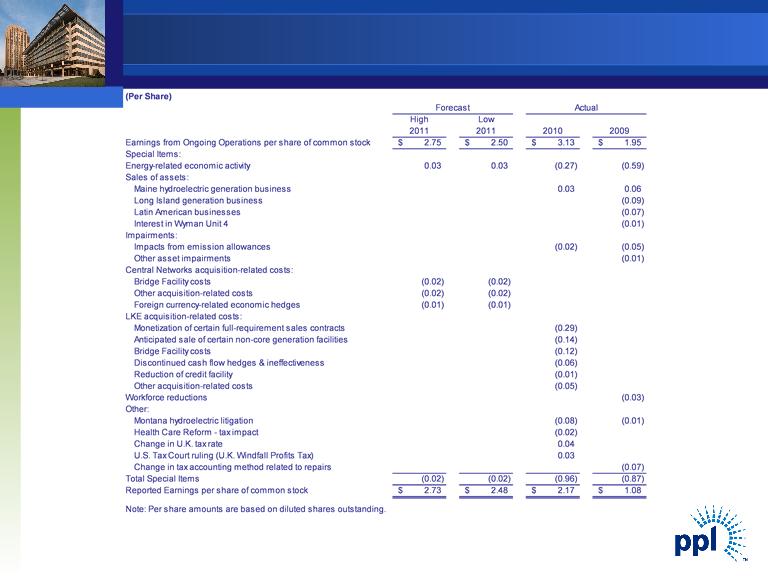
Reconciliation of PPL’s Earnings from Ongoing
Operations to Reported Earnings
Operations to Reported Earnings
21 © PPL Corporation 2011 Reconciliation of PPL’s Earnings from Ongoing Operations to Reported Earnings (Per Share) High Low 2011 2011 2010 2009 Earnings from Ongoing Operations per share of common stock 2.75 $ 2.50 $ 3.13 $ 1.95 $ Special Items: Energy-related economic activity 0.03 0.03 ( 0.27) ( 0.59) Sales of assets: Maine hydroelectric generation business 0.03 0.06 Long Island generation business (0.09) Latin American businesses (0.07) Interest in Wyman Unit 4 (0.01) Impairments: Impacts from emission allowances (0.02) ( 0.05) Other asset impairments (0.01) Central Networks acquisition- related costs: Bridge Facility costs ( 0.02) ( 0.02) Other acquisition- related costs ( 0.02) ( 0.02) Foreign currency-related economic hedges (0.01) ( 0.01) LKE acquisition- related costs: Monetization of certain full- requirement sales contracts (0.29) Anticipated sale of certain non- core generation facilities ( 0.14) Bridge Facility costs (0.12) Discontinued cash flow hedges & ineffectiveness (0.06) Reduction of credit facility (0.01) Other acquisition- related costs (0.05) Workforce reductions (0.03) Other: Montana hydroelectric litigation (0.08) ( 0.01) Health Care Reform - tax impact (0.02) Change in U.K. tax rate 0.04 U. S. Tax Court ruling (U.K. Windfall Profits Tax) 0.03 Change in tax accounting method related to repairs (0.07) Total Special Items (0.02) ( 0.02) ( 0.96) ( 0.87) Reported Earnings per share of common stock 2.73 $ 2.48 $ 2.17 $ 1.08 $ Note: Per share amounts are based on diluted shares outstanding. Forecast Actual 21 © PPL Corporation 2011 Reconciliation of PPL’s Earnings from Ongoing Operations to Reported Earnings (Per Share) High Low 2011 2011 2010 2009 Earnings from Ongoing Operations per share of common stock 2.75 $ 2.50 $ 3.13 $ 1.95 $ Special Items: Energy-related economic activity 0.03 0.03 ( 0.27) ( 0.59) Sales of assets: Maine hydroelectric generation business 0.03 0.06 Long Island generation business (0.09) Latin American businesses (0.07) Interest in Wyman Unit 4 (0.01) Impairments: Impacts from emission allowances (0.02) ( 0.05) Other asset impairments (0.01) Central Networks acquisition- related costs: Bridge Facility costs ( 0.02) ( 0.02) Other acquisition- related costs ( 0.02) ( 0.02) Foreign currency-related economic hedges (0.01) ( 0.01) LKE acquisition- related costs: Monetization of certain full- requirement sales contracts (0.29) Anticipated sale of certain non- core generation facilities ( 0.14) Bridge Facility costs (0.12) Discontinued cash flow hedges & ineffectiveness (0.06) Reduction of credit facility (0.01) Other acquisition- related costs (0.05) Workforce reductions (0.03) Other: Montana hydroelectric litigation (0.08) ( 0.01) Health Care Reform - tax impact (0.02) Change in U.K. tax rate 0.04 U. S. Tax Court ruling (U.K. Windfall Profits Tax) 0.03 Change in tax accounting method related to repairs (0.07) Total Special Items (0.02) ( 0.02) ( 0.96) ( 0.87) Reported Earnings per share of common stock 2.73 $ 2.48 $ 2.17 $ 1.08 $ Note: Per share amounts are based on diluted shares outstanding. Forecast Actual

22
© PPL Corporation 2011
Statements contained in this presentation, including statements with respect to future earnings, cash flows, financing, regulation and
corporate strategy are "forward-looking statements" within the meaning of the federal securities laws. Although PPL Corporation
believes that the expectations and assumptions reflected in these forward-looking statements are reasonable, these statements are
subject to a number of risks and uncertainties, and actual results may differ materially from the results discussed in the statements.
The following are among the important factors that could cause actual results to differ materially from the forward-looking statements:
market demand and prices for energy, capacity and fuel; weather conditions affecting customer energy usage and operating costs;
competition in power markets; the effect of any business or industry restructuring; the profitability and liquidity of PPL Corporation and
its subsidiaries; new accounting requirements or new interpretations or applications of existing requirements; operating performance
of plants and other facilities; the length of scheduled and unscheduled outages at our plants, including the current outage at Unit 2 of
our Susquehanna nuclear plant to inspect and repair turbine blades, and the timing and outcome of any similar outage for inspections
at Unit 1 of the Susquehanna plant; environmental conditions and requirements and the related costs of compliance, including
environmental capital expenditures and emission allowance and other expenses; system conditions and operating costs; development
of new projects, markets and technologies; performance of new ventures; asset or business acquisitions and dispositions, and PPL
Corporation’s ability to realize the expected benefits from acquired businesses, including the 2010 acquisition of Louisville Gas and
Electric Company and Kentucky Utilities Company and the 2011 acquisition of the Central Networks electricity distribution businesses
in the U.K.; any impact of hurricanes or other severe weather on our business, including any impact on fuel prices; receipt of
necessary government permits, approvals, rate relief and regulatory cost recovery; capital market conditions and decisions regarding
capital structure; the impact of state, federal or foreign investigations applicable to PPL Corporation and its subsidiaries; the outcome
of litigation against PPL Corporation and its subsidiaries; stock price performance; the market prices of equity securities and the
impact on pension income and resultant cash funding requirements for defined benefit pension plans; the securities and credit ratings
of PPL Corporation and its subsidiaries; political, regulatory or economic conditions in states, regions or countries where PPL
Corporation or its subsidiaries conduct business, including any potential effects of threatened or actual terrorism or war or other
hostilities; foreign exchange rates; new state, federal or foreign legislation, including new tax legislation; and the commitments and
liabilities of PPL Corporation and its subsidiaries. Any such forward-looking statements should be considered in light of such important
factors and in conjunction with PPL Corporation's Form 10-K and other reports on file with the Securities and Exchange Commission.
Forward-Looking Information Statement

23
© PPL Corporation 2011
“Earnings from ongoing operations” should not be considered as an alternative to reported earnings, or net income attributable to PPL, which is an
indicator of operating performance determined in accordance with generally accepted accounting principles (GAAP). PPL believes that “earnings from
ongoing operations,” although a non-GAAP financial measure, is also useful and meaningful to investors because it provides management’s view of
PPL’s fundamental earnings performance as another criterion in making investment decisions. PPL’s management also uses “earnings from ongoing
operations” in measuring certain corporate performance goals. Other companies may use different measures to present financial performance.
“Earnings from ongoing operations” is adjusted for the impact of special items. Special items include:
• Energy-related economic activity (as discussed below).
• Foreign currency-related economic hedges.
• Gains and losses on sales of assets not in the ordinary course of business.
• Impairment charges (including impairments of securities in the company’s nuclear decommissioning trust funds).
• Workforce reduction and other restructuring impacts.
• Acquisition-related costs and charges.
• Other charges or credits that are, in management’s view, not reflective of the company’s ongoing operations.
Energy-related economic activity includes the changes in fair value of positions used economically to hedge a portion of the economic value of PPL’s
generation assets, full-requirement sales contracts and retail activities. This economic value is subject to changes in fair value due to market price
volatility of the input and output commodities (e.g., fuel and power) prior to the delivery period that was hedged. Also included in energy-related
economic activity is the ineffective portion of qualifying cash flow hedges, the monetization of certain full-requirement sales contracts and premium
amortization associated with options. This economic activity is deferred, with the exception of the full-requirement sales contracts that were
monetized, and included in earnings from ongoing operations over the delivery period of the item that was hedged or upon realization. Management
believes that adjusting for such amounts provides a better matching of earnings from ongoing operations to the actual amounts settled for PPL’s
underlying hedged assets. Please refer to the Notes to the Consolidated Financial Statements and MD&A in PPL Corporation’s periodic filings with
the Securities and Exchange Commission for additional information on energy-related economic activity.
“Free cash flow before dividends” is derived by deducting capital expenditures and other investing activities-net, from cash flow from operations. Free
cash flow before dividends should not be considered as an alternative to cash flow from operations, which is determined in accordance with GAAP.
PPL believes that free cash flow before dividends, although a non-GAAP measure, is an important measure to both management and investors, as it
is an indicator of the company’s ability to sustain operations and growth without additional outside financing beyond the requirement to fund maturing
debt obligations. Other companies may calculate free cash flow before dividends in a different manner.
Definitions of Non-GAAP Financial Measures