Attached files
| file | filename |
|---|---|
| 8-K - DYNEGY INC 8-K 5-9-2011 - DYNEGY INC. | form8k.htm |
| EX-99.1 - EXHIBIT 99.1 - DYNEGY INC. | ex99_1.htm |
Exhibit 99.2

First Quarter 2011 Results
May 9, 2011
Investor Relations | Norelle Lundy, Vice President | Laura Hrehor, Senior Director | 713-507-6466 | ir@dynegy.com

Forward-Looking Statements
2
Cautionary Statement Regarding Forward-Looking Statements
This presentation contains statements reflecting assumptions, expectations, projections, intentions
or beliefs about future events that are intended as “forward looking statements.” You can identify
these statements by the fact that they do not relate strictly to historical or current facts.
Management cautions that any or all of Dynegy’s forward-looking statements may turn out to be
wrong. Please read Dynegy’s annual, quarterly and current reports filed under the Securities
Exchange Act of 1934, including its 2010 Form 10-K and first quarter 2011 Form 10-Q (when filed), for
additional information about the risks, uncertainties and other factors affecting these forward-
looking statements and Dynegy generally. Dynegy’s actual future results may vary materially from
those expressed or implied in any forward-looking statements. All of Dynegy’s forward-looking
statements, whether written or oral, are expressly qualified by these cautionary statements and any
other cautionary statements that may accompany such forward-looking statements. In addition,
Dynegy disclaims any obligation to update any forward-looking statements to reflect events or
circumstances after the date hereof.
Non-GAAP Financial Measures
This presentation contains non-GAAP financial measures including EBITDA, Adjusted EBITDA,
Adjusted Cash Flow from Operations, Adjusted Free Cash Flow, Net Debt and Net Debt and Other
Obligations. Reconciliations of these measures to the most directly comparable GAAP measures to
the extent available without unreasonable effort are contained herein. To the extent required,
statements disclosing the utility and purposes of these measures are set forth in Item 2.02 to our
current report on form 8-K filed with the SEC on May 9, 2011, which is available on our website free
of charge, www.dynegy.com.

Highlights and Upcoming Events
3
• Four new board members elected March 9, 2011; one new board member
elected May 4, 2011
elected May 4, 2011
- Two additional director nominees have been identified
- New directors plus nominees will stand for election in June and, if elected, will constitute
the new Dynegy board
the new Dynegy board
- Annual stockholder meeting will be held on June 15, 2011
• E. Hunter Harrison named interim President and CEO
• Dynegy retained restructuring advisory firms

Financial Results

Capital & Liquidity (as of 3/31/11)
• Net debt and other obligations(1) of $4.1 billion
– Net cash-on-hand and investments of $404 million
and restricted cash and investments of $850
million(2)
and restricted cash and investments of $850
million(2)
• Collateral of $557 million posted(4)
• Liquidity of $1.44 billion
Financial Results
5
Adjusted EBITDA ($MM)
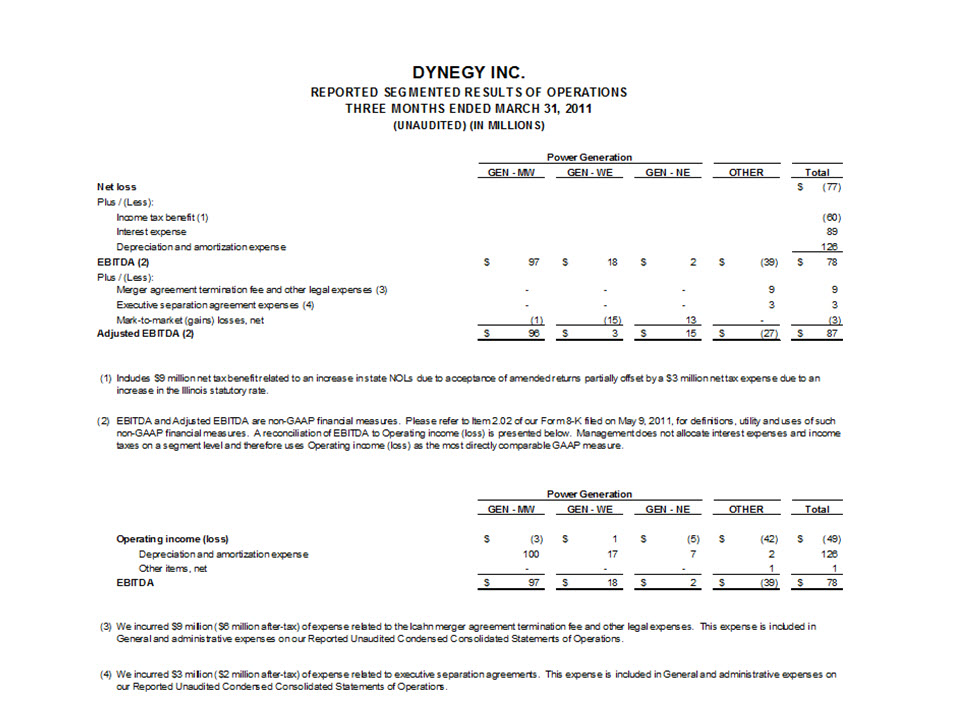
Net Income / Loss
• Net loss of $77 million for 2011 primarily due to
lower revenues, including after-tax mark-to
lower revenues, including after-tax mark-to
market gains of $1.8 million, and an increase in
depreciation and amortization expense of $31
million
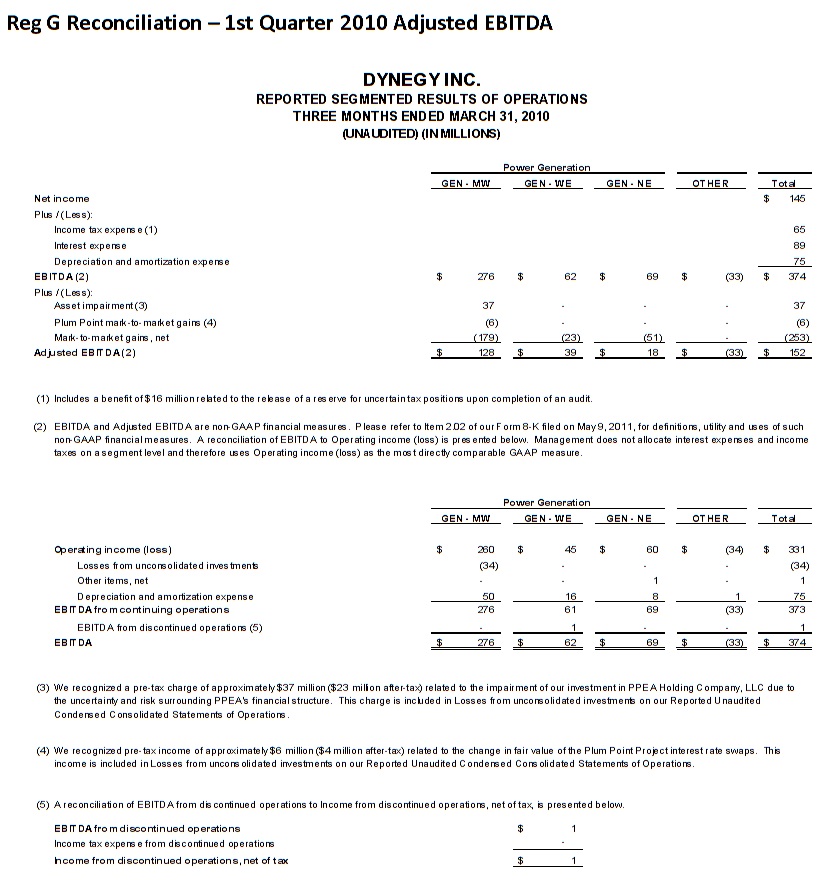
• This compares to net income of $145 million for
2010, which primarily reflects after-tax mark-to-
market gains of $152 million, partially offset by
an after-tax impairment charge of $23 million
2010, which primarily reflects after-tax mark-to-
market gains of $152 million, partially offset by
an after-tax impairment charge of $23 million
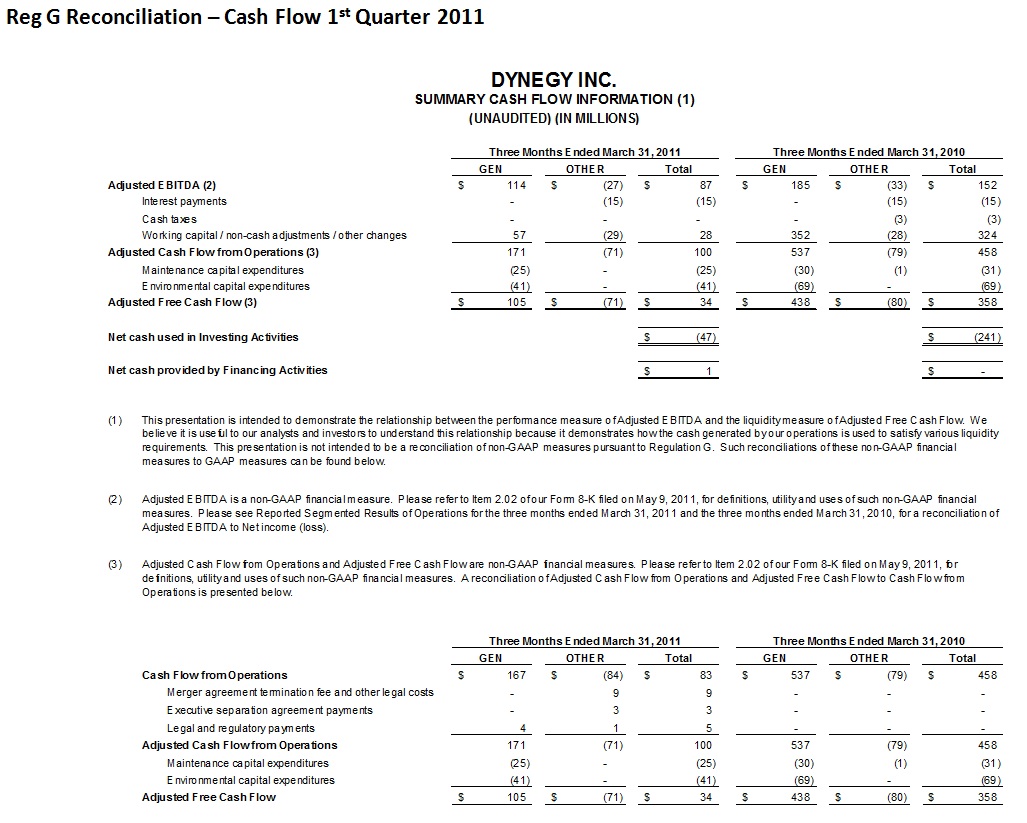
(1) Net debt and other obligations is a non-GAAP measure, please see the reconciliation on the Capital
Structure page in the Appendix; and for definition and uses, please see the Debt Definitions page in the
Appendix. (2) Restricted cash includes $850 million related to Term Letter of Credit facility. (3) Working capital
was higher in 1Q2010 primarily due to cash received from the company’s collateral clearing agent as a result
of changes in the value of financial positions, which were significantly impacted by lower power prices. (4) For
additional information see the Collateral page in the Appendix.
|
First Quarter Results ($MM)
|
2010
|
2011
|
|
Adjusted EBITDA
|
$ 152
|
$87
|
|
Interest payments
|
(15)
|
(15)
|
|
Working capital changes(3)/Collateral(4)/Cash
Taxes |
321
|
28
|
|
Adjusted cash flow from operations
|
$ 458
|
$ 100
|
|
Maintenance capital expenditures
|
(31)
|
(25)
|
|
Environmental capital expenditures
|
(69)
|
(41)
|
|
Adjusted free cash flow
|
$ 358
|
$ 34
|
|
|
|
|
|
Net income/(Loss)
|
$ 145
|
$ (77)
|
|
|
|
|
|
Net cash provided by operating activities
|
$ 458
|
$ 83
|
|
Net cash used in investing activities
|
$ (241)
|
$ (47)
|
|
Net cash provided by financing activities
|
$ 0
|
$ 1
|

6
Midwest - 1Q11 Period-Over-Period
Regional Performance Drivers
Regional Performance Drivers
Maint.
Enviro.
$ Million
Adjusted EBITDA
CapEx
• 1Q Adjusted EBITDA decreased 25% period-over-period primarily
due to
due to
– Energy contributions from physical transactions(1) increased due to fewer
planned outages, in addition to increased spark spreads for CCGT’s
planned outages, in addition to increased spark spreads for CCGT’s
– Energy contributions from financial transactions(1) declined due to lower
value received per MWh in 2011
value received per MWh in 2011
– Decreased tolling revenues of ~$20MM resulting from the early termination
of a long-term toll on Kendall in 1Q2010
of a long-term toll on Kendall in 1Q2010
– Increased capacity revenues due to higher PJM capacity prices and more
capacity for sale from Kendall due to the early termination of a long-term toll,
offset by reduced capacity revenues due to lower MISO capacity prices
capacity for sale from Kendall due to the early termination of a long-term toll,
offset by reduced capacity revenues due to lower MISO capacity prices
– Basis impact was ~$(5)MM quarter-over-quarter
– Average CIN-Avg Gen basis 1Q11 was $4.64/MWh compared to
$2.55 for 1Q10
$2.55 for 1Q10
• 1Q overall volumes increased from 6.4 MM MWhs to 7.2 MM
MWhs or 12% period-over-period primarily due to:
MWhs or 12% period-over-period primarily due to:
– Fewer planned outages and increased spark spreads for CCGT’s
– 84% , 20% and 51% capacity factors in 1Q11 compared to 86%, 9% and 29%
capacity factors in 1Q10 for the coal fleet, Kendall and Ontelaunee,
respectively
capacity factors in 1Q10 for the coal fleet, Kendall and Ontelaunee,
respectively
• 1Q CapEx decreased due to reduced Consent Decree spending
and fewer planned outages
• Midwest coal fleet achieved in-market-availability of 92%
GAAP Measures:
• 1Q11 Operating Loss reflects pre-tax MTM gains of $1 million
• 1Q10 Operating Income reflects pre-tax MTM gains of $179 million
$44
(1) Financial transactions refer to hedging activities that include financial swaps and options activity, while physical transactions can be defined as generation sales

7
West - 1Q11 Period-Over-Period
Regional Performance Drivers
Regional Performance Drivers
• 1Q Adjusted EBITDA decreased 92% period-over-period
primarily due to
primarily due to
– Less revenue of ~$15MM as a result of net sales of fewer options at lower
premiums
premiums
– Less revenue of ~$5MM for Moss Landing due to timing of payments under a
new agreement compared to timing of payments under the previous
agreement
new agreement compared to timing of payments under the previous
agreement
• 1Q overall volumes decreased from 1.4MM MWhs to
0.4MM MWhs or 70% period-over-period due to
compressed spark spreads
0.4MM MWhs or 70% period-over-period due to
compressed spark spreads
– 1Q11 capacity factor for Moss Landing 1&2 of 15% compared to 1Q10 capacity
factor of 58%
factor of 58%
• 1Q CapEx reduced slightly due to lower maintenance and
environmental expenditures compared to 1Q10
environmental expenditures compared to 1Q10
GAAP Measures:
• 1Q11 Operating Income reflects pre-tax MTM gains of $15
million
million
• 1Q10 Operating Income reflects pre-tax MTM gains of $23
million
million
$ Million
Adjusted EBITDA
CapEx
8
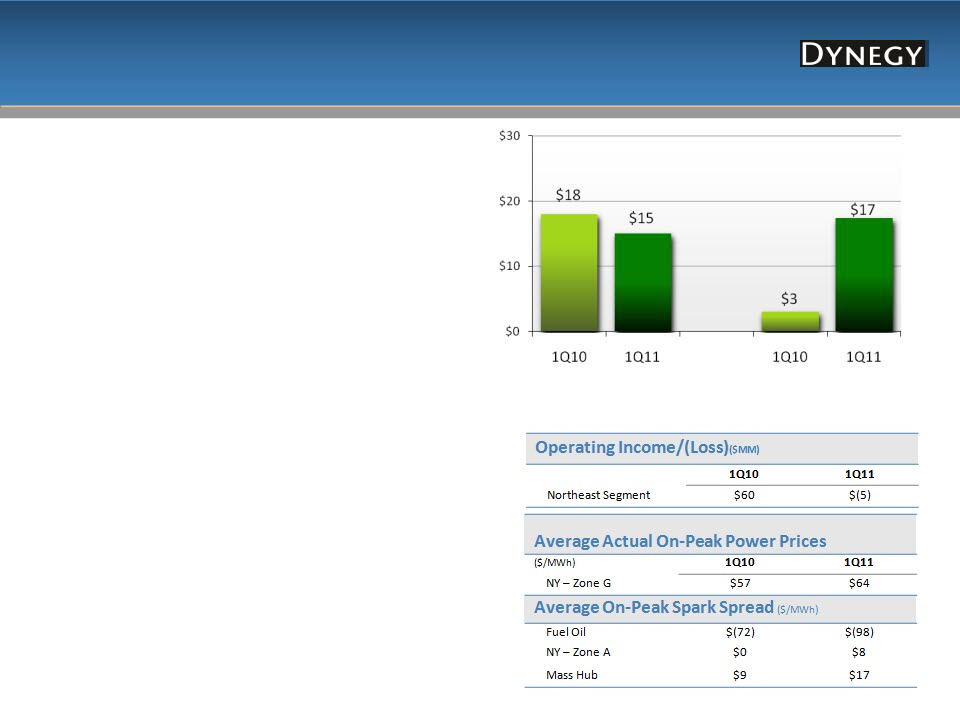
Northeast - 1Q11 Period-Over-Period
Regional Performance Drivers
Regional Performance Drivers
• 1Q Adjusted EBITDA down 17% period-over-period due to
– Energy contributions from physical transactions(1) increased due to increased
prices and spark spreads partially offset by an outage at Casco Bay
prices and spark spreads partially offset by an outage at Casco Bay
– Energy contributions from financial transactions(1) declined due to lower
value received per MWh in 2011
value received per MWh in 2011
– Less revenue of ~$5MM as a result of net sales of fewer options at lower
premiums
premiums
– Less revenue of ~$5MM from capacity sales as a result of lower capacity
pricing
pricing
• 1Q overall volumes were flat at 1.5 MM MWhs for both periods
– Increase in volumes due to improved spark spreads for CCGT’s offset by Casco
Bay outage
Bay outage
– 37%, 15% and 41% capacity factors in 1Q11 compared to 47%, 49% and 18%
capacity factors in 1Q10 for Danskammer, Casco Bay and Independence,
respectively
capacity factors in 1Q10 for Danskammer, Casco Bay and Independence,
respectively
• 1Q CapEx increased due to an outage at Casco Bay
• Danskammer achieved in-market-availability of ~95%
GAAP Measures:
• 1Q11 Operating Loss reflects pre-tax MTM losses of $13 million
• 1Q10 Operating Income reflects pre-tax MTM gains of $51 million
$ Million
Adjusted EBITDA
CapEx
(1) Financial transactions refer to hedging activities that include financial swaps and options activity, while physical transactions can be defined as generation sales

Financial Estimates
9
In light of recent management and board changes and the need to review and
possibly revise the company’s strategic plans, as well as the on-going consideration
of restructuring alternatives, Dynegy currently does not intend to provide guidance
estimates for 2011. Further, we have not updated nor do we intend to update, or
otherwise revise, the financial forecasts (the “Forecasts”) provided in Dynegy’s
Solicitation/Recommendation Statement on Schedule 14D-9 filed with the SEC by
Dynegy on December 30, 2010 and its Preliminary Proxy Statement on Schedule
14A filed with the SEC by Dynegy on January 10, 2011. Consequently, readers are
cautioned not to rely on such Forecasts. The company will reconsider at a later time
whether it will provide guidance estimates for 2011 and future years.

Appendix

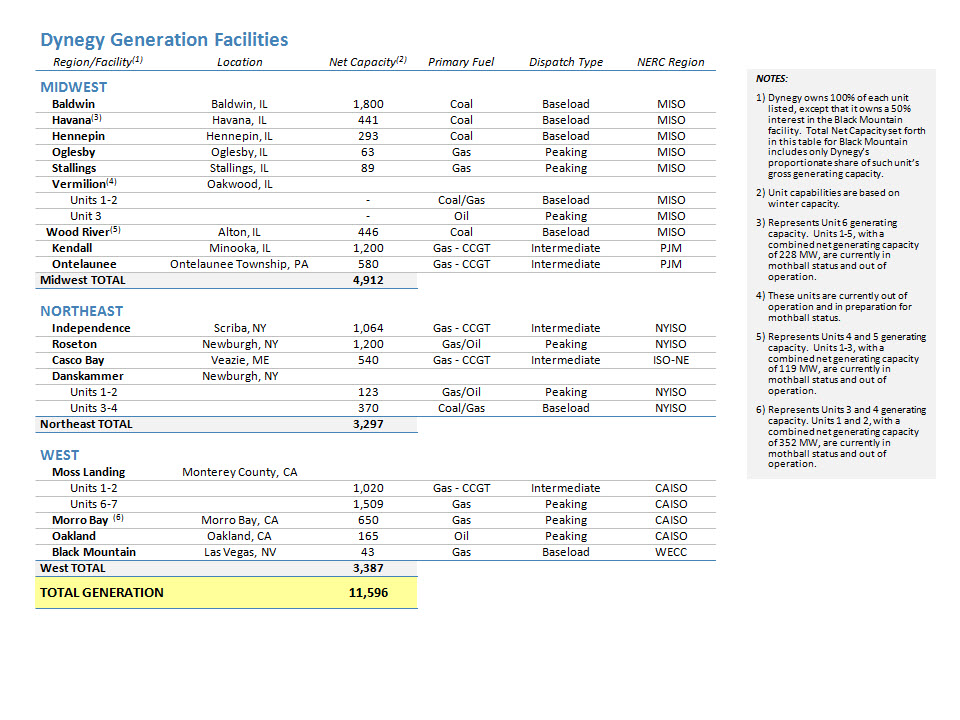
Dynegy’s Diversified Asset Portfolio
Dispatch Diversity
Peaking
33%
Intermediate
38%
Baseload
29%
Geographic Diversity
Midwest
42%
Northeast
29%
West
29%
Fuel Diversity
Combined Cycle
38%
Peaking
20%
Total Gas-Fired
58%
Coal
29%
Fuel Oil
13%
11

Significant Environmental Progress
12
On target to further reduce emissions in the Midwest
• Estimate of remaining cash spend is ~$193 million from
3/31/11 through 2013; estimated total expense is ~$960
million
3/31/11 through 2013; estimated total expense is ~$960
million
• Baldwin 3 scrubber was put in service at the end of 2010 and
is performing as expected
is performing as expected
• All projects include installing baghouses and scrubbers with
the exception of Hennepin, which has baghouses only
the exception of Hennepin, which has baghouses only
Labor
~76%
Rental Equipment
& Other ~4%
& Other ~4%
Estimated Go Forward
Cost Composition
Materials
~20%
2008
2010
2009
2011
2012
2007
Hennepin
Baldwin 3
Baldwin 1
Baldwin 2
Havana
Projects complete
Cash outflow
continues
through 2013
continues
through 2013

13
Mark-to-Market (Pre-tax)
|
($ Million)
|
3 Months Ending 3/31/10
|
3 Months Ending 3/31/11
|
||||||
|
Quarter
|
Midwest
|
West
|
Northeast
|
TOTAL
|
Midwest
|
West
|
Northeast
|
TOTAL
|
|
MTM for positions settled or to
be settled in the current year |
74
|
22
|
26
|
122
|
(4)
|
10
|
(3)
|
3
|
|
MTM gain/(losses) for future
period positions |
105
|
1
|
25
|
131
|
5
|
5
|
(10)
|
0
|
|
Total MTM adjustment
|
179
|
23
|
51
|
253
|
1
|
15
|
(13)
|
3
|
• Option premiums are recognized in period received (paid) and are excluded from MTM impacts shown above
• A significant amount of MTM for future period positions has been settled in cash through a brokerage account
Note: Table includes MTM for both continuing and discontinued operations
14
Commodity Pricing
Cin Hub/Cinergy ($/MWh)
New York Zone G ($/MWh)
NP-15 ($/MWh)
Natural Gas ($/MMBtu)
2011 A/F (Apr): $40.33
2011 A/F (Feb): $38.35
2010A: $42.40
(1) Pricing as of 2/10/11. Prices reflect actual day ahead on-peak settlement prices for 1/1/11 - 2/10/2011 and quoted forward on-peak monthly prices for 2/11/2011-12/31/11 (2) Pricing as of
4/18/2011. Prices reflect actual day ahead on-peak settlement prices for 1/1/11 - 4/18/2011 and quoted forward on-peak monthly prices for 4/18/2011 - 12/31/11
4/18/2011. Prices reflect actual day ahead on-peak settlement prices for 1/1/11 - 4/18/2011 and quoted forward on-peak monthly prices for 4/18/2011 - 12/31/11
2011 Actual/Forward as of 2/10/2011(1)
2011 Actual/Forward as of 4/18/2011(2)
2010 Actual
2011 A/F (Apr): $37.27
2011 A/F (Feb): $38.43
2010A: $39.92
2011 A/F (Apr): $4.30
2011 A/F (Feb): $4.29
2010A: $4.38
2011 A/F (Apr): $58.01
2011 A/F (Feb): $56.30
2010A: $59.19

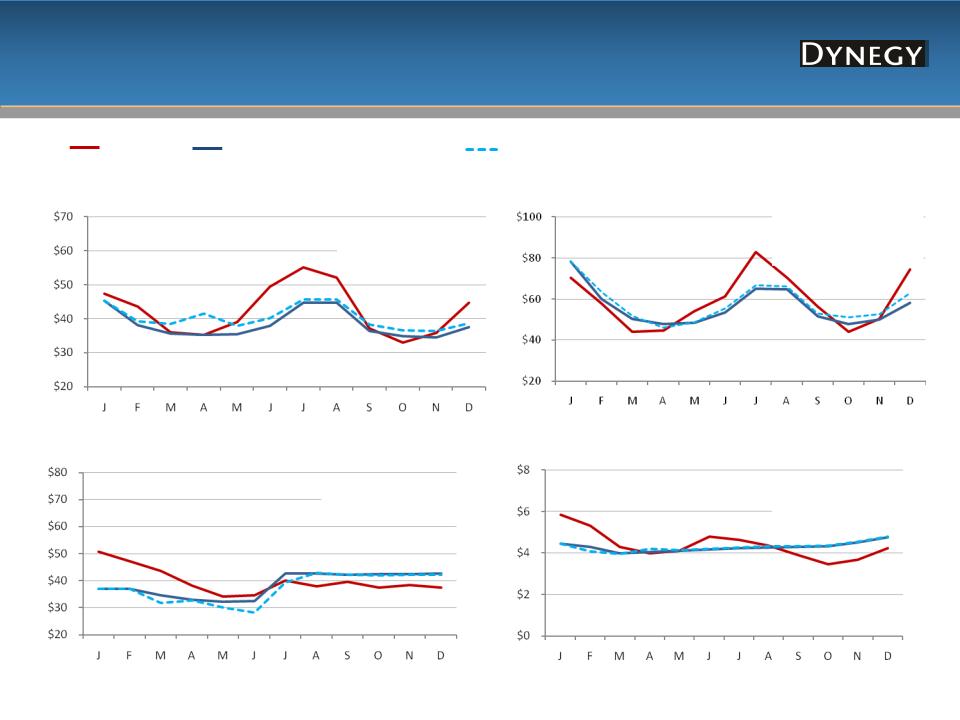
15
Spark Spreads
PJM West ($/MWh)
Mass Hub ($/MWh)
NI Hub ($/MWh)
NP-15 ($/MWh)
2011 A/F (Apr): $16.31
2011 A/F (Feb): $14.68
2010A: $18.69
2011 Actual/Forward as of 2/10/2011(1)
2011 Actual/Forward as of 4/18/2011(2)
2010 Actual
2011 A/F (Apr): $17.34
2011 A/F (Feb): $15.02
2010A: $18.48
2011 A/F (Apr): $8.14
2011 A/F (Feb): $7.08
2010A: $9.82
2011 A/F (Apr): $4.35
2011 A/F (Feb): $6.44
2010A: $6.06
(1) Pricing as of 2/10/11. Prices reflect actual day ahead on-peak settlement prices for 1/1/11 - 2/10/2011 and quoted forward on-peak monthly prices for 2/11/2011-12/31/11 (2) Pricing as of
4/18/2011. Prices reflect actual day ahead on-peak settlement prices for 1/1/11 - 4/18/2011 and quoted forward on-peak monthly prices for 4/18/2011 - 12/31/11
4/18/2011. Prices reflect actual day ahead on-peak settlement prices for 1/1/11 - 4/18/2011 and quoted forward on-peak monthly prices for 4/18/2011 - 12/31/11

16
• Total balance sheet debt as of 3/31/11 is ~$4.8B
- $79 million of the 2011 notes were repaid 4/1/11
• $850 million due in 2013 is a synthetic letter of credit facility supported by $850 million of
restricted cash
restricted cash
- Reclassified as current debt on consolidated balance sheet since it is likely that we will not
be able to comply with one of the financial covenants beginning in third or fourth quarter
2011
be able to comply with one of the financial covenants beginning in third or fourth quarter
2011
• Excludes $604 million related to Central Hudson lease
Debt Maturity Profile (as of 3/31/11, $MM)
17
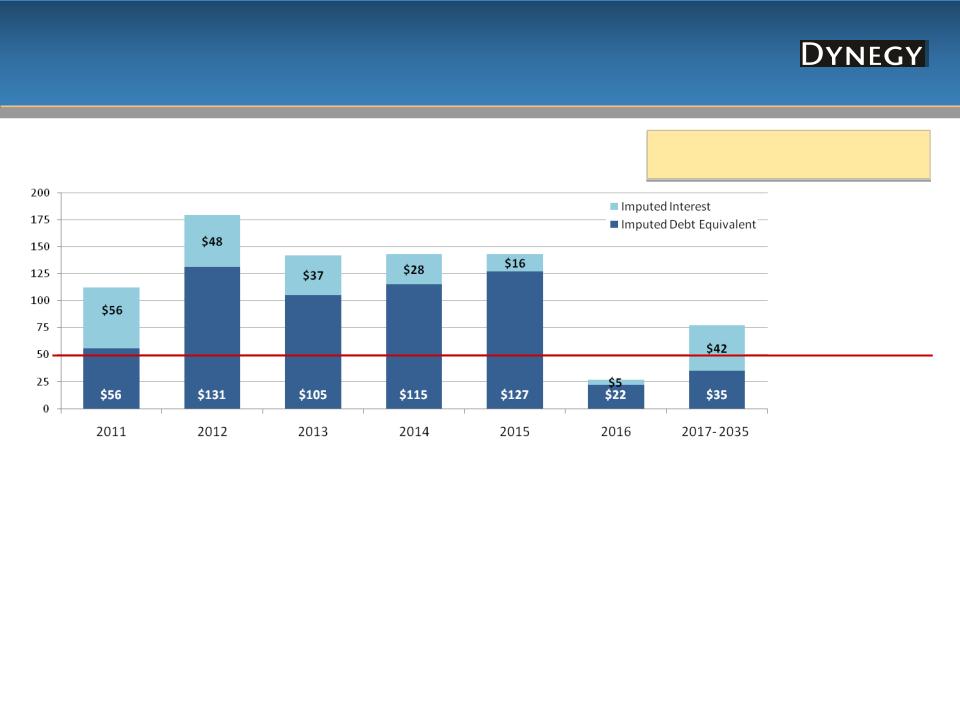
Central Hudson Lease - Northeast Segment
Central Hudson Cash Payments (remaining as of 3/31/11, $MM)
Imputed Debt Equivalent at PV (10%) of
future lease payments = $604MM(1)
future lease payments = $604MM(1)
$112
$179
$142
$143
$143
$77
• Chart represents total cash lease payments, which are included in Operating Cash Flows
• Lease expense is approximately $50 million per year and included in Operating Expense
Central Hudson treated as Lease (2)
(as currently shown in GAAP financials):
(as currently shown in GAAP financials):
• Income Statement - $50 million lease expense included in
Adjusted EBITDA; no interest expense or depreciation &
amortization expense
Adjusted EBITDA; no interest expense or depreciation &
amortization expense
• Cash Flow Statement - $112 million cash payments in 2011
included in Operating Cash Flows
included in Operating Cash Flows
• Balance Sheet - lease obligation not included in debt balance
Central Hudson treated as Debt (2)
(would require the following adjustments to GAAP financials):
(would require the following adjustments to GAAP financials):
•Income Statement - Add back $50 million lease expense to Adjusted EBITDA; add $56
million imputed interest expense to Interest Expense; add $23 million estimated
depreciation & amortization expense; adjust tax expense for net difference
million imputed interest expense to Interest Expense; add $23 million estimated
depreciation & amortization expense; adjust tax expense for net difference
– Depreciation & Amortization calculated using purchase price of $920 million divided by 40 years
•Cash Flow Statement - Add back $56 million of imputed principal to Operating Cash Flows
– $112 million cash payments in 2011 split between $56 million imputed interest payment
(Operating Cash Flows) and $56 million imputed principal payment (Financing Cash Flows)
(Operating Cash Flows) and $56 million imputed principal payment (Financing Cash Flows)
•Balance Sheet - Include $604 million total PV (10%) of future lease payments
(1) PV of payments calculated as of 3/31/11 ; (2) Calculated on an annual basis
Accrual Lease Expense (2)
$27

18
Capital Structure
Debt & Other Obligations as of 3/31/11
Dynegy Power Corp.
Central Hudson(2) $604
Dynegy Holdings Inc.
$1,080 Million Revolver(1) $0
Term L/C Facility $850
Tranche B Term $68
Sr. Unsec. Notes/Debentures $3,450
Sub.Cap.Inc.Sec (“SKIS”) $200
Dynegy Inc.
Senior Debentures $225
Sithe Energies
|
TOTALS ($ Million)
|
3/31/11
|
|
Secured
|
$918
|
|
Secured Non-Recourse
|
$225
|
|
Unsecured
|
$3,650
|
|
Lease Obligation
|
$604
|
|
($ Million)
|
3/31/11
|
|
Total Obligations
|
$5,397
|
|
Less: Cash & short-term investments
|
404
|
|
Less: Restricted cash(3)
|
850
|
|
Net Debt & Other Obligations
|
$4,143
|
|
Less: Central Hudson Lease Obligation
|
604
|
|
Net Debt
|
$3,538
|
(1) Represents drawn amounts under the revolver; actual capacity of revolver was $1.08 Billion as of 3/31/2011;
(2) Represents PV (10%) of future lease payments. Central Hudson lease payments are unsecured obligations of
Dynegy Inc., but are a secured obligation of an unrelated third party (“lessor”) under the lease. DHI has
guaranteed the lease payments on a senior unsecured basis; (3) Restricted cash includes $850MM related to the
Synthetic Letter of Credit facility

19
Collateral Excluding Clearing Settlements
|
($MM)
|
12/31/10
|
|
3/31/11
|
|
5/2/2011
|
|
Generation
|
$ 377
|
|
$ 470
|
|
$ 483
|
|
Other
|
85
|
|
87
|
|
173
|
|
Total
|
$ 462
|
|
$ 557
|
|
$ 656
|
|
|
|
|
|
|
|
|
Cash and short-term investments
|
$ 87
|
|
$ 118
|
|
$ 112
|
|
LCs
|
375
|
|
439
|
|
544
|
|
Total
|
$ 462
|
|
$ 557
|
|
$ 656
|
• Changes in generation collateral include initial margin postings related to hedging activity for 2010-2012
− Increase in generation collateral from 12/31/10 to 3/31/11 primarily due to higher initial margin posting requirements and reduction in usage of
bilateral first lien collateral arrangements
bilateral first lien collateral arrangements
• Other collateral includes Sithe Debt Service Reserve of $83 million
- Increase in other collateral from 3/31/11 to 5/2/11 primarily due to contractual obligations under certain operational agreements
• Changes in cash and short-term investments include initial margin postings related to hedging activity for 2010-2012
− Increase in cash and short-term investments from 12/31/10 to 3/31/11 reflects increased postings to our futures clearing manager primarily due
to higher initial margin requirements
to higher initial margin requirements
• Increase in LCs from 3/31/11 to 5/2/11 primarily due to contractual obligations under certain operational agreements
• In addition to cash and LCs posted as collateral, we have granted additional permitted first priority liens on the assets currently
subject to first priority liens under our Credit Facility. The fair value collateralized by first priority liens, netted by counterparty,
includes liabilities of $30 million, $14.5 million and $8 million at 12/31/10, 3/31/11 and 5/2/11, respectively.
subject to first priority liens under our Credit Facility. The fair value collateralized by first priority liens, netted by counterparty,
includes liabilities of $30 million, $14.5 million and $8 million at 12/31/10, 3/31/11 and 5/2/11, respectively.

20
• Due to covenant limitations, decrease
in revolver availability of $431 million
at 3/31/2011
in revolver availability of $431 million
at 3/31/2011
• Decrease in cash from 3/31/2011 to
5/2/2011 due to the payment of 2011
notes that matured on 4/1/2011 and
debt interest payments, partially offset
by maturity of short-term investments
5/2/2011 due to the payment of 2011
notes that matured on 4/1/2011 and
debt interest payments, partially offset
by maturity of short-term investments
• Decrease in availability from
3/31/2011 to 5/2/2011 due to an
increase in outstanding letters of credit
due to contractual obligations under
certain operational agreements
3/31/2011 to 5/2/2011 due to an
increase in outstanding letters of credit
due to contractual obligations under
certain operational agreements
• Currently there is no availability under
the $150MM contingent letter of
credit facility
the $150MM contingent letter of
credit facility
– Under terms of this facility, up to
$150 million of capacity can become
available based on increases in spark
spreads and power prices for 2012
positions
$150 million of capacity can become
available based on increases in spark
spreads and power prices for 2012
positions
Liquidity
21
Contracted Generation Volumes
|
2011 Contracted Generation Volumes as of:
|
|
|
|
|
|
|
|
|||||
|
|
Dec 08
|
Feb 09
|
May 09
|
Aug 09
|
Nov 09
|
Jan 10
|
Feb 10
|
May 10
|
Jul 10
|
Oct 10
|
Feb 11
|
Apr 11
|
|
Midwest
|
5%
|
5%
|
5%
|
15%
|
50%
|
75%
|
75%
|
90%
|
100%
|
95%
|
100%
|
100%
|
|
West
|
20%
|
20%
|
20%
|
40%
|
50%
|
>95%
|
>95%
|
>95%
|
100%
|
100%
|
100%
|
100%
|
|
Northeast
|
10%
|
5%
|
5%
|
15%
|
60%
|
>95%
|
>95%
|
>95%
|
100%
|
85%
|
100%
|
95%
|
|
Consolidated
|
10%
|
10%
|
10%
|
20%
|
50%
|
85%
|
85%
|
95%
|
100%
|
95%
|
100%
|
100%
|
|
2012 Contracted Generation Volumes as of:
|
|
|
|
|
||||
|
|
Nov 09
|
Jan 10
|
Feb 10
|
May 10
|
Jul 10
|
Oct 10
|
Feb 11
|
Apr 11
|
|
Midwest
|
0%
|
0%
|
0%
|
5%
|
15%
|
20%
|
25%
|
30%
|
|
West
|
15%
|
50%
|
50%
|
50%
|
50%
|
40%
|
45%
|
45%
|
|
Northeast
|
10%
|
10%
|
15%
|
25%
|
40%
|
35%
|
45%
|
70%
|
|
Consolidated
|
5%
|
15%
|
15%
|
15%
|
25%
|
25%
|
30%
|
40%
|

22
Debt Definitions
Debt Measures: We believe that our debt measures are useful because we consider these
measures as a way to evaluate our progress toward our strategic corporate objective of reducing
our overall indebtedness. In addition, many analysts and investors use these measures for
valuation analysis purposes. The most directly comparable GAAP financial measure to the below
measures is GAAP debt.
– “Net Debt” - We define “Net Debt” as total GAAP debt less cash and cash equivalents and restricted cash.
Restricted cash in this case consists only of collateral posted for the credit facility at the end of each
period.
Restricted cash in this case consists only of collateral posted for the credit facility at the end of each
period.
– “Net Debt and Other Obligations” - We define “Net Debt and Other Obligations” as total GAAP debt plus
certain operating lease commitments less cash and cash equivalents and restricted cash. Restricted cash in
this case consists only of collateral posted for the credit facility at the end of each period.
certain operating lease commitments less cash and cash equivalents and restricted cash. Restricted cash in
this case consists only of collateral posted for the credit facility at the end of each period.
24
Reg G Reconciliation -1st Quarter 2011 Adjusted EBITDA
25
26