Attached files
| file | filename |
|---|---|
| 8-K - THE BANCORP, INC. FORM 8-K - Bancorp, Inc. | bancorp8k.htm |
Exhibit 99.1

NASDAQ: TBBK
The Bancorp, Inc. • Investor Presentation • JMP Securities Conference
May 9, 2011
May 9, 2011

Forward-Looking Statements
Safe Harbor Statement under the Private Securities Litigation Reform Act of 1995:
Statements in this presentation regarding The Bancorp, Inc.’s business that are not historical facts are
“forward-looking statements” that involve risks and uncertainties. These statements may be identified
by the use of forward-looking terminology, including the words “may,” “believe,” “will,” “expect,”
“anticipate,” “estimate,” “continue,” or similar words. For further discussion of these risks and
uncertainties, see The Bancorp, Inc.’s filings with the SEC, including the “risk factors” section of
The Bancorp, Inc.’s prospectus supplement. These risks and uncertainties could cause actual results
to differ materially from those projected in the forward-looking statements. The forward-looking
statements speak only as of the date of this presentation. The Bancorp, Inc. does not undertake to
publicly revise or update forward-looking statements in this presentation to reflect events or
circumstances that arise after the date of this presentation, except as may be required under
applicable law.
1

The Bancorp, Inc. - Planning for Growth with Safety and Soundness
• Strategic Goal:
§ Create and grow a stable, profitable institution with the optimum reliance on capital, risk management and
technology, and manage it with knowledgeable and experienced management and senior officers
technology, and manage it with knowledgeable and experienced management and senior officers
• Tactical Approach:
§ Deposits - Utilize a branchless banking network to gather scalable deposits through strong contractual
relationships at costs significantly below peers
relationships at costs significantly below peers
§ Assets - Focus on asset classes including loans and securities appropriate to our expertise to deliver the
requisite risk-adjusted returns to achieve above peer net interest margins
requisite risk-adjusted returns to achieve above peer net interest margins
§ Non-Interest Income - Generate non-interest income, through our deposit and asset approaches, sufficient
to at least offset non-interest expenses
to at least offset non-interest expenses
2
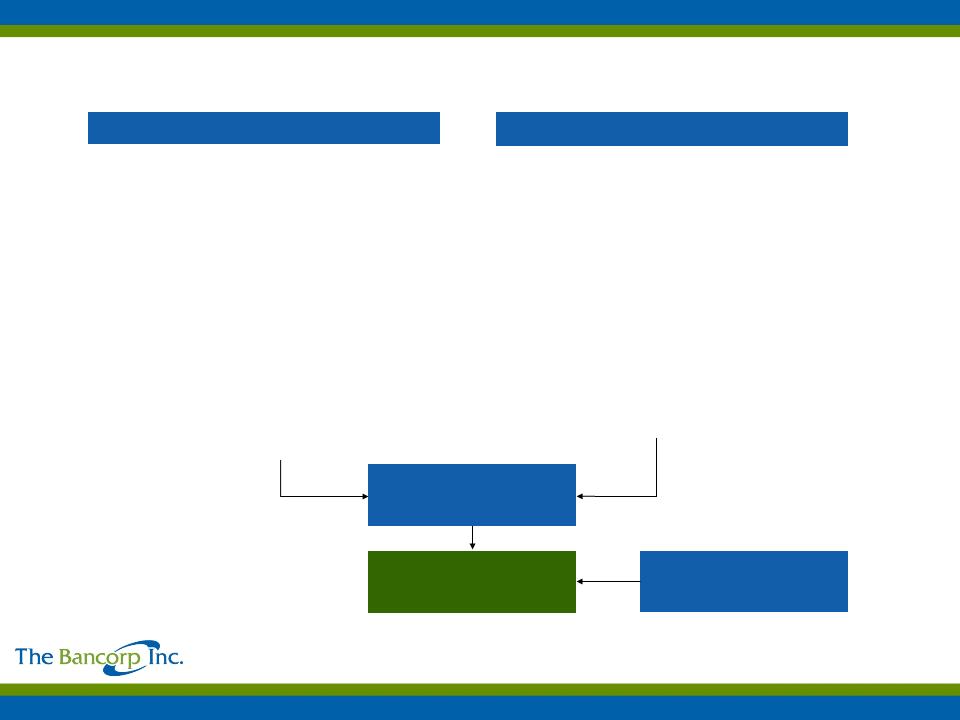
Business Model: A Distinct Business Strategy
3
|
DEPOSITS
|
|
• Private-Label Banking: stable, lower-cost core deposits
§ Healthcare
§ Merchant Processing
§ Prepaid Cards
§ Wealth Management
• Community Bank
|
|
Net Interest Margin
|
|
INCOME
|
|
Non-Interest Income:
Stored value, leasing and
merchant processing
|
|
ASSETS
|
|
• Above-peer credit quality, well-collateralized loans
to local businesses and individuals in the Philadelphia/Wilmington market area: § Commercial lending, commercial & residential
real estate, construction lending • Automobile Fleet Leasing
• Wealth Management Lending:
§ Securities backed loans
• SBA Guaranteed Lending Program for National
Franchises • Securities Portfolio:
§ Primarily highly rated government obligations
|

Deposit-Generating Strategies: Our Distinct Approach
The Bancorp employs a multi-channel growth strategy in gathering attractively priced, long-duration deposits
on a national scale.
on a national scale.
• Private-Label Banking
§ Provider of private-label banking services to more than 300 non-bank financial service
providers
providers
§ Access to large customer groups at lower acquisition costs
§ Private-label customers derive from four main sources:
• Healthcare
• Stored Value, including Prepaid Cards
• Wealth Management
• Merchant Processing
• Community Bank
4

Deposit-Generating Strategies: Growth and Low Cost
The Bancorp has experienced strong growth in deposits at below-peer costs.
5
|
Growth in Average Deposits
|
|||
|
|
YTD Average Deposits
(dollars in thousands)
|
Cost of Funds
|
Peer Cost of Funds(1)
|
|
2011
|
$ 2,730,507
|
0.41%
|
1.14%
|
|
2010
|
$ 2,085,104
|
0.70%
|
1.45%
|
|
Increase
|
$ 645,403
|
|
|
|
% Increase
|
30.95%
|
|
|
(1) Peer data source as of December 2010: BankRegData of 100 most comparable Banks measuring interest expense to interest bearing assets.
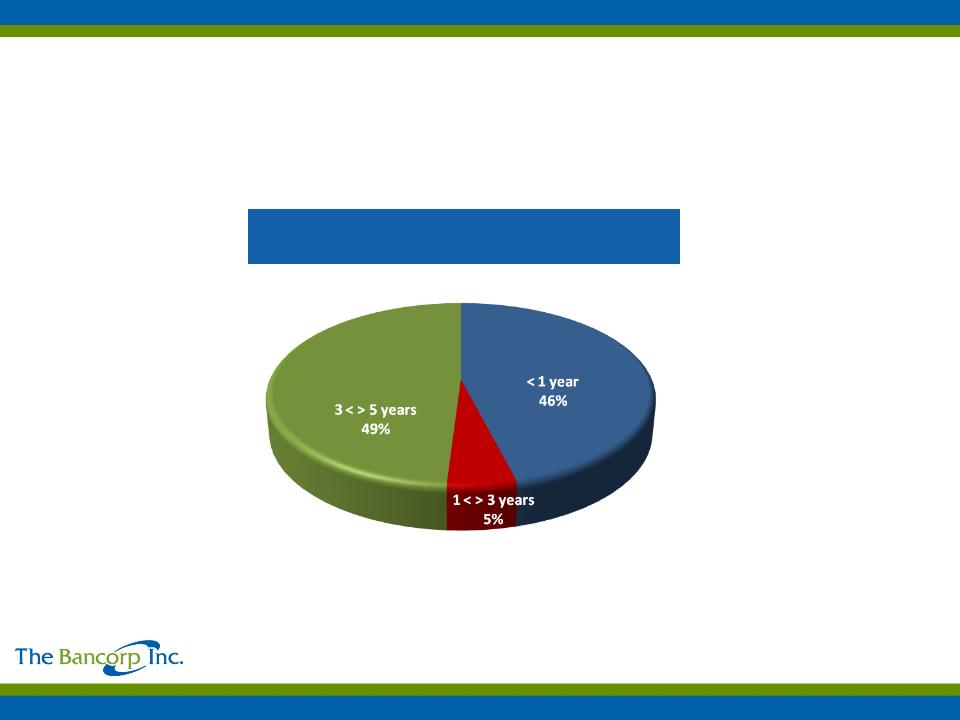
Deposit-Generating Strategies: Sticky and Long-Term
The Bancorp has long-term, often exclusive agreements in place with its private-label banking
partners. We have retained 99% of maturing contracts.
partners. We have retained 99% of maturing contracts.
6
|
Private Label Agreements by Remaining
Contractual Term |
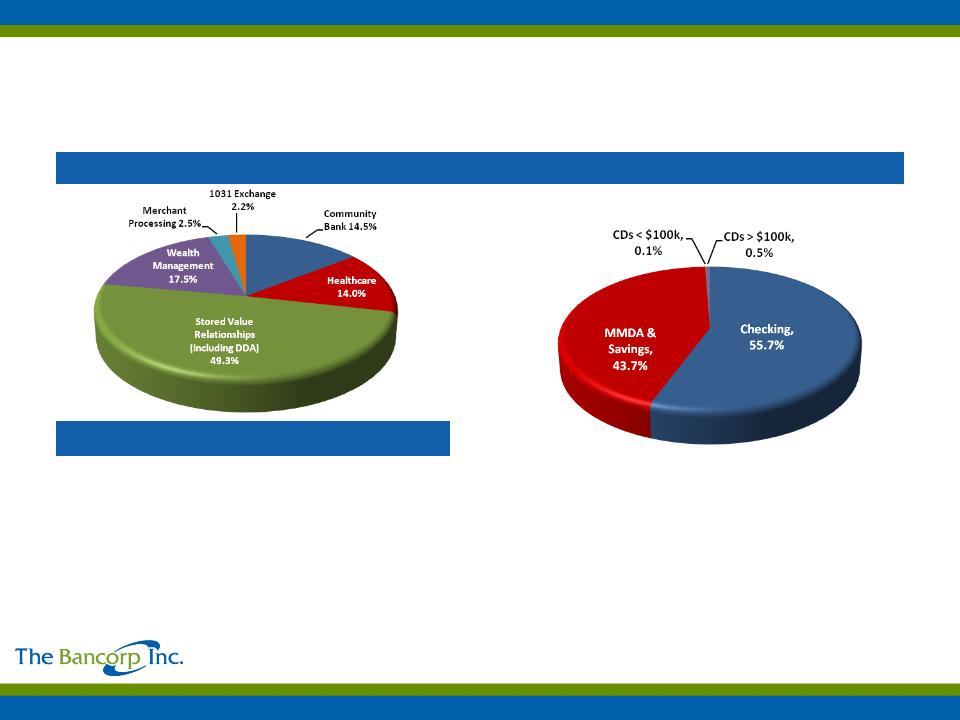
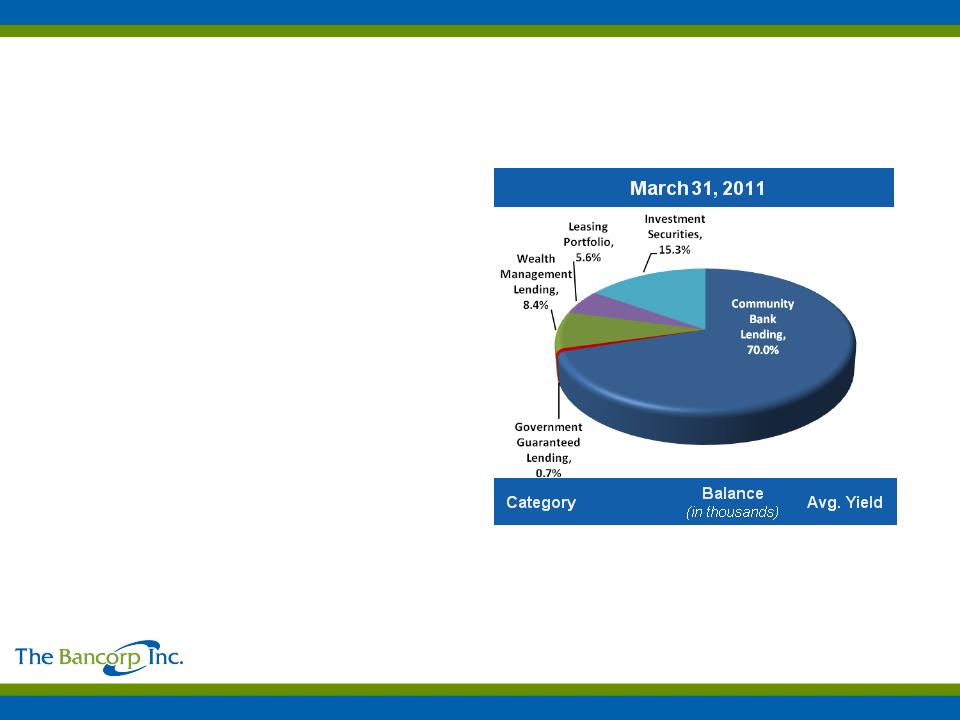
Growth Engine: Where Do Deposits Come From?
Significant growth in stored value, healthcare and other deposit business lines support
significantly lower average cost of deposits.
significantly lower average cost of deposits.
7
|
March 31, 2011
|
|
Category
|
Balance
(in millions)
|
Avg. Cost
|
|
Community Bank
|
$ 367
|
0.47%
|
|
Healthcare
|
$ 354
|
0.93%
|
|
Stored Value Relationships
(including demand deposit accounts) |
$ 1,248
|
0.02%
|
|
Wealth Management
|
$ 444
|
0.70%
|
|
Merchant Processing
|
$ 63
|
0.45%
|
|
1031 Exchange
|
$ 55
|
1.01%
|
|
Total Deposits: $2.5 billion
|
|
Average Cost: 0.38%
|
|
(Peer Average Cost: 1.14%)(1)
|
(1) Peer data source as of December 2010: BankRegData of 100 most comparable Banks measuring interest expense to interest bearing assets.
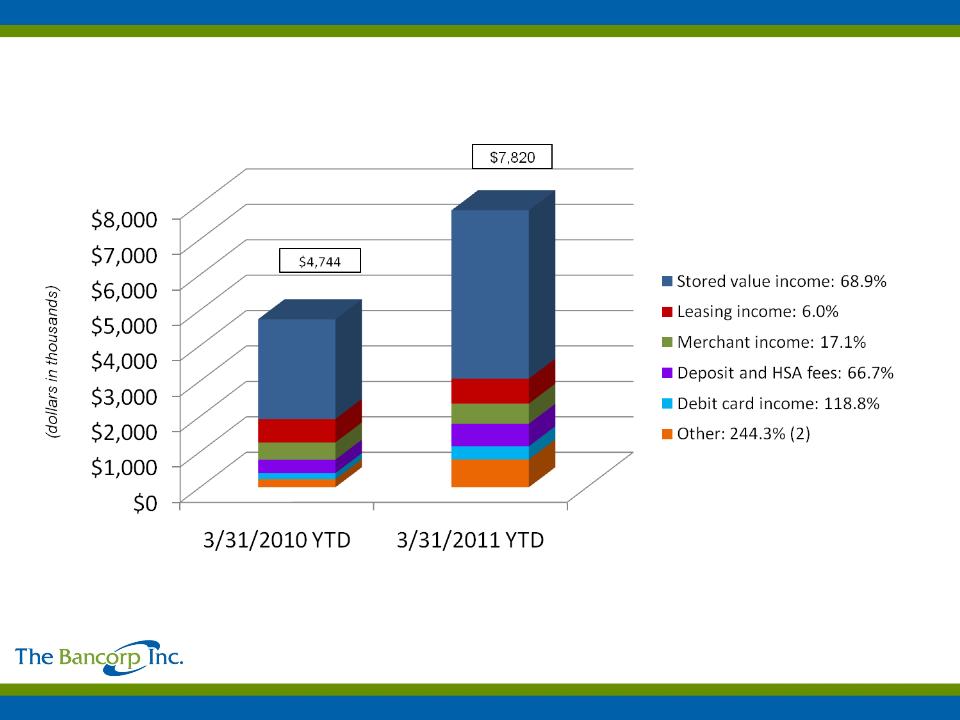
Non-Interest Income-Generating Strategies: Growth and Sustainability
8
(1) Excludes gains on investment securities.
(2) Excluding a one time legal settlement of $485,000 in first quarter 2011 the percentage increase would have been 31.6%.
Continued growth in non-interest income(1) from all business segments.
Primary Asset-Generating Strategies: Business Line Overview
• Community Bank
§ Offers traditional community banking products and services
targeting the highly fragmented Philadelphia/Wilmington
banking market
targeting the highly fragmented Philadelphia/Wilmington
banking market
• Leasing Portfolio
§ Well-collateralized automobile fleet leasing
• Average transaction: 8-15 automobiles, $350,000
• 50% of portfolio leased by state and federal
agencies
agencies
• Wealth Management
§ 16 partners, managing $200 billion in assets
• SEI Investments, Legg Mason
§ Generates securities backed loans and other loans
• Government Guaranteed Lending (GGL)
§ Loans from $150,000 to $5 million primarily to
franchisees such as The UPS Store, Massage Envy, and
FASTSIGNS which are 75% guaranteed by the U.S.
government. Currently $301 million in financing available to
13 franchise systems.
franchisees such as The UPS Store, Massage Envy, and
FASTSIGNS which are 75% guaranteed by the U.S.
government. Currently $301 million in financing available to
13 franchise systems.
• Securities
§ High credit quality tax exempt municipal obligations and
U.S. Government agency securities
U.S. Government agency securities
9
As with funding, The Bancorp employs a multi-channel growth strategy for loan origination,
with the primary driver being its regional commercial banking operations.
with the primary driver being its regional commercial banking operations.
|
Community Bank
|
$ 1,352,661
|
4.34%
|
|
GGL
|
$ 13,014
|
4.55%
|
|
Wealth Management
|
$ 162,954
|
3.20%
|
|
Leasing Portfolio
|
$ 107,624
|
8.40%
|
|
Investment Securities
|
$ 294,941
|
4.54%
|
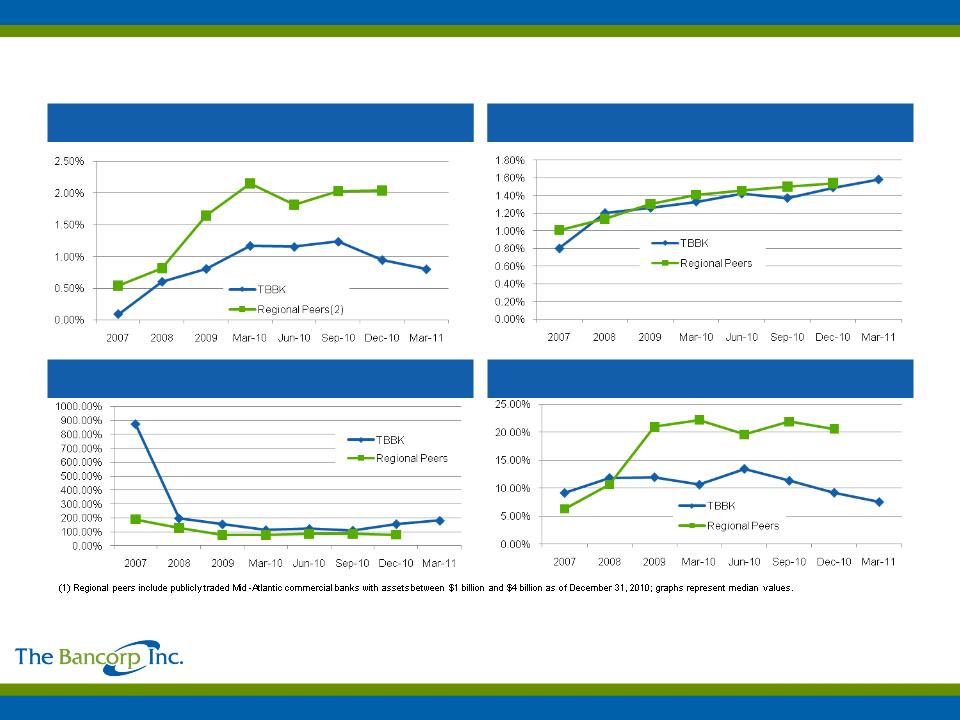
Non-Accrual Loans/Total Loans(1)
Reserves/Loans(1)
Asset Quality Overview
10
(2) Texas Ratio = (Non-accrual Loans + Restructured Loans + Loans 90 + days past due + OREO)/(Loss Reserves + Tangible Equity).
Source: SNL Financial
Reserves/Nonaccrual and Restructured Loans(1)
Texas Ratio - Peers (1),(2)
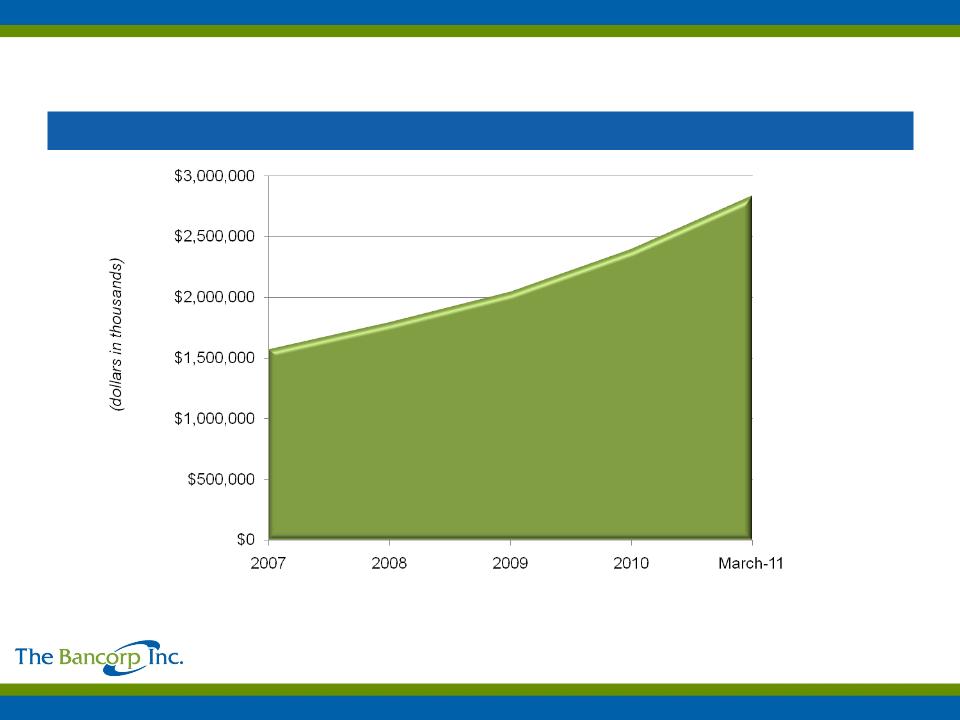
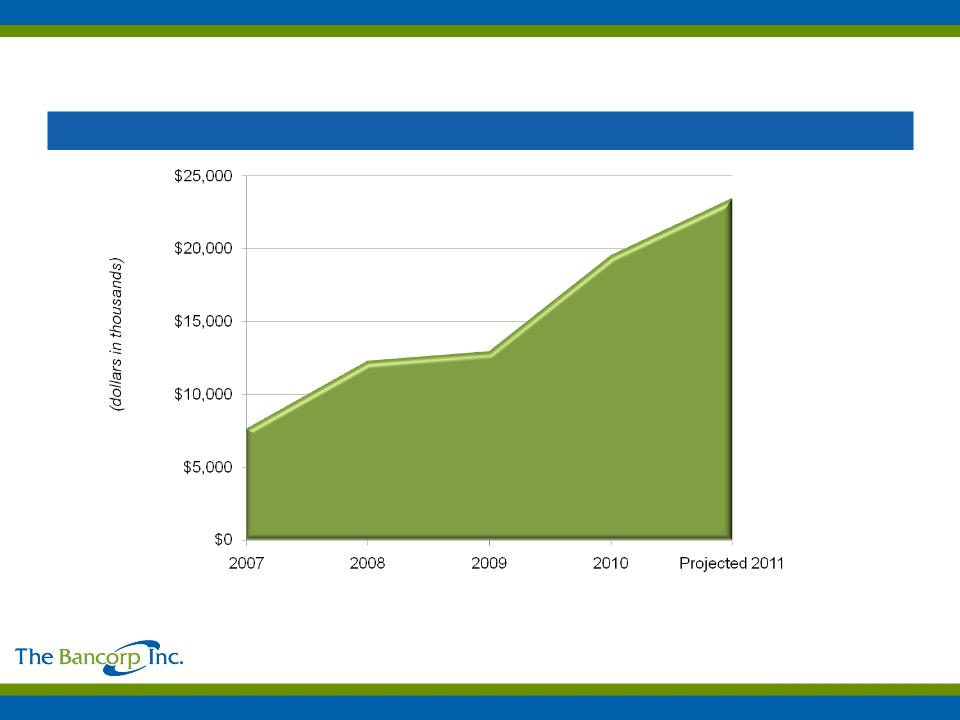
Asset Growth
Results: Key Performance Metrics
11
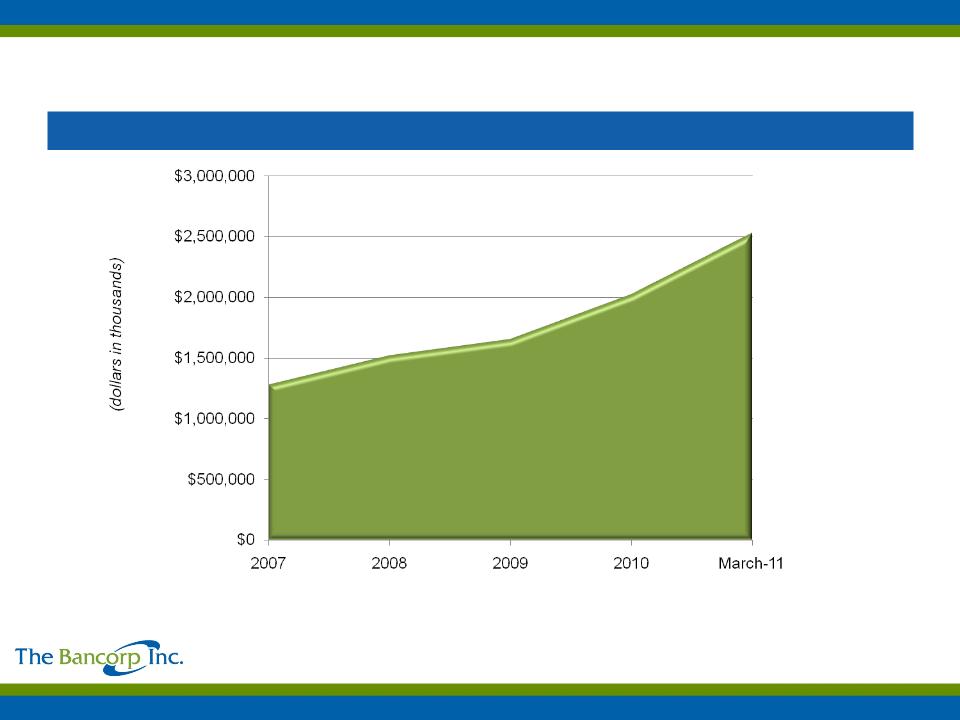
Deposit Growth
Results: Key Performance Metrics
12
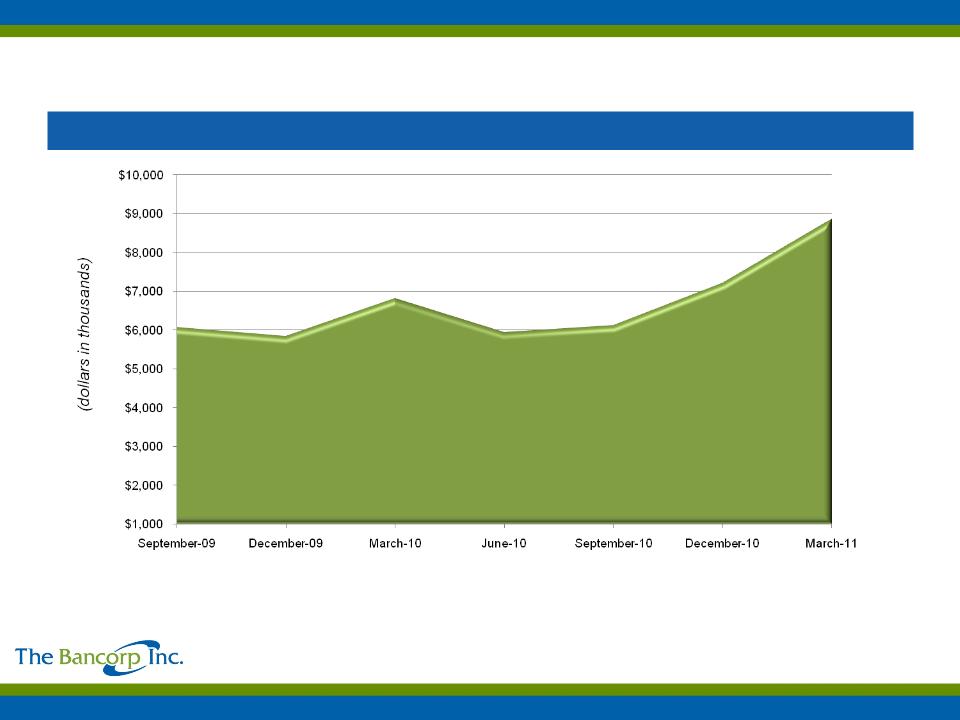
Non-Interest Income (1) (2)
Results: Key Performance Metrics
13
(1) Excludes gains and losses on investment securities.
(2) Projection based on the first quarter of 2011 actual non-interest income and the fourth quarter of 2010 non-interest income projected for three quarters.
Core Operating Earnings(1)
Results: Key Performance Metrics
14
(1) As a supplement to GAAP, Bancorp has provided this non-GAAP performance result. The Company believes that this non-GAAP financial measure is useful because it allows investors to assess its
operating performance. Although this non-GAAP financial measure is intended to enhance investors’ understanding of the Company’s business and performance, it should not be considered an alternative
to GAAP.
operating performance. Although this non-GAAP financial measure is intended to enhance investors’ understanding of the Company’s business and performance, it should not be considered an alternative
to GAAP.

NASDAQ: TBBK
APPENDIX

Capital Ratios and Selected Financial Data
16
|
|
|
As of or for the three months ended
|
|
As of or for the three months ended
|
|
|
|
March 31, 2011
|
|
March 31, 2010
|
|
|
|
(dollars in thousands)
|
|
(dollars in thousands)
|
|
Selected Capital and Asset Quality Ratios:
|
|
|
|
|
|
|
Equity/assets
|
9.08%
|
|
9.66%
|
|
|
Tier 1 capital to average assets
|
8.62%
|
|
8.64%
|
|
|
Tier 1 capital to total risk-weighted assets
|
15.33%
|
|
13.08%
|
|
|
Total Capital to total risk-weighted assets
|
16.58%
|
|
14.33%
|
|
|
Allowance for loan and lease losses to total loans
|
1.58%
|
|
1.33%
|
|
|
||||
|
Balance Sheet Data:
|
|
|
|
|
|
|
Total assets
|
$ 2,836,697
|
|
$ 2,092,513
|
|
|
Total loans, net of unearned costs (fees)
|
$ 1,636,253
|
|
$ 1,527,691
|
|
|
Allowance for loan and lease losses
|
$ 25,802
|
|
$ 20,357
|
|
|
Total cash and cash equivalents
|
$ 853,944
|
|
$ 338,433
|
|
|
Total investments
|
$ 294,941
|
|
$ 177,679
|
|
|
Deposits
|
$ 2,531,109
|
|
$ 1,862,283
|
|
|
Short-term borrowings
|
$ 0
|
|
$ 0
|
|
|
Shareholders’ equity
|
$ 257,601
|
|
$ 202,047
|
|
|
||||
|
Selected Ratios:
|
|
|
|
|
|
|
Return on average assets
|
0.36%
|
|
0.37%
|
|
|
Return on average common equity
|
5.07%
|
|
4.07%
|
|
|
Net interest margin
|
2.72%
|
|
3.06%
|
|
|
Book value per share
|
$ 7.76
|
|
$ 7.72
|
|
|
||||
|
|
||||
|
|
||||

Current Loan Portfolio and Asset Quality Overview at 3/31/2011
17
|
Category
|
Balance
(in
thousands) |
% of Total
Loans |
Nonaccrual
Loans (in thousands)
|
Nonaccrual/
Total Loans
|
OREO
(in thousands)
|
30-89 Days
Delinquent (in thousands)
|
90+ Days
Delinquent (in thousands)
|
Quarter
Charge-offs (net in
thousands) |
|
Commercial
|
$ 430,081
|
26%
|
$ 2,544
|
0.16%
|
$ -
|
$ 7,670
|
$ 1,612
|
$ (2)
|
|
Commercial mortgage
|
$ 601,046
|
37%
|
2,785
|
0.17%
|
1,890
|
2,356
|
824
|
(90)
|
|
Construction
|
$ 202,105
|
12%
|
1,695
|
0.10%
|
1,489
|
1,961
|
391
|
( 2,142)
|
|
Direct financing leases (auto leases)
|
$ 107,624
|
7%
|
-
|
0.00%
|
-
|
2,275
|
193
|
-
|
|
Residential mortgage
|
$ 94,682
|
6%
|
6,571
|
0.40%
|
-
|
3,360
|
-
|
(31)
|
|
Securities backed loans and other
|
$ 200,715
|
12%
|
633
|
0.04%
|
-
|
367
|
8
|
(668)
|
|
Total
|
$ 1,636,253
|
100%
|
$ 14,228
|
0.87%
|
$ 3,379
|
$ 17,989
|
$ 3,028
|
$ (2,933)
|

Healthcare Affinity Relationships
• We are currently the 6th largest financial institution
in the Health Savings Account (HSA) space.(1)
in the Health Savings Account (HSA) space.(1)
• We service insurance carriers, third-party
administrators and large brokerage firms for
distribution of HSAs and related accounts.
administrators and large brokerage firms for
distribution of HSAs and related accounts.
• Dynamics of the healthcare insurance industry are
generating rapid growth in the HSA market:
generating rapid growth in the HSA market:
§ Between January 2008 and January 2009,
there was a 46% increase in the number of
HSAs nationally.(2)
there was a 46% increase in the number of
HSAs nationally.(2)
§ During that same period, HSA custodians and
administrators reported that assets grew by
62.6%.(2)
administrators reported that assets grew by
62.6%.(2)
§ Since 2003, the number of Americans with
HSAs and High-Deductible Health Plans
(HDHPs) has grown to over 8 million, from a
base of 3 million.(3)
HSAs and High-Deductible Health Plans
(HDHPs) has grown to over 8 million, from a
base of 3 million.(3)
§ Growth trends are expected to continue,
reaching 11-13 million accounts and assets of
$35 to $45 billion.(3)
reaching 11-13 million accounts and assets of
$35 to $45 billion.(3)
Prepaid Card Affinity Relationships
• We are a market leader in a rapidly growing market
for open loop prepaid debit cards:
for open loop prepaid debit cards:
§ 5th largest prepaid commercial debit card
issuer(4)
issuer(4)
§ 21st largest overall commercial card issuer(4)
• The aggregate size of the market is forecasted to
grow at 35% annual rate.
grow at 35% annual rate.
§ Open loop products forecasted to grow to
$125 billion in 2011, compared to $39 billion
in 2007(5)
$125 billion in 2011, compared to $39 billion
in 2007(5)
• We are the industry’s largest Agent Bank gift card
issuer.
issuer.
• We serve clients such as Western Union, Intuit,
Deluxe Check Printers, Higher One, Digital, Incomm
and Univision.
Deluxe Check Printers, Higher One, Digital, Incomm
and Univision.
Deposit-Generating Strategies: Grow Market Share in Expanding Markets
18
(1) According to the publication “Inside Consumer Directed Health Care,” March 2010
(2) Celent, “HSA Benchmarking Analysis: Market Trends and Economics 2009,” March 2009
(3) AHIP’s Center for Policy and Research, January 2009 census HSA/High-Deductible Health Plans
(4) Nilson Report, June 2009
(5) Mercator Advisory Group

Wealth Management Affinity Relationships
Wealth management provides deposit and lending
services to wealth management platforms and firms -
including limited-purpose trust companies,
broker/dealers and TPAs/record keepers:
services to wealth management platforms and firms -
including limited-purpose trust companies,
broker/dealers and TPAs/record keepers:
Wealth Management Bank Affinities:
• Currently 16 relationships representing approximately
$200 billion in assets under management
$200 billion in assets under management
• Over 7,000 investment advisors serving more than
280,000 clients
280,000 clients
• SEI, Legg Mason, Commonfund
Master Demand Account (MDA) - DTC/NSCC-traded
ERISA-qualified bank deposit account:
ERISA-qualified bank deposit account:
• Trades on the DTC/NSCC like Money Market Mutual
Funds
Funds
• FDIC insurance passed through to 401(k) participant
• Schwab, Matrix, SunGard, Ascensus, Great-West
• Growth potential due to growing demographics of
retirement market
retirement market
Safe Harbor IRA Rollovers:
• WMSI
Merchant Processing Relationships
• Top 20 Acquiring Bank for credit and debit card
processing
processing
• Top 50 Originating Bank for ACH processing
• Combined annual processing volume of $25 billion
• Numerous third-party channels, including: Fiserv,
FIS, TSYS, BankServ, Heartland, Planet Payment
and Health Equity
FIS, TSYS, BankServ, Heartland, Planet Payment
and Health Equity
Deposit-Gathering Strategies: Grow Market Share in Expanding Markets
19

Well-Positioned in Attractive, Stable Markets
• Commercial lending is substantially all in greater Philadelphia/Wilmington metropolitan area
§ Consists of the 12 counties surrounding Philadelphia and Wilmington, including Philadelphia, Delaware,
Chester, Montgomery, Bucks and Lehigh Counties in Pennsylvania; New Castle County in Delaware; and
Mercer, Burlington, Camden, Ocean and Cape May Counties in New Jersey.
Chester, Montgomery, Bucks and Lehigh Counties in Pennsylvania; New Castle County in Delaware; and
Mercer, Burlington, Camden, Ocean and Cape May Counties in New Jersey.
• Philadelphia/Wilmington and the surrounding markets encompass a large population, stable
economic activity and attractive demographics.
economic activity and attractive demographics.
• Throughout the current down cycle and in prior cycles, the Philadelphia region has exhibited
significant stability, which is reflected in a lesser reduction in housing prices and negative equity
compared to the rest of the nation, as shown below.
significant stability, which is reflected in a lesser reduction in housing prices and negative equity
compared to the rest of the nation, as shown below.
20
|
|
Home Prices Q3-2007 to Q3-2010
|
Home Prices Q3-2009 to Q3-2010
|
|
United States
|
-24.7%
|
-1.5%
|
|
Philadelphia, PA
|
-8.4%
|
-1.0%
|
|
2nd Quarter 2010
|
US
|
NJ
|
DE
|
PA
|
|
% of Homes with
Negative Equity |
23.0%
|
15.4%
|
13.5%
|
7.3%
|

NASDAQ: TBBK
www.thebancorp.com