Attached files
| file | filename |
|---|---|
| 8-K - WESTFIELD FINANCIAL, INC. 8-K - Western New England Bancorp, Inc. | a6713321.htm |
Exhibit 99.1

Westfield Financial Inc. NASDAQ: WFD Stifel Nicolaus Investor Round Table Meeting May 6, 2011 1
FORWARD – LOOKING STATEMENTS Today’s presentation may contain “forward-looking statements” which may be identified by the use of such words as “believe,” “expect,” “anticipate,” “should,” “planned,” “estimated,” and “potential.” Examples of forward-looking statements include, but are not limited to, estimates with respect to our financial condition and results of operation and business that are subject to various factors which could cause actual results to differ materially from these estimates. These factors include, but are not limited to: general and local economic conditions; changes in interest rates, deposit flows, demand for mortgages and other loans, real estate values, and competition; changes in accounting principles, policies, or guidelines; changes in legislation or regulation; and other economic, competitive, governmental, regulatory, and technological factors affecting our operations, pricing, products, and services. Any or all of our forward-looking statements in today’s presentation or in any other public statements we make may turn out to be wrong. They can be affected by inaccurate assumptions we might make or known or unknown risks and uncertainties. Consequently, no forward-looking statements can be guaranteed. We disclaim any obligation to subsequently revise any forward-looking statements to reflect events or circumstances after the date of such statements, or to reflect the occurrence of anticipated or unanticipated events 2
OVERVIEW •Headquartered in Westfield, MA •11 branches offices located throughout Hampden County •Preferred SBA Lender •Did not participate in TARP 3

STRATEGY •Main focus on Commercial & Industrial and Commercial Real Estate portfolios by targeting businesses in Western Massachusetts and Northern Connecticut. •C & I relationships include transactional deposit account relationships. •Growth in residential real estate portfolio to diversify risk and deepen customer relationships. •Maintain arrangement with a third-party mortgage company which underwrites and services residential loans, thereby reducing overhead cost for Westfield Bank. 4
HIGHLIGHTS •Very well capitalized. Stockholders’ equity/total asset ratio of 17.70% •High credit quality. Nonperforming loans of 0.75% •Deposits increased by $46.2 million, or 7% for the twelve months ended March 31, 2011. •Total loans increased by 13%, with residential mortgages increasing by $71.4 million for the twelve months ended March 31, 2011. 5
HIGHLIGHTS •Hired new head of Branch Administration/Retail Banking in January 2010. •25 years experience in commercial bank environment •Developed business development skills of Branch Managers: •Business Banking Calling Programs •Introduced Bank @ Work program •Enhanced the bank-at-college program •Redefined product set: relationship-based, tailored to customers’ stage in life 6
ELECTRONIC BANKING •Enhanced electronic banking capabilities including mobile banking and financial management tools. •Added billing and invoice, payroll and online merchant service processing options for small businesses. •Expanded ATM network with 5 new machines, 3 of which are on a university campus. 7
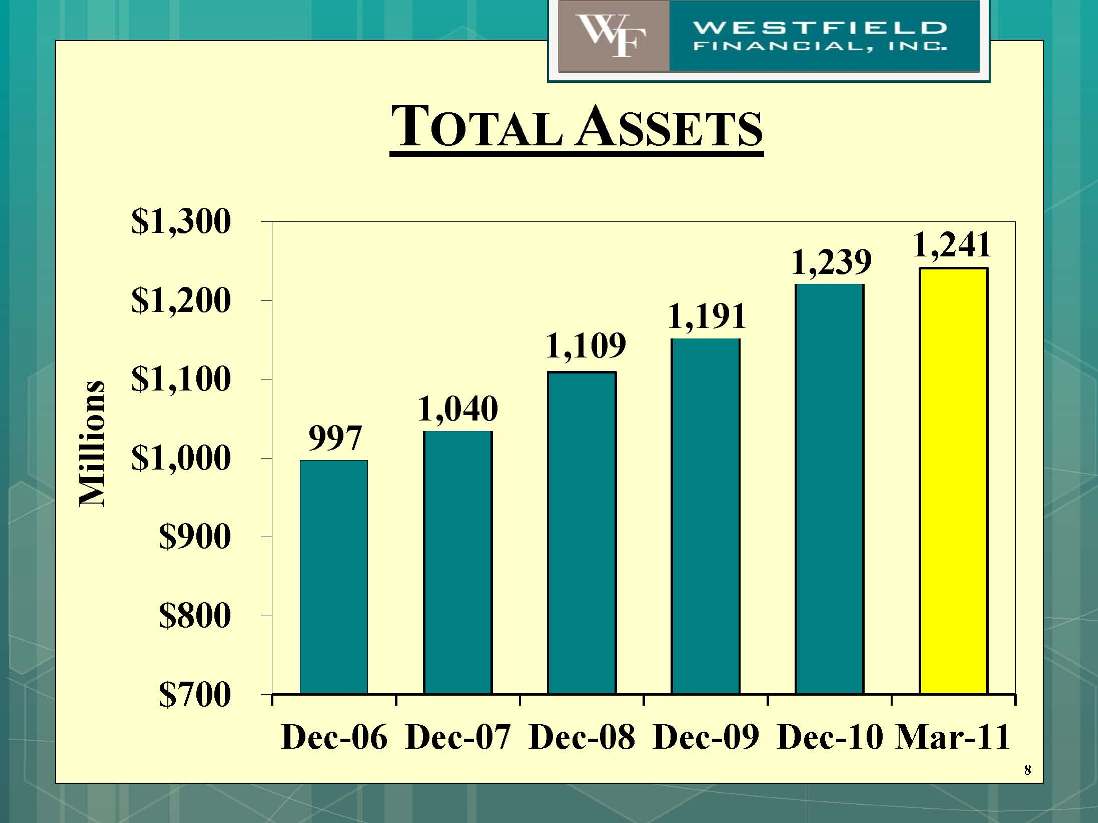
TOTAL ASSETS 997 1,040 1,109 1,191 1,239 1,241 $700 $800 $900 $1,000 $1,100 $1,200 $1,300 Dec-06 Dec-07 Dec-08 Dec-09 Dec-10 Mar-11 Millions 8
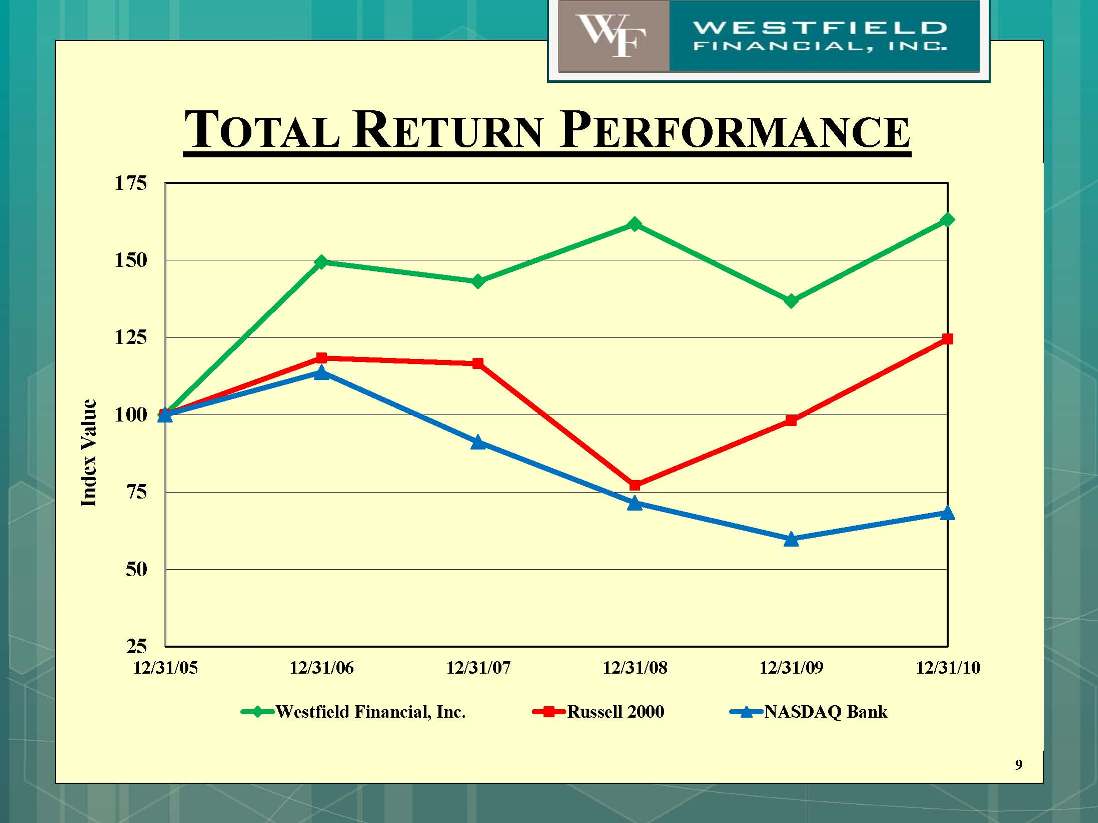
TOTAL RETURN PERFORMANCE 9 25507510012515017512/31/0512/31/0612/31/0712/31/0812/31/0912/31/10Index Value Westfield Financial, Inc.Russell 2000NASDAQ Bank
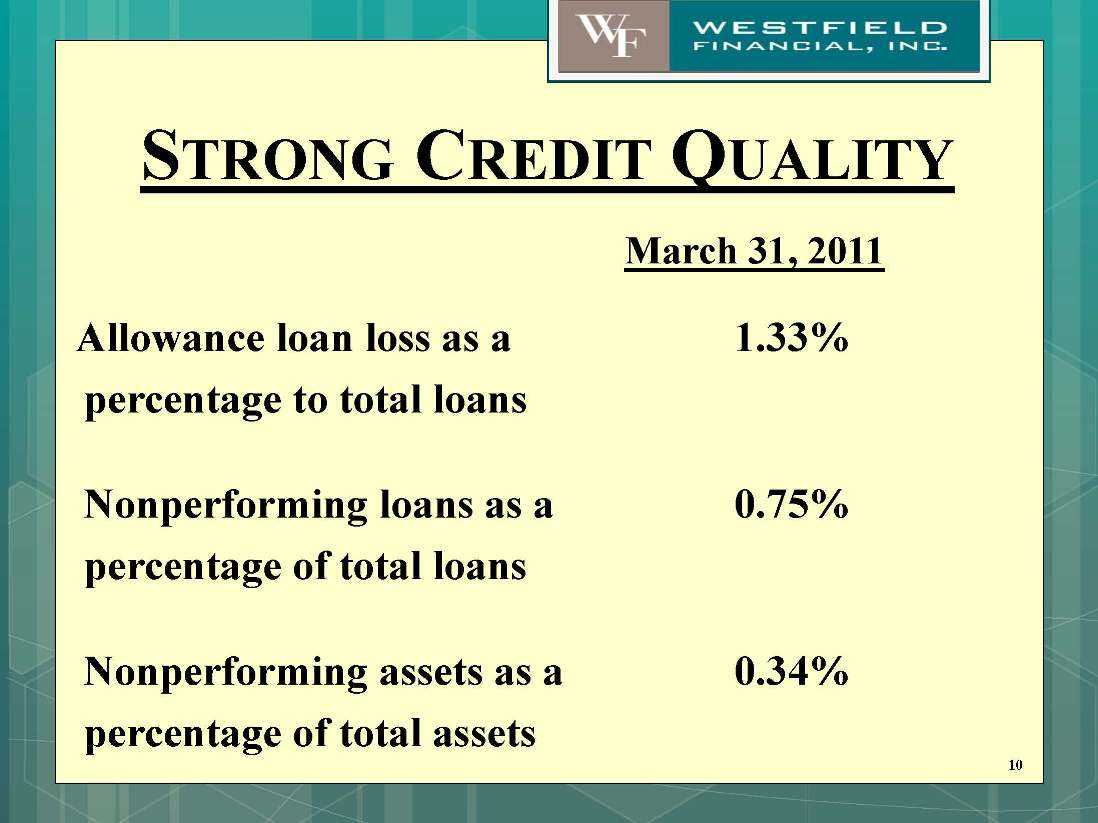
STRONG CREDIT QUALITY March 31, 2011 Allowance loan loss as a 1.33% percentage to total loans Nonperforming loans as a 0.75% percentage of total loans Nonperforming assets as a 0.34% percentage of total assets 10
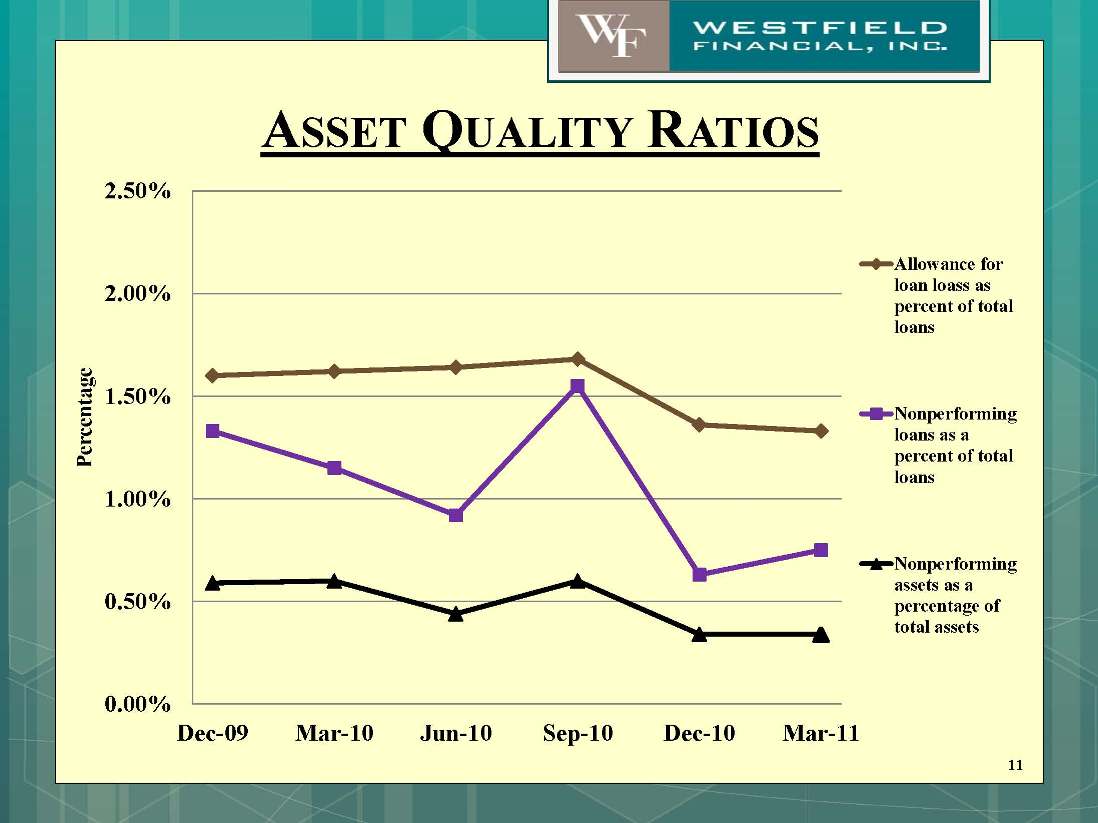
ASSET QUALITY RATIOS 0.00%0.50%1.00%1.50%2.00%2.50%Dec-09Mar-10Jun-10Sep-10Dec-10Mar-11Percentage Allowance forloan loass aspercent of totalloansNonperformingloans as apercent of totalloansNonperformingassets as apercentage oftotal assets11
NONPERFORMING & DELINQUENT LOANS •Nonperforming loans of $3.9 million or 0.75% of total loans •Primarily made up of 4 borrowers totaling $3.2 million •Loans delinquent 30-89 days totaling $20.6 million •Primarily made up of one borrower totaling $15.0 million 12
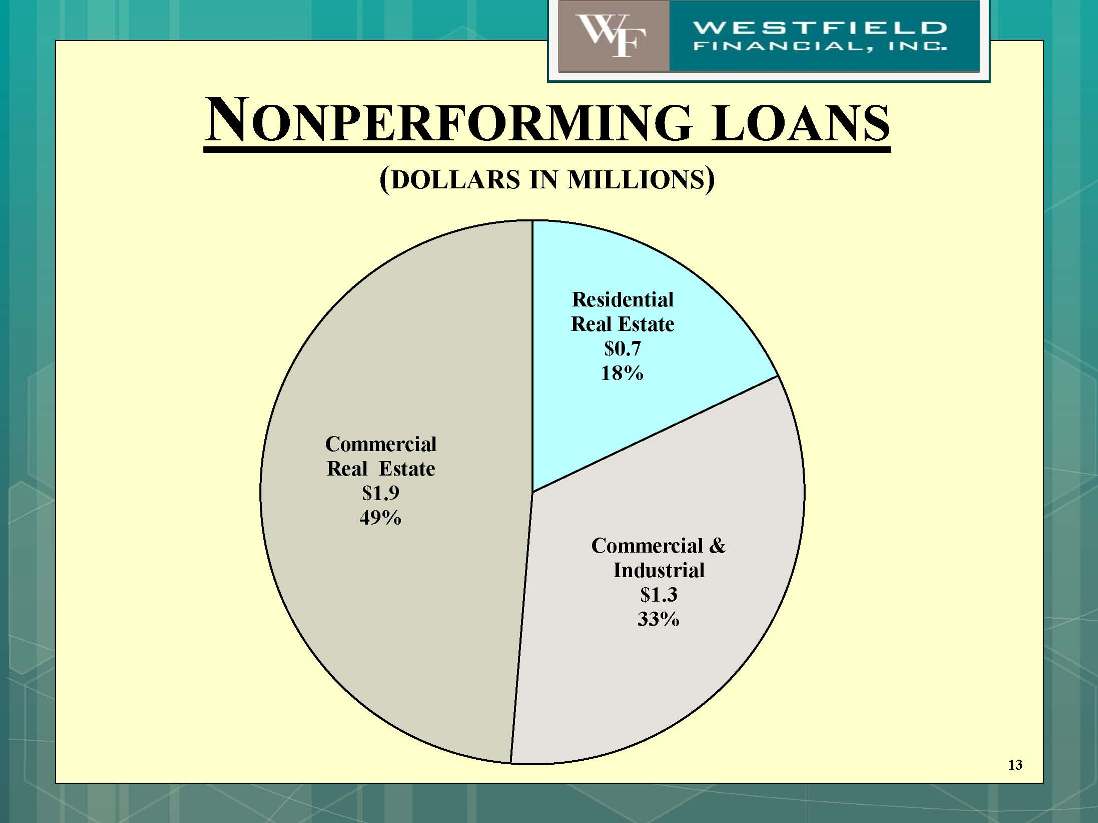
NONPERFORMING LOANS (DOLLARS IN MILLIONS) Residential Real Estate $0.7 18% Commercial & Industrial $1.3 33% Commercial Real Estate $1.9 49% 13
CAPITAL MANAGEMENT Possible uses of capital: • Pay dividends to shareholders • Repurchase shares of our common stock •Fund organic growth or leverage the balance sheet •Finance acquisitions of other financial institutions or other businesses related to banking 14
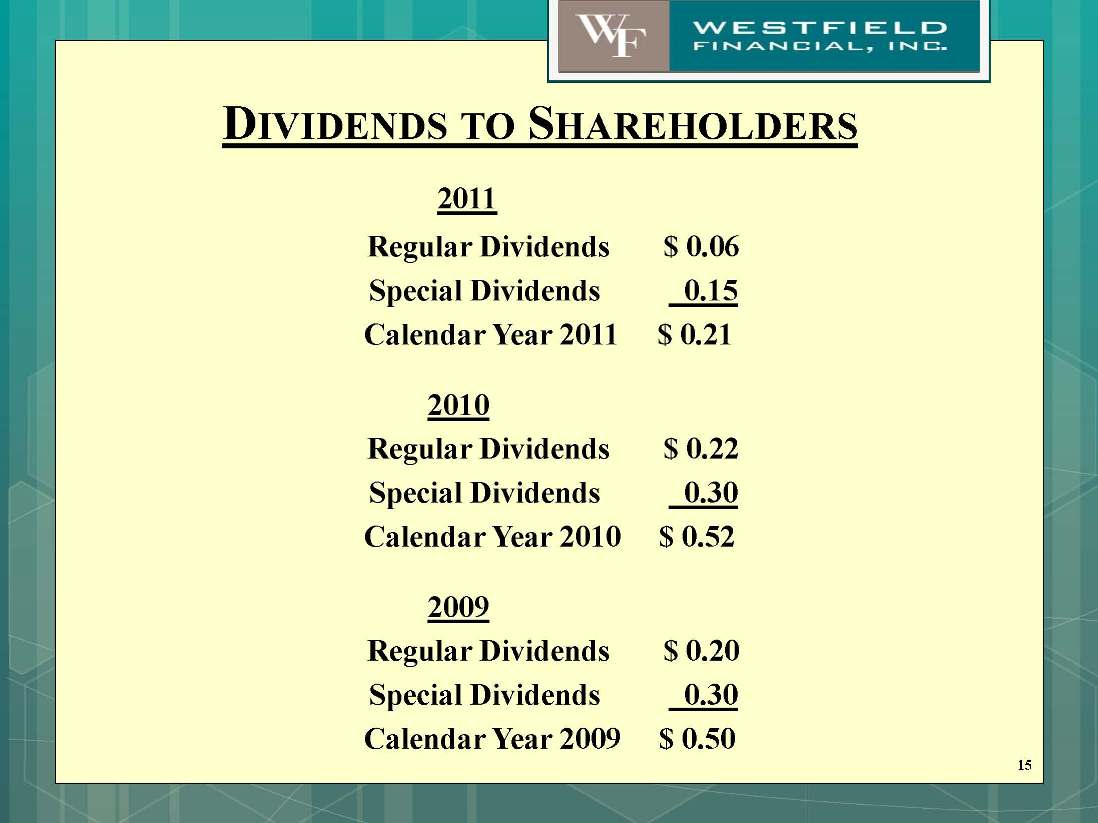
DIVIDENDS TO SHAREHOLDERS 2011 Regular Dividends $ 0.06 Special Dividends 0.15 Calendar Year 2011 $ 0.21 2010 Regular Dividends $ 0.22 Special Dividends 0.30 Calendar Year 2010 $ 0.52 2009 Regular Dividends $ 0.20 Special Dividends 0.30 Calendar Year 2009 $ 0.50 15
STOCK REPURCHASE PLAN On May 25, 2010 the Board of Directors authorized a second repurchase for up to 2.9 million shares (10% of our outstanding shares). There were 1.5 million shares purchased under this plan as of March 31, 2011. 16
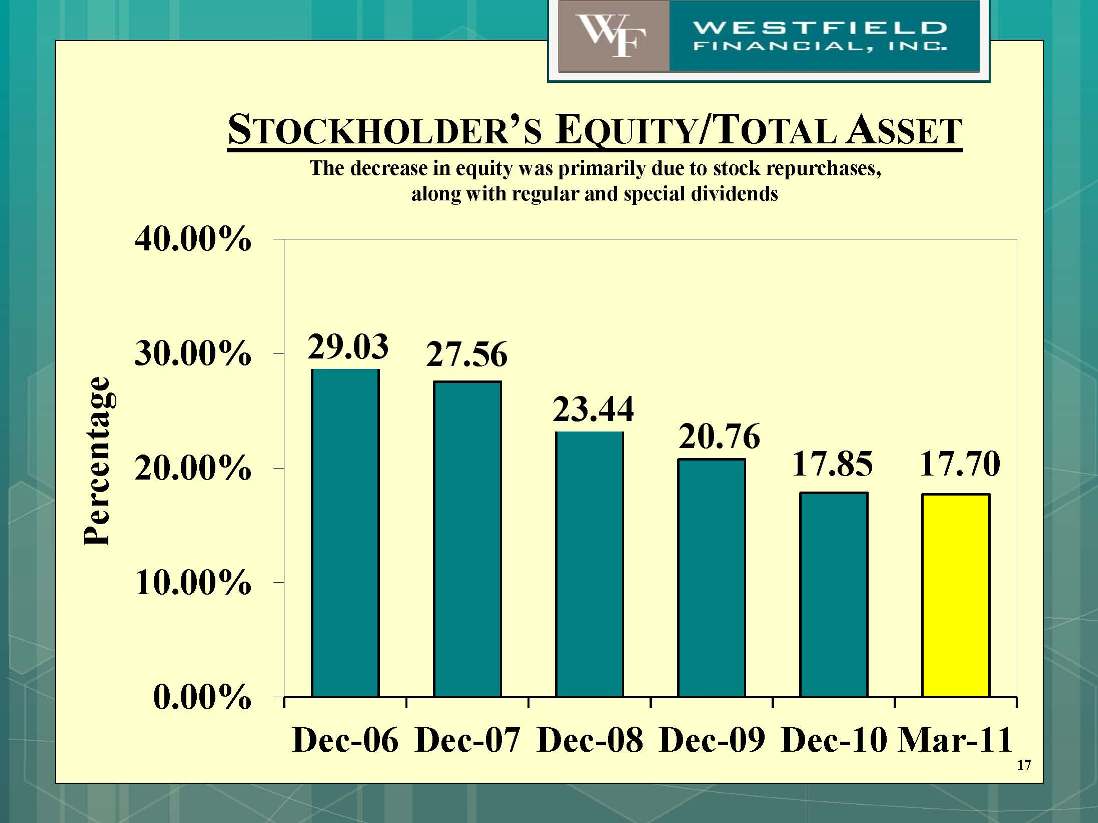
STOCKHOLDER’S EQUITY/TOTAL ASSET The decrease in equity was primarily due to stock repurchases, along with regular and special dividends 29.03 27.56 23.44 20.76 17.85 17.70 0.00%10.00%20.00%30.00%40.00%Dec-06Dec-07Dec-08Dec-09Dec-10Mar-11Percentage 17
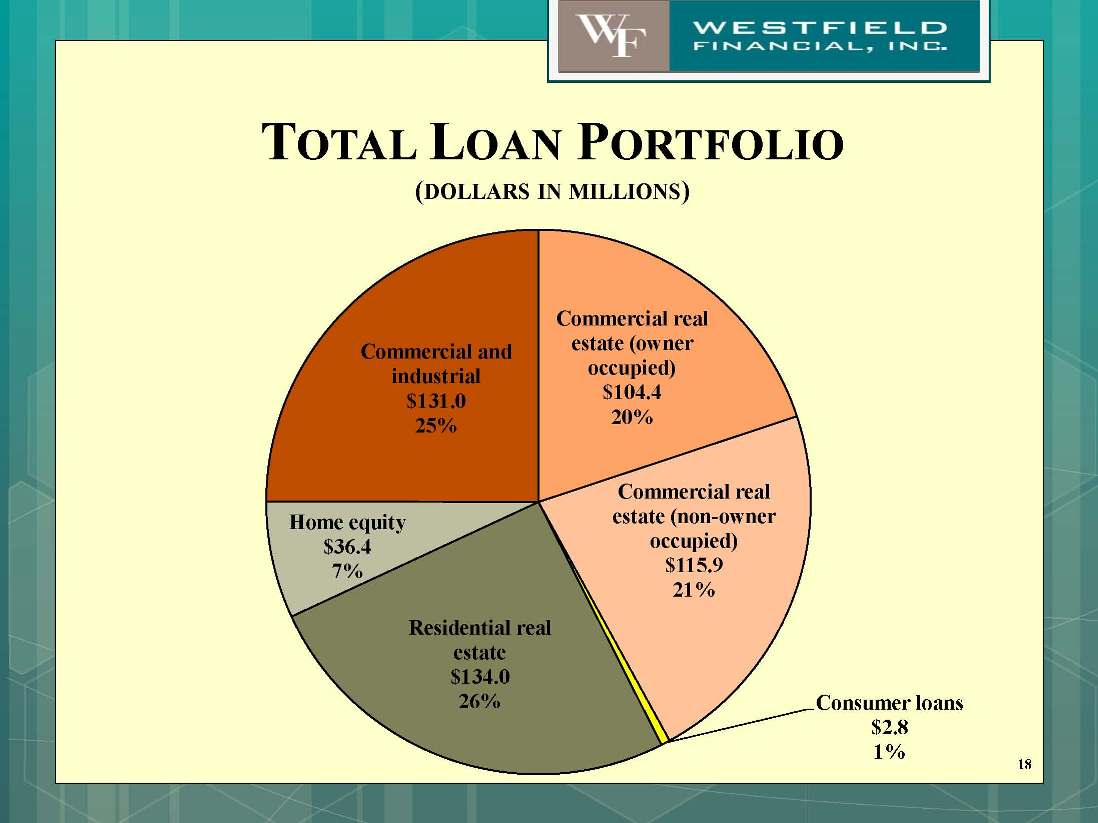
TOTAL LOAN PORTFOLIO (DOLLARS IN MILLIONS) Commercial real estate (owner occupied) $104.4 20% Commercial real estate (non-owner occupied) $115.9 21% Consumer loans $2.8 1% Residential real estate $134.0 26% Home equity $36.4 7% Commercial and industrial $131.0 25% 18
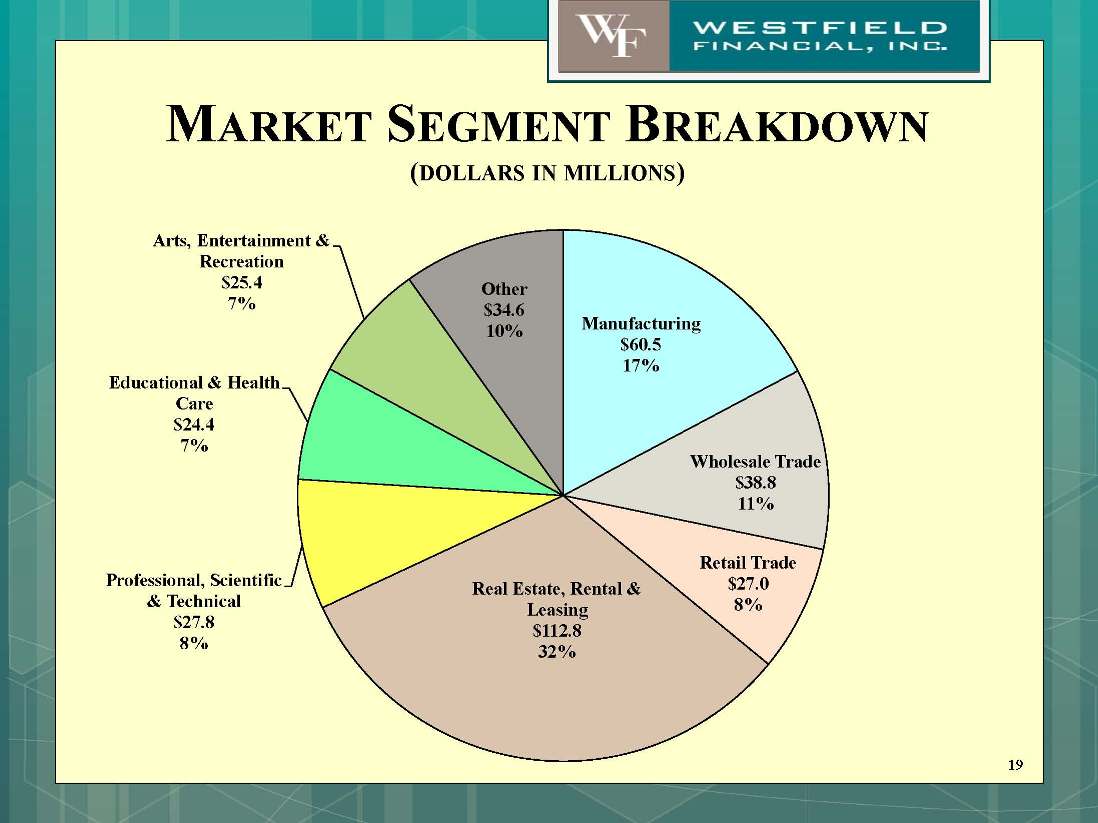
MARKET SEGMENT BREAKDOWN (DOLLARS IN MILLIONS) 19 Manufacturing $60.5 17% Wholesale Trade $38.8 11% Retail Trade $27.0 8% Real Estate, Rental & Leasing $112.8 32% Professional, Scientific & Technical $27.8 8% Educational & Health Care $24.4 7% Arts, Entertainment & Recreation $25.4 7% Other $34.6 10%
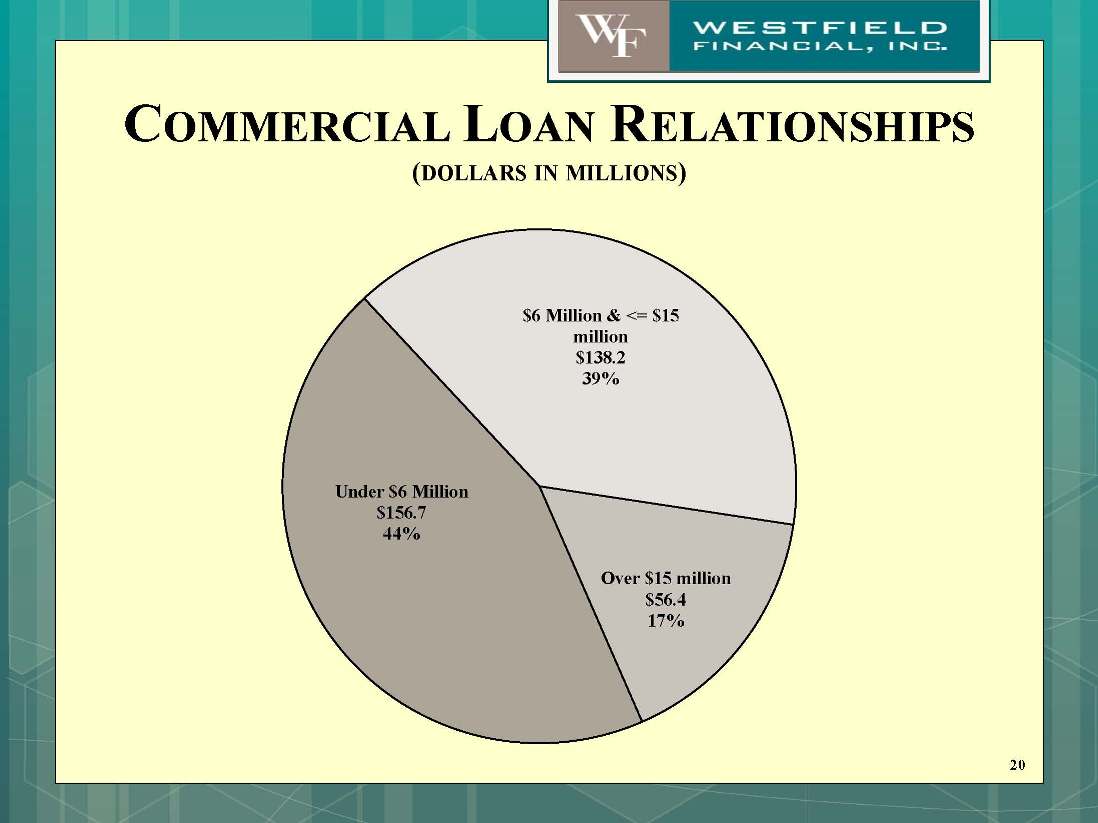
COMMERCIAL LOAN RELATIONSHIPS (DOLLARS IN MILLIONS) $6 Million & <= $15 million $138.2 39% Over $15 million $56.4 17% Under $6 Million $156.7 44% 20
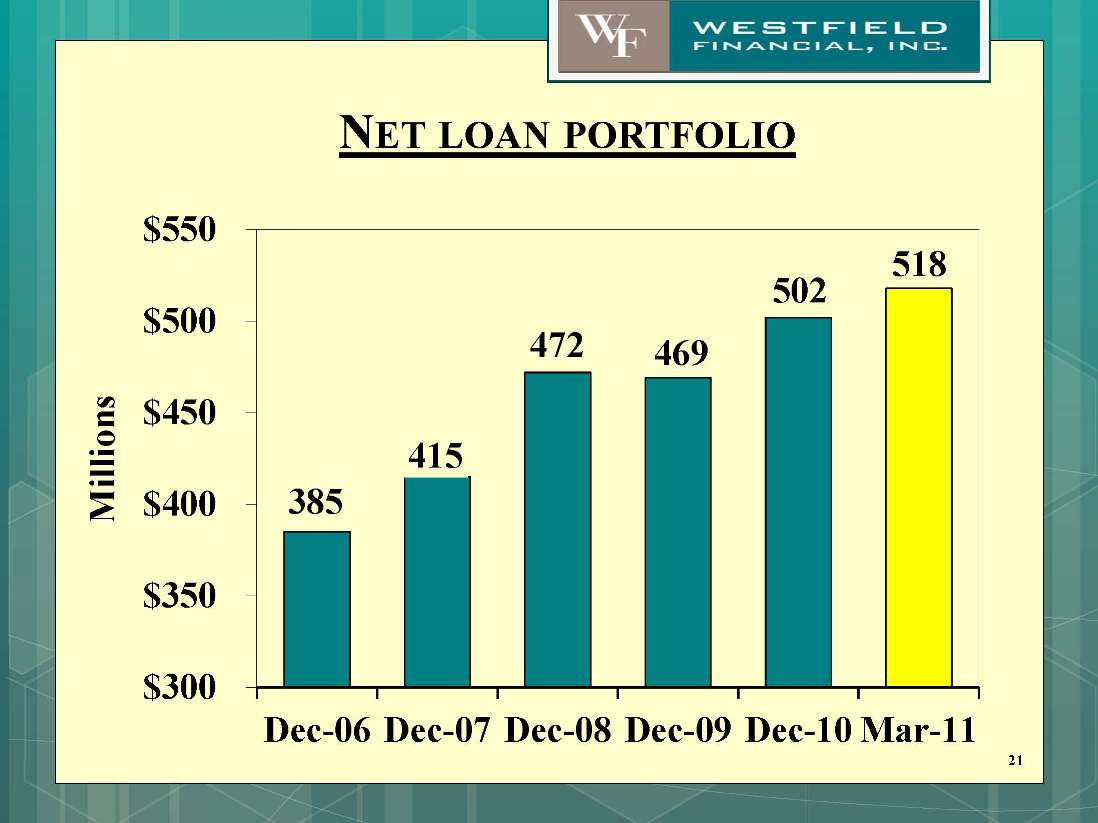
NET LOAN PORTFOLIO 385 415 472 469 502 518 $300$350$400$450$500$550Dec-06Dec-07Dec-08Dec-09Dec-10Mar-11Millions 21
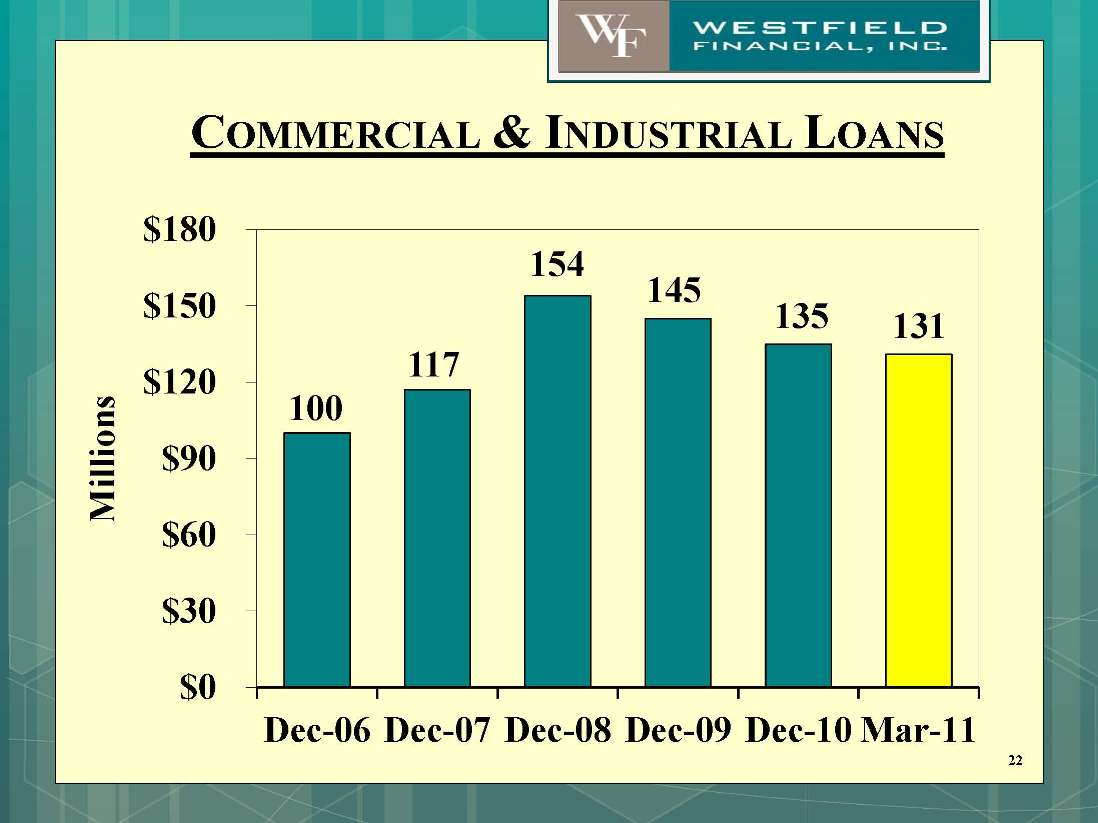
COMMERCIAL & INDUSTRIAL LOANS 100 117 154 145 135 131 $0 $30 $60 $90 $120 $150 $180 Dec-06 Dec-07 Dec-08 Dec-09 Dec-10 Mar-11 Millions 22
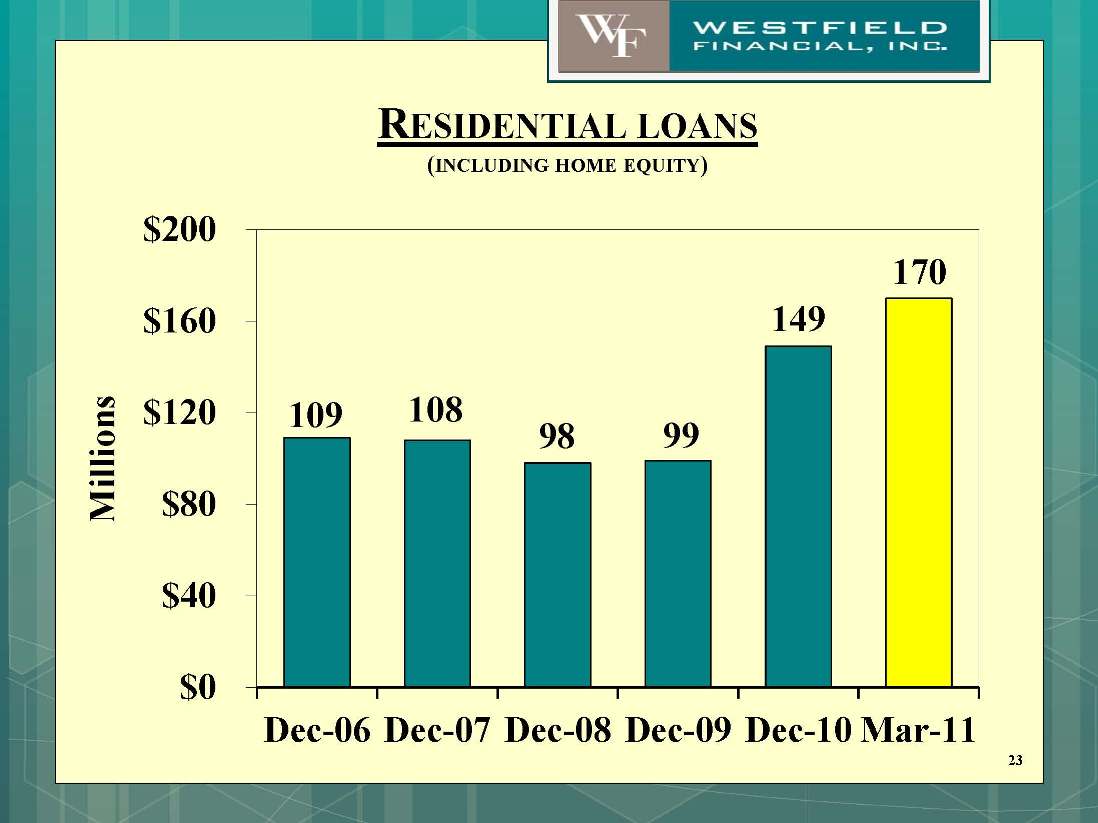
RESIDENTIAL LOANS (INCLUDING HOME EQUITY) 109 108 98 99 149 170 $0 $40 $80 $120 $160 $200 Dec-06 Dec-07 Dec-08 Dec-09 Dec-10 Mar-11 Millions 23
RESIDENTIAL LOAN PROGRAM •We process substantially all of our originations of residential real estate loans through a third-party mortgage company. Residential real estate borrowers submit applications to us, but the loan is approved by and closed on the books of the mortgage company. •In recent months, we have purchased loans from this third-party mortgage company as a means of diversifying the loan portfolio improving net interest income. •Nearly half of the loans we bought back in recent months were from applications originated by Westfield Bank. The remainder was originated by the mortgage company’s originators in western Massachusetts and northern Connecticut. 24
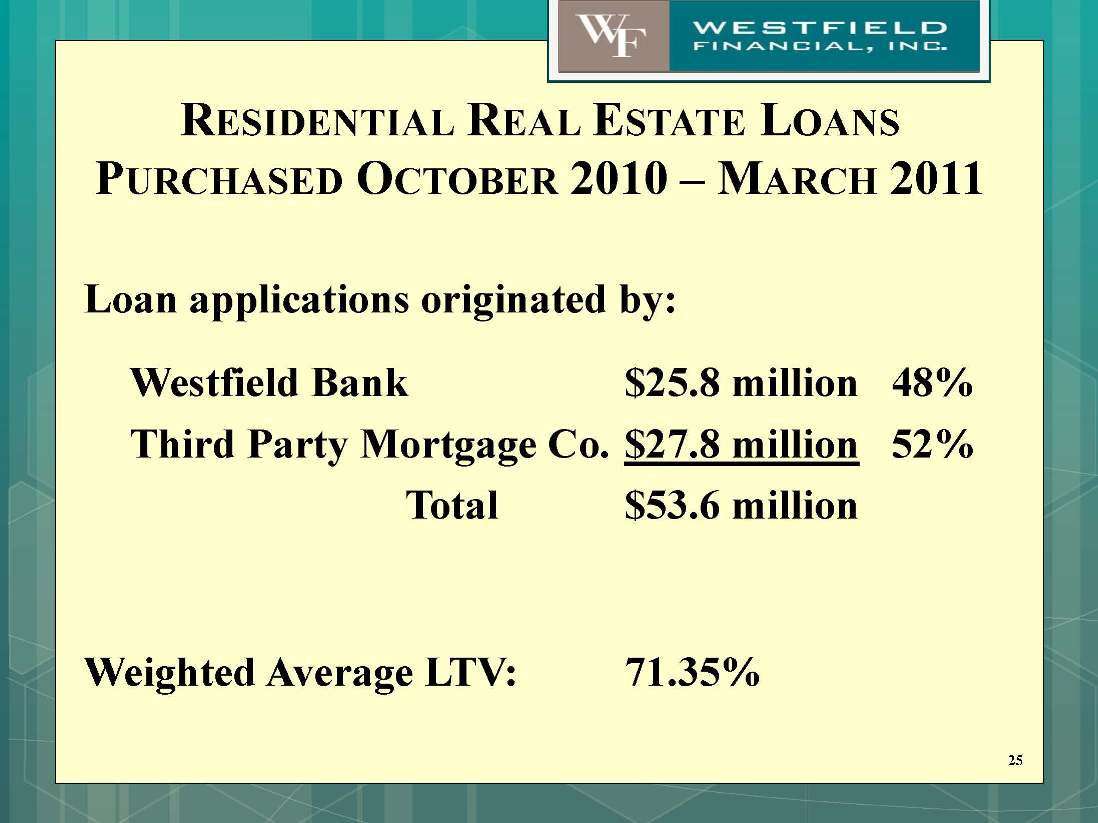
RESIDENTIAL REAL ESTATE LOANS PURCHASED OCTOBER 2010 – MARCH 2011 Loan applications originated by: Westfield Bank $25.8 million 48% Third Party Mortgage Co. $27.8 million 52% Total $53.6 million Weighted Average LTV: 71.35% 25
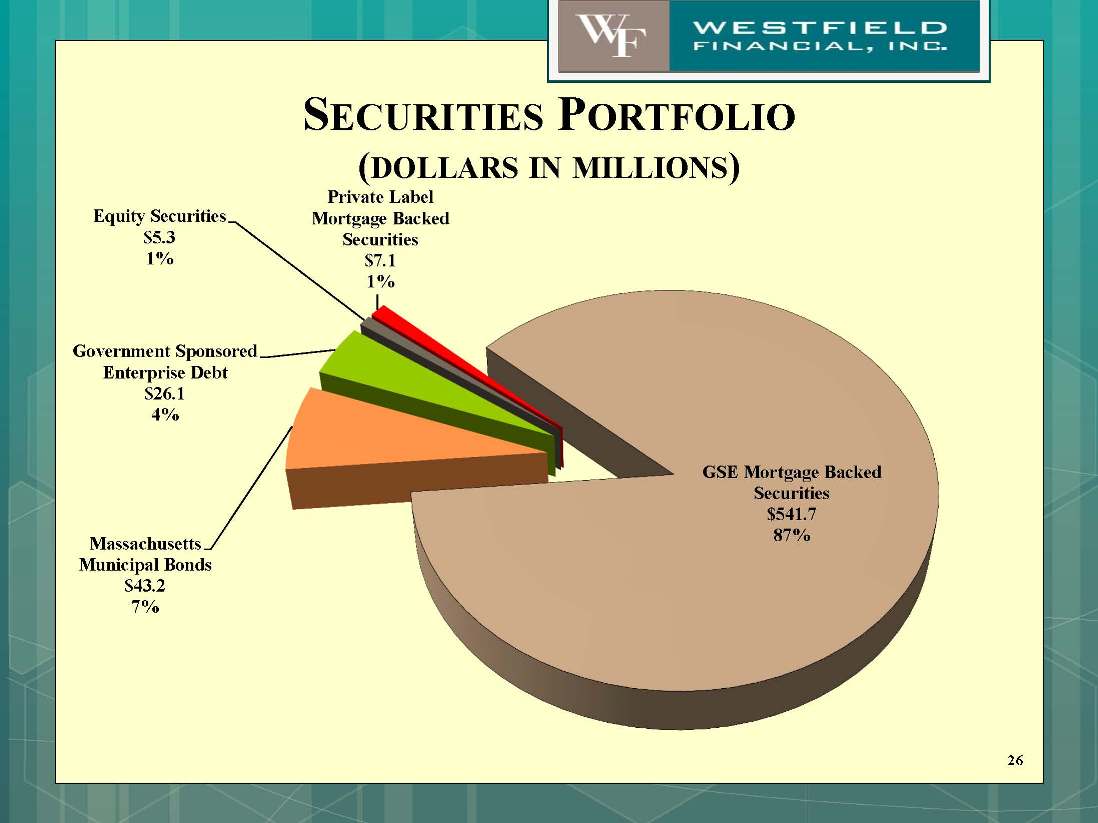
SECURITIES PORTFOLIO (DOLLARS IN MILLIONS) Government Sponsored Enterprise Debt $26.1 4% Equity Securities $5.3 1% Private Label Mortgage Backed Securities $7.1 1% GSE Mortgage Backed Securities $541.7 87% Massachusetts Municipal Bonds $43.2 7% 26
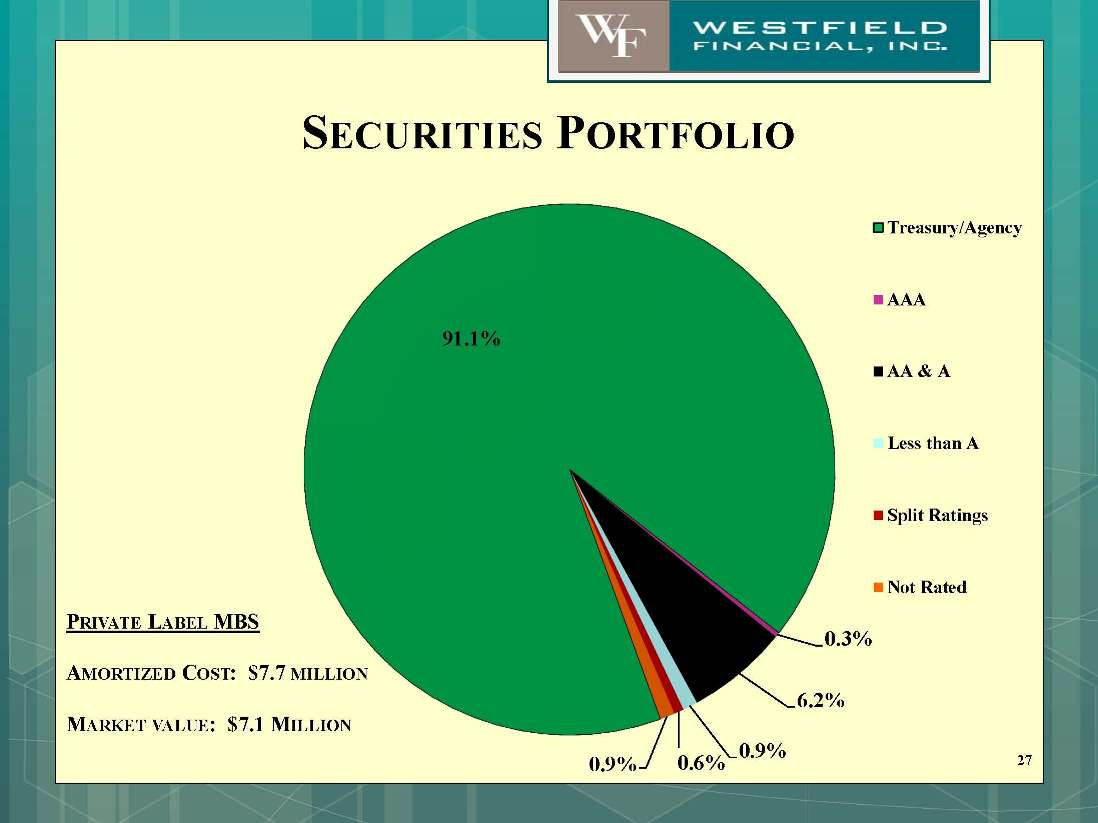
SECURITIES PORTFOLIO PRIVATE LABEL MBS AMORTIZED COST: $7.7 MILLION MARKET VALUE: $7.1 MILLION 27 91.1% 0.3% 6.2% 0.9% 0.6% 0.9% Treasury/Agency AAA AA & A Less than A Split Ratings Not Rated
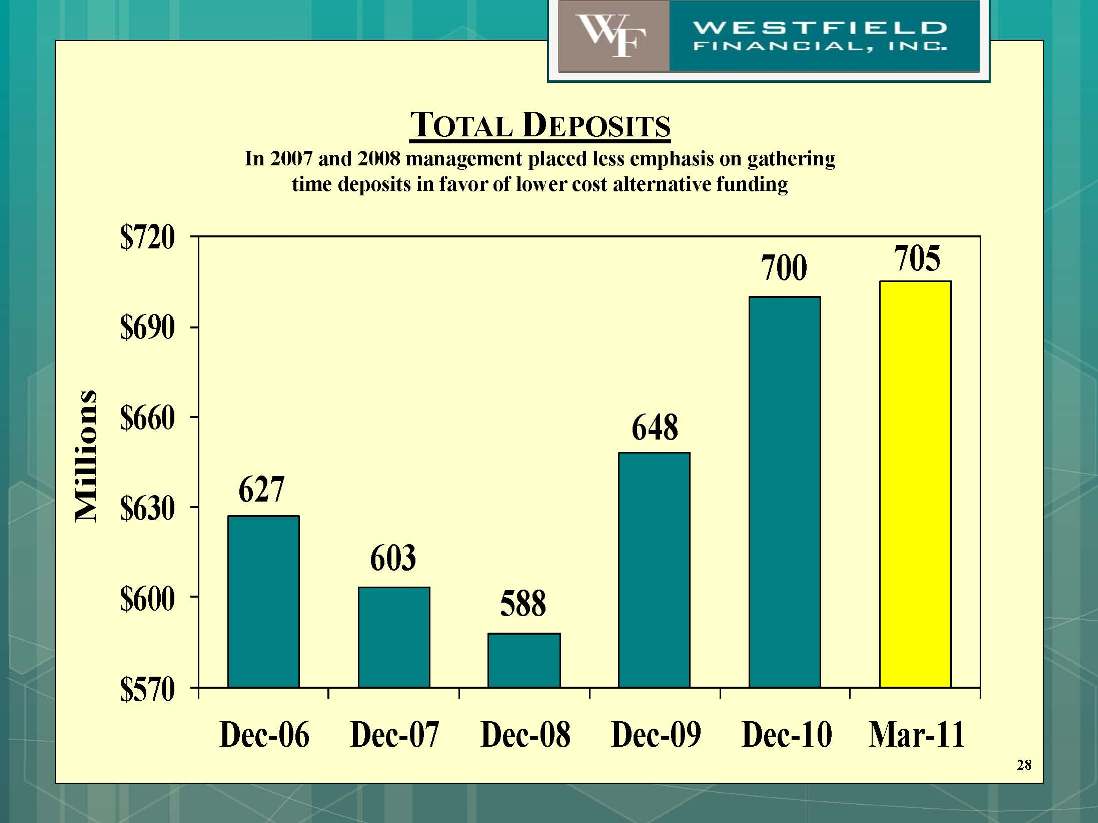
TOTAL DEPOSITS In 2007 and 2008 management placed less emphasis on gathering time deposits in favor of lower cost alternative funding 28
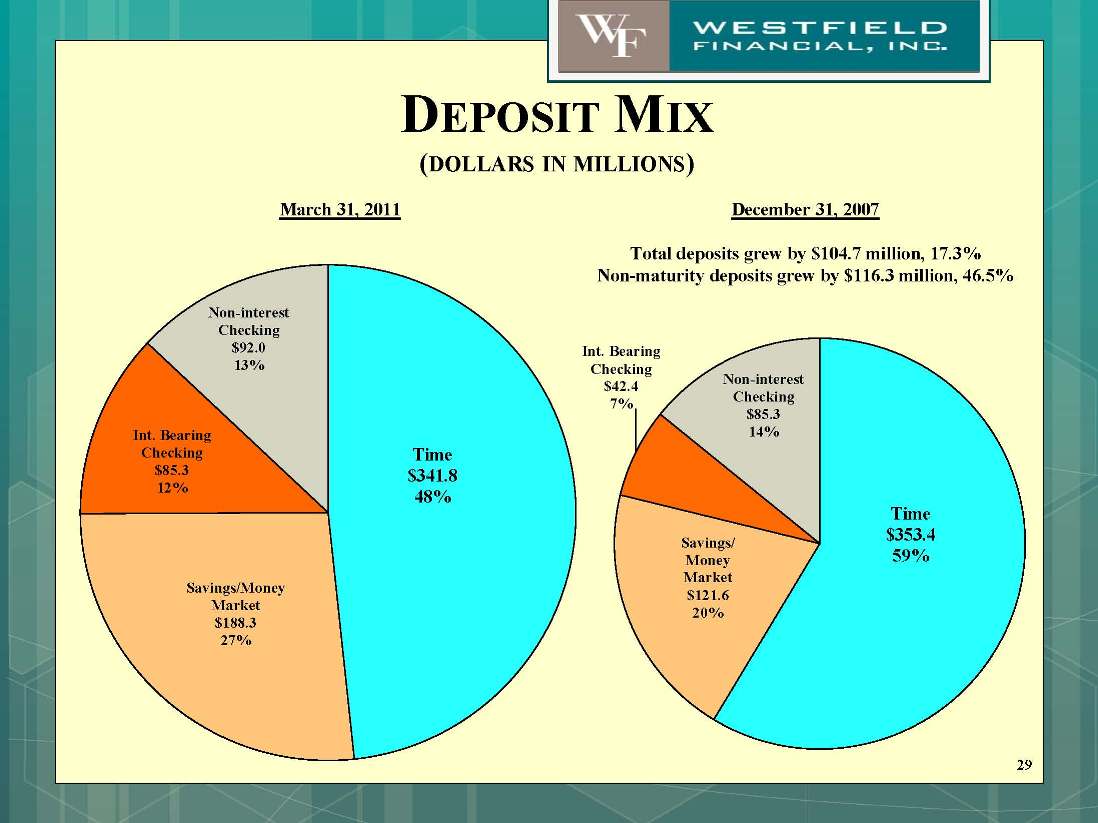
DEPOSIT MIX (DOLLARS IN MILLIONS) December 31, 2007 Total deposits grew by $104.7 million, 17.3% Non-maturity deposits grew by $116.3 million, 46.5% March 31, 2011 29 Time $353.4 59% Savings/ Money Market $121.6 20% Int. Bearing Checking $42.4 7% Non-interest Checking $85.3 14% Time $341.8 48% Savings/Money Market $188.3 27% Int. Bearing Checking $85.3 12% Non-interest Checking $92.0 13%
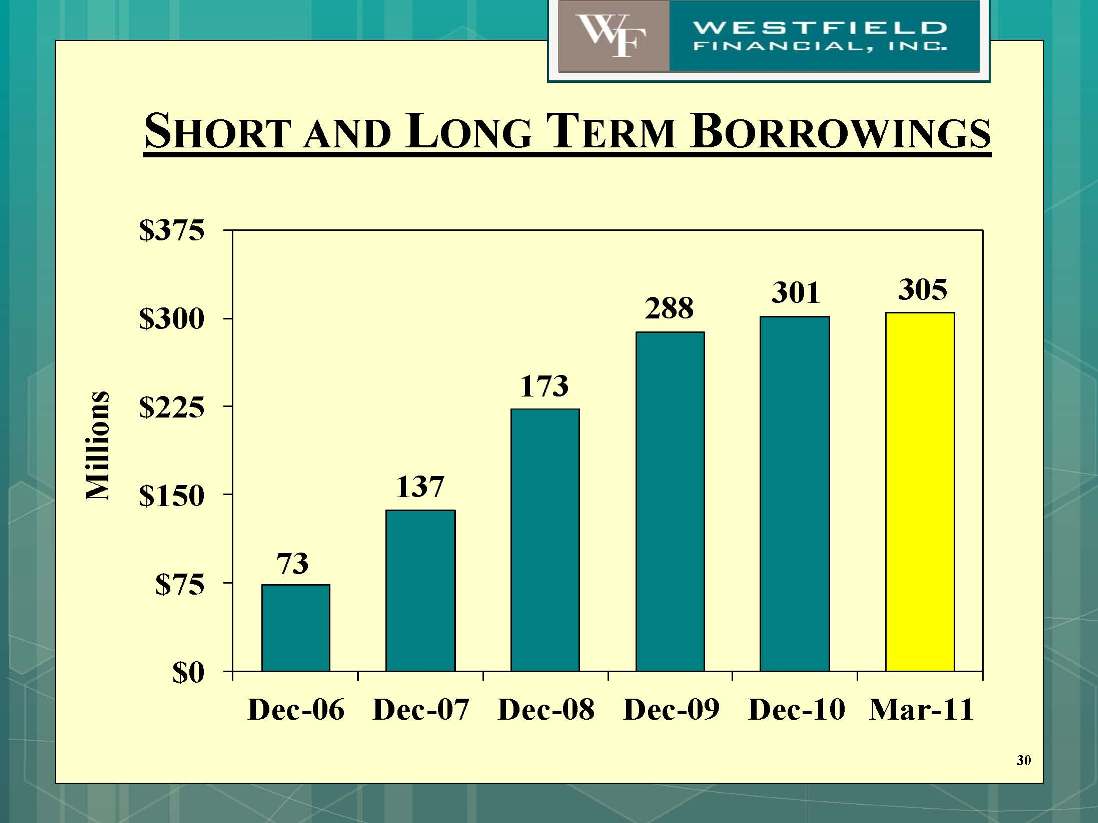
SHORT AND LONG TERM BORROWINGS 30
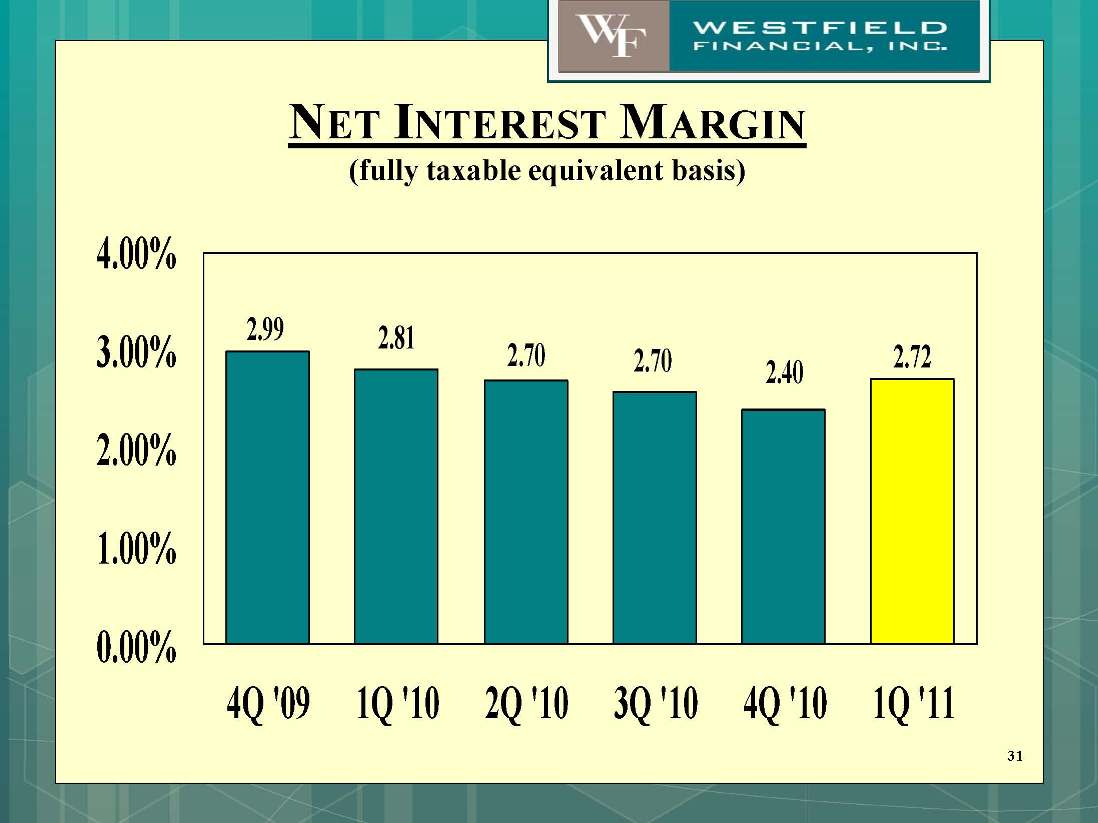
NET INTEREST MARGIN (fully taxable equivalent basis) 31
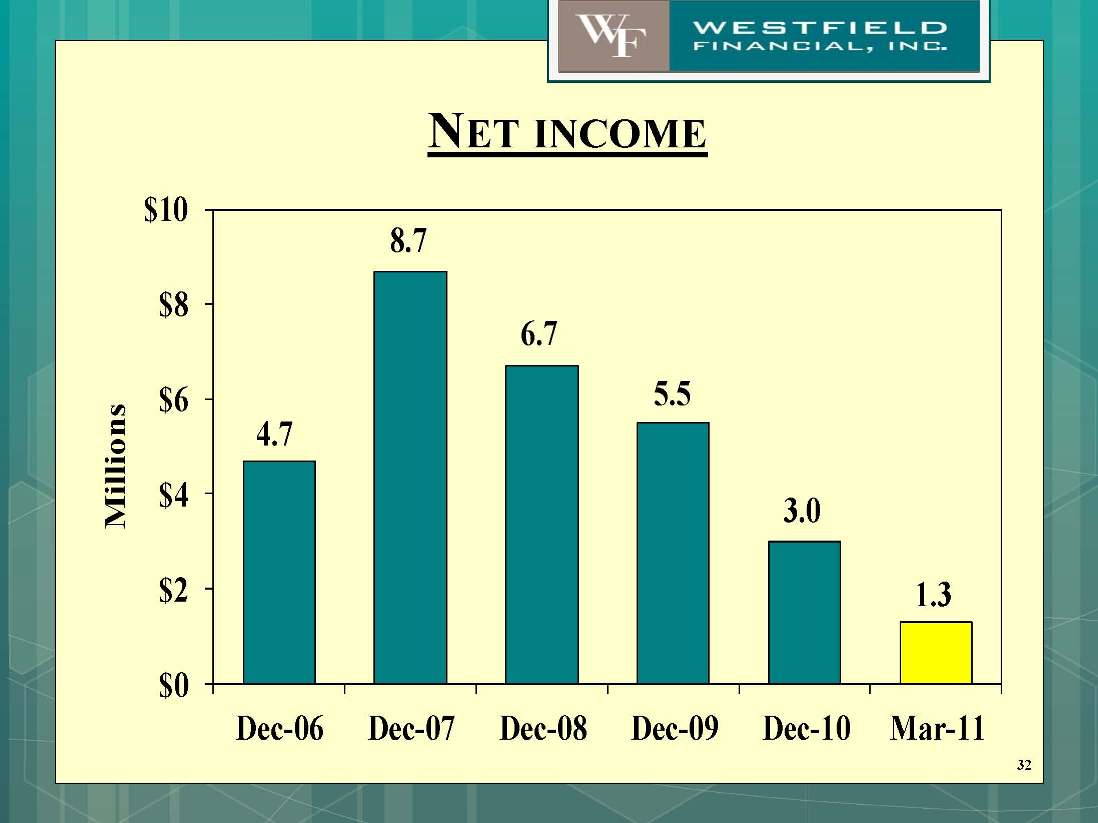
NET INCOME 32
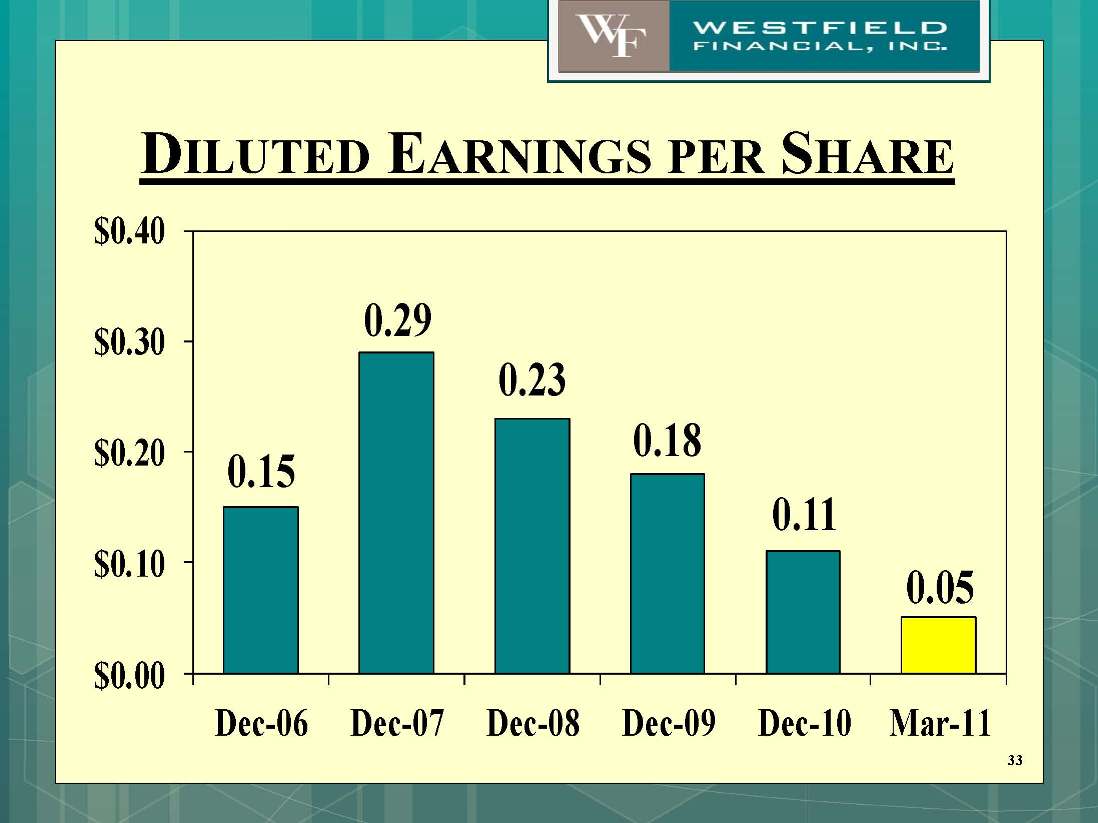
DILUTED EARNINGS PER SHARE 0.150.290.230.180.110.05$0.00$0.10$0.20$0.30$0.40Dec-06Dec-07Dec-08Dec-09Dec-10Mar-1133

Thank You 34