Attached files
Table of Contents
UNITED STATES
SECURITIES AND EXCHANGE COMMISSION
Washington, D.C. 20549
FORM 10-Q
(Mark One)
| x | Quarterly Report Pursuant to Section 13 or 15(d) of the Securities Exchange Act of 1934 |
For the Quarterly Period Ended March 31, 2011.
| ¨ | Transition Report Pursuant to Section 13 or 15(d) of the Securities Exchange Act of 1934 |
For the Transition Period From to .
Commission File No. 333-128166-10

Affinia Group Intermediate Holdings Inc.
(Exact name of registrant as specified in its charter)
| Delaware | 34-2022081 | |
| (State or Other Jurisdiction of Incorporation or Organization) |
(I.R.S. Employer Identification No.) |
| 1101 Technology Drive, Ann Arbor, Michigan | 48108 | |
| (Address of Principal Executive Offices) | (Zip Code) |
(734) 827-5400
(Registrant’s Telephone Number, Including Area Code)
N/A
(Former Name, Former Address and Former Fiscal Year, if Changed Since Last Report)
Indicate by check mark whether the registrant (1) has filed all reports required to be filed by Section 13 or 15(d) of the Securities Exchange Act of 1934 during the preceding 12 months (or for such shorter period that the registrant was required to file such reports), and (2) has been subject to such filing requirements for the past 90 days. Yes ¨ No x
(Note: Prior to the effectiveness of the registrant’s Registration Statement on Form S-4 (File No. 333-173593) on May 4, 2011, the registrant was a voluntary filer not subject to the filing requirements of Section 13 or 15(d) of the Exchange Act, as a voluntary filer the registrant filed all reports required to be filed by Section 13 or 15(d) of the Exchange Act during the preceding 12 months (or for such shorter period that the registrant would have been required to file such reports) as if it were subject to such filing requirements).
Indicate by check mark whether the registrant has submitted electronically and posted on its corporate Web site, if any, every Interactive Data File required to be submitted pursuant to Rule 405 of Regulation S-T (§232.405 of this chapter) during the preceding 12 months (or for such shorter period that the registrant was required to submit and post such files). Yes ¨ No ¨
Indicate by check mark whether the registrant is a large accelerated filer, an accelerated filer, a non-accelerated filer, or a smaller reporting company. See the definitions of “large accelerated filer,” “accelerated filer” and “smaller reporting company” in Rule 12b-2 of the Exchange Act.
| Large accelerated filer | ¨ | Accelerated filer | ¨ | |||
| Non-accelerated filer | x (Do not check if a smaller reporting company) | Smaller reporting company | ¨ |
Indicate by check mark whether the registrant is a shell company (as defined in Rule 12b-2 of the Exchange Act). Yes ¨ No x
There were 1,000 shares outstanding of the registrant’s common stock as of May 6, 2011 (all of which are privately owned and not traded on a public market).
Table of Contents
Affinia Group Intermediate Holdings Inc.
2
Table of Contents
CAUTIONARY NOTE REGARDING FORWARD-LOOKING STATEMENTS
This report includes “forward-looking statements” within the meaning of Section 27A of the Securities Act of 1933, as amended (the “Securities Act”) and Section 21E of the Securities Exchange Act of 1934, as amended (the “Exchange Act”). These forward-looking statements may include comments concerning our plans, objectives, goals, strategies, future events, future revenue or performance, capital expenditures, financing needs, plans or intentions relating to acquisitions, business trends and other information that is not historical. When used in this report, the words “anticipates,” “believes,” “estimates,” “expects,” “forecasts,” “intends,” “plans,” “projects,” or future or conditional verbs, such as “could” “may,” “should,” or “will,” and variations of such words or similar expressions are intended to identify forward-looking statements. All forward-looking statements, including, without limitation, management’s examination of historical operating trends and data are based upon our current expectations and various assumptions. Our expectations, beliefs and projections are expressed in good faith and we believe there is a reasonable basis for them. However, there is no assurance that these expectations, beliefs and projections will be achieved. For a discussion of other risks and uncertainties that could materially affect our business financial condition or future results see Part I, “Item 1A. Risk Factors” in our Annual Report on form 10-K for the year ended December 31, 2010. With respect to all forward-looking statements, we claim the protection of the safe harbor for forward-looking statements contained in the Private Securities Litigation Reform Act of 1995.
There are a number of risks and uncertainties that could cause our actual results to differ materially from the forward-looking statements contained in this report. Such risks, uncertainties and other important factors include, among others, continued volatility in and disruption to the global economy and the resulting impact on the availability and cost of credit; financial viability of key customers and key suppliers; our dependence on our largest customers; increased crude oil and gasoline prices and resulting reductions in global demand for the use of automobiles; the shift in demand from premium to economy products; pricing and pressures from imports; increasing costs for manufactured components; the expansion of return policies or the extension of payment terms; risks associated with our non-U.S. operations; risks related to our receivables factoring arrangements; product liability and warranty and recall claims; reduced inventory levels by our distributors resulting from consolidation and increased efficiency; environmental and automotive safety regulations; the availability of raw materials, manufactured components or equipment from our suppliers; challenges to our intellectual property portfolio; our ability to develop improved products; the introduction of improved products and services that extend replacement cycles otherwise reduce demand for our products; our ability to achieve cost savings from our restructuring plans; work stoppages, labor disputes or similar difficulties that could significantly disrupt our operations; our ability to successfully combine our operations with any businesses we have acquired or may acquire; risk of impairment charges to our long-lived assets; risk of impairment to intangibles and goodwill; the risk of business disruptions; risks associated with foreign exchange rate fluctuations; risks associated with our expansion into new markets; risks associated with increased levels of drug-related violence in Juarez, Mexico; the impact on our tax rate resulting from the mix of our profits and losses in various jurisdictions; reductions in the value of our deferred tax assets; difficulties in developing, maintaining or upgrading information technology systems; risks associated with doing business in corrupting environments; our substantial leverage and limitations on flexibility in operating our business contained in our debt agreements; business interruptions to our supply chain, manufacturing facilities or to our distribution channels related to earthquakes or other natural disasters. Additionally, there may be other factors that could cause our actual results to differ materially from the forward-looking statements.
3
Table of Contents
FINANCIAL INFORMATION
| Item 1. | Financial Statements |
Affinia Group Intermediate Holdings Inc.
Unaudited Condensed Consolidated Statements of Operations
| (Dollars in millions) |
Three Months Ended March 31, 2010 |
Three Months Ended March 31, 2011 |
||||||
| Net sales |
$ | 443 | $ | 505 | ||||
| Cost of sales |
(353 | ) | (412 | ) | ||||
| Gross profit |
90 | 93 | ||||||
| Selling, general and administrative expenses |
(67 | ) | (71 | ) | ||||
| Operating profit |
23 | 22 | ||||||
| Other income (loss), net |
1 | (1 | ) | |||||
| Interest expense |
(16 | ) | (17 | ) | ||||
| Income from continuing operations before income tax provision, equity in income and noncontrolling interest |
8 | 4 | ||||||
| Income tax provision |
(2 | ) | (1 | ) | ||||
| Equity in income, net of tax |
— | — | ||||||
| Net income from continuing operations |
6 | 3 | ||||||
| Income from discontinued operations, net of tax |
2 | — | ||||||
| Net income |
8 | 3 | ||||||
| Less: net income attributable to noncontrolling interest, net of tax |
2 | 1 | ||||||
| Net income attributable to the Company |
$ | 6 | $ | 2 | ||||
The accompanying notes are an integral part of the unaudited condensed consolidated financial statements.
4
Table of Contents
Affinia Group Intermediate Holdings Inc.
Unaudited Condensed Consolidated Balance Sheets
| (Dollars in millions) |
December 31, 2010 |
March 31, 2011 |
||||||
| Assets |
||||||||
| Current assets: |
||||||||
| Cash and cash equivalents |
$ | 55 | $ | 55 | ||||
| Restricted cash |
12 | 14 | ||||||
| Trade accounts receivable, less allowances of $2 million for 2010 and 2011 |
316 | 345 | ||||||
| Inventories, net |
520 | 560 | ||||||
| Current deferred taxes |
40 | 40 | ||||||
| Prepaid taxes |
55 | 45 | ||||||
| Other current assets |
18 | 26 | ||||||
| Total current assets |
1,016 | 1,085 | ||||||
| Property, plant, and equipment, net |
217 | 229 | ||||||
| Goodwill |
59 | 57 | ||||||
| Other intangible assets, net |
156 | 154 | ||||||
| Deferred financing costs |
23 | 22 | ||||||
| Deferred income taxes |
85 | 85 | ||||||
| Investments and other assets |
33 | 41 | ||||||
| Total assets |
$ | 1,589 | $ | 1,673 | ||||
| Liabilities and shareholder’s equity |
||||||||
| Current liabilities: |
||||||||
| Accounts payable |
$ | 244 | $ | 264 | ||||
| Notes payable |
27 | 35 | ||||||
| Other accrued expenses |
151 | 139 | ||||||
| Accrued payroll and employee benefits |
33 | 42 | ||||||
| Total current liabilities |
455 | 480 | ||||||
| Long-term debt |
669 | 707 | ||||||
| Deferred employee benefits and other noncurrent liabilities |
17 | 21 | ||||||
| Total liabilities |
1,141 | 1,208 | ||||||
| Contingencies and commitments |
||||||||
| Common stock, $.01 par value, 1,000 shares authorized, issued and outstanding |
— | — | ||||||
| Additional paid-in capital |
454 | 455 | ||||||
| Accumulated deficit |
(57 | ) | (54 | ) | ||||
| Accumulated other comprehensive income |
39 | 51 | ||||||
| Total shareholder’s equity of the Company |
436 | 452 | ||||||
| Noncontrolling interest in consolidated subsidiaries |
12 | 13 | ||||||
| Total shareholder’s equity |
448 | 465 | ||||||
| Total liabilities and shareholder’s equity |
$ | 1,589 | $ | 1,673 | ||||
The accompanying notes are an integral part of the unaudited condensed consolidated financial statements.
5
Table of Contents
Affinia Group Intermediate Holdings Inc.
Unaudited Condensed Consolidated Statements of Cash Flows
| (Dollars in millions) |
Three Months Ended March 31, 2010 |
Three Months Ended March 31, 2011 |
||||||
| Operating activities |
||||||||
| Net income |
$ | 8 | $ | 3 | ||||
| Adjustments to reconcile net income to net cash used in operating activities: |
||||||||
| Depreciation and amortization |
9 | 10 | ||||||
| Stock-based compensation |
— | 1 | ||||||
| Provision for deferred income taxes |
(3 | ) | — | |||||
| Change in trade accounts receivable |
(48 | ) | (27 | ) | ||||
| Change in inventories |
(21 | ) | (34 | ) | ||||
| Change in other current operating assets |
11 | 2 | ||||||
| Change in other current operating liabilities |
11 | 14 | ||||||
| Change in other |
(6 | ) | — | |||||
| Net cash used in operating activities |
(39 | ) | (31 | ) | ||||
| Investing activities |
||||||||
| Proceeds from the sale of affiliates |
11 | — | ||||||
| Change in restricted cash |
(2 | ) | (2 | ) | ||||
| Additions to property, plant and equipment |
(6 | ) | (16 | ) | ||||
| Other investing activities |
(1 | ) | 2 | |||||
| Net cash provided by (used in) investing activities |
2 | (16 | ) | |||||
| Financing activities |
||||||||
| Net increase in other short-term debt |
8 | 8 | ||||||
| Payments of other debt |
— | (2 | ) | |||||
| Net proceeds from ABL Revolver |
10 | 40 | ||||||
| Net cash provided by financing activities |
18 | 46 | ||||||
| Effect of exchange rates on cash |
(1 | ) | 1 | |||||
| Decrease in cash and cash equivalents |
(20 | ) | — | |||||
| Cash and cash equivalents at beginning of the period |
65 | 55 | ||||||
| Cash and cash equivalents at end of the period |
$ | 45 | $ | 55 | ||||
| Supplemental cash flows information |
||||||||
| Cash paid during the period for: |
||||||||
| Interest |
$ | 15 | $ | 12 | ||||
| Income taxes |
$ | 13 | $ | 8 | ||||
The accompanying notes are an integral part of the unaudited condensed consolidated financial statements.
6
Table of Contents
Affinia Group Intermediate Holdings Inc.
Notes to Unaudited Condensed Consolidated Financial Statements
Note 1. Description of Business
Affinia Group Intermediate Holdings Inc. is a global leader in the light and commercial vehicle replacement products and services industry. We derive approximately 98% of our sales from this industry. Our broad range of brake, filtration, chassis and other products are sold in North America, Europe, South America, Asia and Africa. Our brands include WIX®, Raybestos®, Nakata®, Brake-Pro®, FiltronTM, AIMCO® and McQuay-Norris®. Additionally, we provide private label products for NAPA®, CARQUEST®, ACDelco® and other customers and co-branded offerings for Federated Auto Parts (“Federated”) and Automotive Distribution Network (“ADN”). We are controlled by affiliates of The Cypress Group L.L.C. (collectively, “Cypress”).
Affinia Group Inc., one of our subsidiaries and a Delaware corporation formed on June 28, 2004, entered into a stock and asset purchase agreement on November 30, 2004, as amended with Dana Corporation, which provided for the acquisition by Affinia Group Inc. of substantially all of Dana Corporation’s aftermarket business operations (the “Acquisition”).
The accompanying Consolidated Financial Statements include the accounts of the Company and its subsidiaries. In these Notes to the Consolidated Financial Statements, the terms “the Company,” “we,” “our” and “us” refer to Affinia Group Intermediate Holdings Inc. and its subsidiaries on a consolidated basis.
Note 2. Summary of Significant Accounting Policies
Basis of Presentation
The interim financial information is prepared in conformity with accounting principles generally accepted in the United States of America (“U.S. GAAP”) and such principles are applied on a basis consistent with information reflected in our Form 10-K for the year ended December 31, 2010 filed with the Securities and Exchange Commission (“SEC”). Certain information and footnote disclosures normally included in financial statements prepared in accordance with U.S. GAAP have been condensed or omitted pursuant to the rules and regulations promulgated by the SEC. In the opinion of management, the interim financial information includes all adjustments and accruals, consisting only of normal recurring adjustments, which are necessary for a fair presentation of results for the respective interim period.
Principles of Consolidation
In accordance with Accounting Standards Codification (“ASC”) Topic 810, “Consolidation,” the consolidated financial statements include the accounts of Affinia Group Intermediate Holdings Inc. and its wholly owned subsidiaries, majority-owned subsidiaries and variable interest entities (“VIE”) for which Affinia Group Intermediate Holdings Inc. (or one of its subsidiaries) is the primary beneficiary. All intercompany transactions have been eliminated. Equity investments in which we exercise significant influence but do not control are accounted for using the equity method. Investments in which we are not able to exercise significant influence over the investee are accounted for under the cost method. Longkou Haimeng Machinery Company Limited (“Haimeng”) a subsidiary of Affinia Hong Kong Limited and Affinia India Private Limited have been reporting their financial results on a one-month reporting lag. Additionally, the newly formed filtration and friction companies in China are also on a one-month lag.
Starting January 1, 2011, Haimeng reported its financial results without a one-month reporting lag. The previously existing one-month reporting lag was eliminated as it was no longer required to achieve a timely consolidation due to the Company’s investments in systems and personnel to enhance our financial statement close process. In accordance with ASC 850-10-45-13, “A Change in the Difference Between Parent and Subsidiary Fiscal Year-Ends,” the elimination of this previously existing reporting lag is considered a voluntary change in accounting principle in accordance with ASC 250-10-50, “Change in Accounting Principle.” The Company believes that this change in accounting principle is preferable because it will result in more timely reporting of the operations of Haimeng. A change in accounting principle is to be reported through retrospective application of the new principle to all prior financial statement periods presented. The change in accounting principle was not material to the previously reported annual and interim periods and therefore we have not adjusted those prior period consolidated financial statements. The impact was also not material to the period ended March 2011. To eliminate the lag, the Company’s operations for the quarter ended March 31, 2011 includes the results of Haimeng for the four months of December 2010 to March 2011. The inclusion of the results of the fourth month increased net income by $0.4 million.
7
Table of Contents
Note 3. Acquisition
On December 16, 2010, the Company, through its subsidiary Affinia Products Corp LLC, acquired substantially all the assets of North American Parts Distributors, Inc. (“NAPD”), located in Ramsey, New Jersey. The business is an automobile parts and supplies wholesaler. The NAPD acquisition expands our product offering of chassis parts to one of the broadest in the industry. NAPD’s purchased assets and assumed liabilities were acquired for cash consideration of $52 million. The initial purchase price was $51 million and was paid in 2010. Subsequently, in 2011 the working capital adjustment was settled for $1 million. The working capital adjustment was based on the difference between targeted working capital and working capital at the closing date. This acquisition was considered immaterial for disclosure of supplemental pro forma information and revenues and earnings of the acquiree since the acquisition date. We financed this acquisition with the available borrowings under our four-year $315 million asset-based revolving credit facility (the “ABL Revolver”), which borrowings were repaid with our completed offering on December 9, 2010 of an additional $100 million aggregate principal amount of 9% Senior Subordinated Notes due 2014 (the “Additional Notes”).
The aforementioned acquisition has been accounted for under the purchase method of accounting, in accordance with ASC Topic 805, “Business Combinations.” We engaged independent appraisers to assist in determining the fair values of inventory and intangible assets acquired; including non-competition agreements, developed technology and customer relationships. Purchase price allocations are subject to adjustment until all pertinent information regarding the acquisition is obtained and fully evaluated. Based on our preliminary valuations and purchase accounting adjustments, we recorded $22 million as goodwill at the end of 2010. The Company, however, has not completely finalized the allocation of the purchase price as of March 31, 2011. We have made a preliminary allocation of the purchase price on the basis of its current estimate of the fair value of the underlying assets acquired and liabilities assumed. We expect the goodwill will be deductible for tax purposes. During 2011, we may make further adjustments to these preliminary allocations.
The following table summarizes the estimated fair values of the assets acquired and liabilities assumed at the date of the acquisition:
| (Dollars in millions) |
Preliminary Allocation |
|||
| Inventory |
$ | 10 | ||
| Trade accounts receivable |
7 | |||
| Customer relationships |
8 | |||
| Non-competition agreement |
1 | |||
| Unpatented technology (i.e, tooling) |
5 | |||
| Goodwill |
22 | |||
| Total acquired assets |
$ | 53 | ||
| Current liabilities |
1 | |||
| Net assets acquired |
$ | 52 | ||
Cash and cash equivalents, trade accounts receivable, accounts payable, accrued expenses and other current liabilities were recorded at historical carrying values, given the short-term nature of these assets and liabilities. Customer relationships with estimated useful life of 20 years were valued using an income approach, which utilized a discounted cash flow method. The unpatented technology with an estimated useful life of 10 years was valued utilizing a relief from royalty method. The non-competition agreement with an estimated useful life of 5 years was valued utilizing a form of the discounted cash flow method to determine the value of lost income.
8
Table of Contents
Note 4. New Accounting Pronouncements
In January 2010, the FASB issued ASU 2010-6, “Improving Disclosures about Fair Value Measurements.” This update requires additional disclosure within the roll forward of activity for assets and liabilities measured at fair value on a recurring basis, including transfers of assets and liabilities between Level 1 and Level 2 of the fair value hierarchy and the separate presentation of purchases, sales, issuances and settlements of assets and liabilities within Level 3 of the fair value hierarchy. In addition, the update requires enhanced disclosures of the valuation techniques and inputs used in the fair value measurements within Levels 2 and 3. The new disclosure requirements are effective for interim and annual periods beginning after December 15, 2009. We adopted this guidance on disclosures in the first quarter of 2010. There are also additional new disclosure requirements for purchases, sales, issuances and settlements of Level 3 measurements, which are effective for interim and annual periods beginning after December 15, 2010. The adoption of ASU 2010-6 did not have a material impact on the Company’s consolidated financial statements.
In July 2010, the FASB amended ASC 310, “Receivables,” with ASU 2010-20, “Receivables (Topic 310): Disclosures about the Credit Quality of Financing Receivables and the Allowance for Credit Losses,” to require additional information related to financing receivables, including loans and trade accounts receivable with contractual maturities exceeding one year. With the exception of disclosures related to activity occurring during a reporting period, which are effective for fiscal years beginning after December 15, 2010, the provisions of this update are effective as of December 31, 2010. The adoption of ASU 2010-20 did not have a material impact on the Company’s consolidated financial statements.
Note 5. Fair Value Debt
The fair value of debt, net of discount, is as follows:
Fair Value of Debt at December 31, 2010
| (Dollars in millions) |
Book Value of Debt |
Fair Value Factor |
Fair Value of Debt |
|||||||||
| Senior subordinated notes, due November 2014 |
$ | 367 | 102.75 | % | $ | 377 | ||||||
| Senior secured notes, due August 2016 |
200 | 111.00 | % | 222 | ||||||||
| ABL revolver, due November 2015 |
90 | 100 | % | 90 | ||||||||
| Affiliate debt |
39 | 100 | % | 39 | ||||||||
| Total fair value of debt at December 31, 2010 |
$ | 728 | ||||||||||
Fair Value of Debt at March 31, 2011
| (Dollars in millions) |
Book Value of Debt |
Fair Value Factor |
Fair Value of Debt |
|||||||||
| Senior subordinated notes, due November 2014 |
$ | 367 | 103.13 | % | $ | 379 | ||||||
| Senior secured notes, due August 2016 |
200 | 113.94 | % | 228 | ||||||||
| ABL revolver, due November 2015 |
130 | 100 | % | 130 | ||||||||
| Affiliate debt |
45 | 100 | % | 45 | ||||||||
| Total fair value of debt at March 31, 2011 |
$ | 782 | ||||||||||
The carrying value of fixed rate short-term debt approximates fair value because of the short term nature of these instruments, and the carrying value of the Company’s current floating rate debt instruments approximates fair value because of the variable interest rates pertaining to those instruments. The fair value of the long-term debt was estimated based on quoted market prices.
9
Table of Contents
Note 6. Inventories, net
Inventories are valued at the lower of cost or market. Cost is determined on the FIFO basis for all domestic inventories or average cost basis for non-U.S. inventories. Inventories are reduced by an allowance for slow-moving and obsolete inventories based on management’s review of on-hand inventories compared to historical and estimated future sales and usage. A summary of inventories, net is provided in the table below:
| (Dollars in millions) |
At December 31, 2010 |
At March 31, 2011 |
||||||
| Raw materials |
$ | 120 | $ | 120 | ||||
| Work- in- process |
34 | 37 | ||||||
| Finished goods |
366 | 403 | ||||||
| $ | 520 | $ | 560 | |||||
Note 7. Comprehensive Income
The elements of comprehensive income are presented in the following table:
| (Dollars in millions) |
Three Months Ended March 31, 2010 |
Three Months Ended March 31, 2011 |
||||||
| Net income |
$ | 8 | $ | 3 | ||||
| Change in foreign currency translation adjustments, net of tax |
(12 | ) | 12 | |||||
| Comprehensive income (loss) |
(4 | ) | 15 | |||||
| Less: Comprehensive income attributable to noncontrolling interest |
2 | 1 | ||||||
| Comprehensive income (loss) attributable to the Company |
$ | (6 | ) | $ | 14 | |||
Note 8. Goodwill
Goodwill as of March 31, 2011 was $57 million and consisted of the following: $24 million for the acquisition of Haimeng in 2008, $22 million for the acquisition of NAPD, $9 million for the initial acquisition in 2004 and $2 million for a minor acquisition in 2008. For the 2004 acquisition, in accordance with ASC Topic 805-740 the tax benefit for the excess of tax-deductible goodwill over the reported amount of goodwill is applied to first reduce the goodwill related to the 2004 acquisition. The tax benefit for the excess of tax deductible goodwill reduced reported goodwill by approximately $8 million during 2010 and $2 million during the first three months of 2011. We anticipate goodwill being reduced by another $6 million during 2011. Once the reported amount of goodwill for the 2004 acquisition is reduced to zero, the remaining tax benefit reduces the basis of intangible assets purchased in the 2004 acquisition. Any remaining tax benefit reduces the income tax provision.
In conjunction with the acquisition of the NAPD business, we determined the fair value of intangibles, property, plant and equipment, other assets and liabilities. Based on our valuations and purchase accounting adjustments, we recorded $22 million as goodwill as of December 31, 2010.
The following table summarizes our goodwill activity, which is related to the On and Off-highway segment for the first three months of 2011:
| (Dollars in millions) |
Three Months Ended March 31, 2011 |
|||
| Balance at December 31, 2010 |
$ | 59 | ||
| Tax benefit reductions |
(2 | ) | ||
| Balance at March 31, 2011 |
$ | 57 | ||
10
Table of Contents
Note 9. Commitments and Contingencies
At March 31, 2011, the Company had purchase commitments for property, plant and equipment of approximately $17 million.
A reconciliation of the changes in our return reserves is as follows:
| (Dollars in millions) |
Three Months Ended March 31, 2010 |
Three Months Ended March 31, 2011 |
||||||
| Beginning balance |
$ | 17 | $ | 17 | ||||
| Amounts charged to revenue |
12 | 11 | ||||||
| Returns processed |
(12 | ) | (11 | ) | ||||
| $ | 17 | $ | 17 | |||||
Note 10. Income Taxes
The total amount of unrecognized tax benefits as of December 31, 2010 and March 31, 2011 was $2 million, and if recognized, would affect the effective tax rate. The Company recognizes interest related to unrecognized tax benefits in interest expense and recognizes penalties as part of the income tax provision. As of March 31, 2011 the Company’s accrual for interest and penalties was less than $1 million. The Company is subject to taxation in the U.S. and various state and foreign jurisdictions. For jurisdictions in which the Company transacts significant business, tax years ended December 31, 2004 and later remain subject to examination by tax authorities. We do not anticipate any material change in the total amount of unrecognized tax benefits to occur within the next twelve months. The effective tax rate was 25% for the first three months of 2010 and 2011.
Note 11. Legal Proceedings
On March 31, 2008, a class action lawsuit was filed by S&E Quick Lube Distributors, Inc. of Utah against several auto parts manufacturers for allegedly conspiring to fix prices for replacement oil, air, fuel and transmission filters. Several auto parts companies are named as defendants, including Champion Laboratories, Inc., Purolator Filters NA LLC, Honeywell International Inc., Cummins Filtration Inc., Donaldson Company, Baldwin Filters Inc., Bosch USA., Mann + Hummel USA Inc., ArvinMeritor Inc., United Components Inc. and Wix Filtration Corp LLC (“Wix Filtration”), one of our subsidiaries. The lawsuit is currently pending as a consolidated Multi-District Litigation (“MDL”) Proceeding in Chicago, IL because of multiple “tag-along” filings in several jurisdictions. Two suits have also been filed in the Canadian provinces of Ontario and Quebec. Wix Filtration, along with other named defendants, have filed various motions to dismiss plaintiffs’ complaints, which were denied by the court in December 2009. Several defendants, including Wix Filtration, refiled motions to dismiss based upon plaintiff’s most recent amended complaint. The court denied those motions in September 2010. Discovery in the action continues. Significantly, the deposition of plaintiffs’ main witness occurred in December 2010 and did not implicate Wix in any overt acts of price fixing. The U.S. Department of Justice moved to intervene and stay the proceedings for 3 months while they complete their grand jury investigation. The motion was granted by the Court and a 90 day stay is currently in place. We believe that Wix Filtration did not engage in any improper conduct and in any event did not have significant sales in this particular market at the relevant time periods so we do not expect the lawsuit to have a material adverse effect on our financial condition or results of operations. We intend to vigorously defend this matter.
The Company has various accruals for civil liability, including product liability, and other costs. If there is a range of equally probable outcomes, we accrue at the lower end of the range. The Company had $2 million accrued as of December 31, 2010 and March 31, 2011. In addition, we have various other claims that are not probable of occurrence that range from less than $1 million to $12 million. There are no recoveries expected from third parties.
Note 12. Restructuring of Operations
In 2005, we announced two restructuring plans: (i) a restructuring plan that we announced at the beginning of 2005 as part of the Acquisition, also referred to as the acquisition restructuring and (ii) a restructuring plan that we announced at the end of 2005, also referred to herein as the comprehensive restructuring. We have completed the acquisition restructuring and we have almost completed the comprehensive restructuring.
The comprehensive restructuring was announced in December 2005 and has resulted in the closure of 36 facilities. Additionally, we previously announced the closure of our Litchfield, Illinois plant but the closure date has been delayed until late 2011. Once this plant is closed in 2011 the comprehensive restructuring will be completed. We anticipate that we will incur over the next couple of years approximately $3 million additional comprehensive restructuring costs related to the closure of the final facility and other costs related to closed facilities which we still own or lease.
11
Table of Contents
The restructuring charges for the comprehensive restructuring and further restructuring consist of employee termination costs, other exit costs and impairment costs. Severance costs are being accounted for in accordance with ASC Topic 420, “Exit or Disposal Cost Obligations” and ASC Topic 712, “Compensation – Nonretirement Postemployment Benefits.” The following summarizes the restructuring charges and activity for all the Company’s restructuring programs:
Accrued Restructuring
| (Dollars in millions) |
Comprehensive | Other | Total | |||||||||
| Balance at December 31, 2010 |
$ | 3 | $ | 1 | $ | 4 | ||||||
| Charges to expense: |
||||||||||||
| Employee termination benefits |
— | — | — | |||||||||
| Asset write-offs expense |
— | — | — | |||||||||
| Other expenses |
1 | 1 | 2 | |||||||||
| Total restructuring expenses |
1 | 1 | 2 | |||||||||
| Cash payments and asset write-offs: |
||||||||||||
| Cash payments |
(1 | ) | (1 | ) | (2 | ) | ||||||
| Asset retirements and other |
— | — | — | |||||||||
| Balance at March 31, 2011 |
$ | 3 | $ | 1 | $ | 4 | ||||||
At March 31, 2011, $4 million of restructuring charges remained in other accrued expenses, relating to wage and healthcare continuation for severed employees and other termination costs. These remaining benefits are expected to be paid during 2011. The following table shows the restructuring expenses by segment:
| (Dollars in millions) |
Three Months Ended March 31, 2010 |
Three Months Ended March 31, 2011 |
||||||
| On and Off-highway segment |
$ | 4 | $ | 2 | ||||
| Brake South America segment |
— | — | ||||||
| Corporate, eliminations and other |
— | — | ||||||
| 4 | 2 | |||||||
| Commercial Distribution Europe segment |
— | — | ||||||
| Total |
$ | 4 | $ | 2 | ||||
Note 13. Segment and Geographic Information
The products, customer base, distribution channel, manufacturing process and procurement are similar throughout all of the Company’s operations. However, due to different economic characteristics in the Company’s operations and in conformity with ASC Topic 280, the Company was previously presented as three separate reporting segments: (1) the On and Off-highway segment, which is composed of Filtration, Brake North America and Asia, Chassis, and Commercial Distribution South America, (2) the Brake South America segment, and (3) the Commercial Distribution Europe segment. All three segments are in the On and Off-highway industry but for segment reporting purposes we refer to the first segment as the On and Off-highway segment. Because of the sale of our Commercial Distribution Europe segment the Commercial Distribution Europe segment was classified as discontinued operations and, as such, is not presented in the net sales and operating profit segment tables below. Segment net sales, operating profit, total assets, depreciation and capital expenditures were as follows:
| Net Sales | ||||||||
| (Dollars in millions) |
Three Months Ended March 31, 2010 |
Three Months Ended March 31, 2011 |
||||||
| On and Off-highway segment |
$ | 444 | $ | 504 | ||||
| Brake South America segment |
3 | 4 | ||||||
| Corporate, eliminations and other |
(4 | ) | (3 | ) | ||||
| $ | 443 | $ | 505 | |||||
12
Table of Contents
| Operating Profit | ||||||||
| (Dollars in millions) |
Three Months Ended March 31, 2010 |
Three Months Ended March 31, 2011 |
||||||
| On and Off-highway segment |
$ | 32 | $ | 33 | ||||
| Brake South America segment |
(1 | ) | (1 | ) | ||||
| Corporate, eliminations and other |
(8 | ) | (10 | ) | ||||
| $ | 23 | $ | 22 | |||||
| Total Assets | ||||||||
| (Dollars in millions) |
December 31, 2010 |
March 31, 2011 |
||||||
| On and Off-highway segment |
$ | 1,417 | $ | 1,541 | ||||
| Brake South America segment |
— | — | ||||||
| Corporate, eliminations and other |
172 | 132 | ||||||
| $ | 1,589 | $ | 1,673 | |||||
| Depreciation and Amortization | ||||||||
| (Dollars in millions) |
Three Months Ended March 31, 2010 |
Three Months Ended March 31, 2011 |
||||||
| On and Off-highway segment |
$ | 6 | $ | 8 | ||||
| Brake South America segment |
— | — | ||||||
| Corporate, eliminations and other |
3 | 2 | ||||||
| $ | 9 | $ | 10 | |||||
| Capital Expenditures | ||||||||
| (Dollars in millions) |
Three Months Ended March 31, 2010 |
Three Months Ended March 31, 2011 |
||||||
| On and Off-highway segment |
$ | 5 | $ | 16 | ||||
| Brake South America segment |
1 | — | ||||||
| Corporate, eliminations and other |
— | — | ||||||
| $ | 6 | $ | 16 | |||||
13
Table of Contents
Net Sales by geographic region were as follows:
| (Dollars in millions) |
Three Months Ended March 31, 2010 |
Three Months Ended March 31, 2011 |
||||||
| Brazil |
$ | 95 | $ | 105 | ||||
| Canada |
27 | 29 | ||||||
| Poland |
32 | 36 | ||||||
| Other Countries |
29 | 48 | ||||||
| Total Other Countries |
183 | 218 | ||||||
| United States |
260 | 287 | ||||||
| $ | 443 | $ | 505 | |||||
Long-lived assets by geographic region were as follows:
| (Dollars in millions) |
December 31, 2010 |
March 31, 2011 |
||||||
| China |
$ | 76 | $ | 83 | ||||
| Canada |
15 | 7 | ||||||
| Brazil |
13 | 12 | ||||||
| Other Countries |
66 | 71 | ||||||
| Total Other Countries |
170 | 173 | ||||||
| United States |
285 | 289 | ||||||
| $ | 455 | $ | 462 | |||||
Net sales by geographic region were determined based on origin of sale. Geographic data on long-lived assets are comprised of property, plant and equipment, goodwill, other intangible assets and deferred financing costs.
We offer primarily three types of products: brake products, which include brake drums, rotors, pads and shoes and hydraulic brake system components; filtration products, which include oil, fuel, air and other filters; and chassis products, which include steering, suspension and driveline components. Additionally, we have our Commercial Distribution South America products, which offer brake, chassis, filtration and other products. The Company’s sales by group of similar products are as follows:
| (Dollars in millions) |
Three Months Ended March 31, 2010 |
Three Months Ended March 31, 2011 |
||||||
| Brake products |
$ | 128 | $ | 143 | ||||
| Filtration products |
185 | 196 | ||||||
| Chassis products |
36 | 59 | ||||||
| Commercial Distribution South America products |
98 | 110 | ||||||
| Corporate, eliminations and other |
(4 | ) | (3 | ) | ||||
| $ | 443 | $ | 505 | |||||
14
Table of Contents
Note 14. Stock Incentive Plan
On July 20, 2005, Affinia Group Holdings Inc. adopted the Affinia Group Holdings Inc. 2005 Stock Incentive Plan, which we refer to as our 2005 Stock Plan. The 2005 Stock Plan permits the grant of non-qualified stock options, incentive stock options, stock appreciation rights, restricted stock and other stock-based awards to employees, directors or consultants of Affinia Group Holdings Inc. and its affiliates. A maximum of 350,000 shares of Affinia Group Holdings Inc. common stock may be subject to awards under the 2005 Stock Plan.
A table of the 2005 Stock Plan balances for the restricted stock units, stock options, deferred compensation shares and stock awards is summarized below.
| December 31, 2010 |
March 31, 2011 |
|||||||
| Restricted stock units* |
239,000 | 239,000 | ||||||
| Stock options* |
34,062 | 30,205 | ||||||
| Deferred compensation shares |
19,967 | 31,307 | ||||||
| Stock award |
163 | 163 | ||||||
| Shares available |
56,808 | 49,325 | ||||||
| Number of shares of common stock subject to awards |
350,000 | 350,000 | ||||||
| * | Affinia Group Holdings Inc. commenced an offer to certain eligible holders of stock options to exchange their existing stock options to purchase shares of Affinia Group Holdings Inc.’s common stock for restricted stock units (“ RSUs”) with new vesting terms (the “Option Exchange”). The Option election period commenced on August 25, 2010 and expired on September 24, 2010. The completion of the Option Exchange for the RSUs occurred on October 18, 2010 and 100% of the eligible option holders elected to participate. A total of 24 eligible employees and directors participated in the Option Exchange. In addition, three eligible employees and directors who did not have vested options received RSUs. Affinia Group Holdings Inc. accepted for exchange options to purchase a total of 61,868 shares of Affinia Group Holdings Inc.’s common stock. All surrendered options were cancelled in exchange for RSUs. The options had been fully expensed by the exchange date. The total RSUs issued on October 18, 2010 and December 1, 2010 covered 235,000 and 4,000 shares, respectively, of Affinia Group Holdings Inc.’s common stock. |
Stock Options
As of March 31, 2011, 30,205 stock options had been awarded, which included vested options of 30,205 and no unvested options. Pursuant to the terms of the 2005 Stock Plan, each option expires August 1, 2015. The exercise price is $100 per option.
We account for our employee stock options under the fair value method of accounting using a Black-Scholes model to measure stock-based compensation expense at the date of grant. Dividend yields were not a factor because there were no cash dividends declared during 2010 and the first three months of 2011. Our weighted-average Black-Scholes fair value assumptions include:
| 2010 | 2011 | |||||||
| Weighted-average effective term |
5.2 years | 5.2 years | ||||||
| Weighted-average risk free interest rate |
4.38 | % | 4.40 | % | ||||
| Weighted-average expected volatility |
40.4 | % | 40.3 | % | ||||
| Weighted-average fair value of options (Dollars in millions) |
$ | 1 | $ | 1 | ||||
The fair value of the stock option grants is amortized to expense over the vesting period. The Company reduces the overall compensation expense by a turnover rate consistent with historical trends. Stock-based compensation expense, which was recorded in selling, general and administrative expenses, and tax related income tax benefits were less than $1 million and nil for each of the three month periods ending March 31, 2010 and 2011, respectively.
| Options | ||||
| Outstanding at December 31, 2010 |
34,062 | |||
| Forfeited/expired |
(3,857 | ) | ||
| Outstanding at March 31, 2011 |
30,205 | |||
15
Table of Contents
Restricted Stock Units
The RSUs granted in connection with the Option Exchange are governed by the 2005 Stock Plan and a new Restricted Stock Unit Award Agreement.
The RSUs are subject to performance-based and market-based vesting restrictions, which differ from the performance and time-based vesting restrictions applicable to the exchanged stock options. The RSUs will vest if (i) the RSU holder remains employed with Affinia Group Holdings Inc. on the date that either of the following vesting conditions occurs and (ii) either of the following vesting conditions occurs on or prior to the date on which Cypress ceases to hold any remaining Affinia Group Holdings Inc. common stock:
| • | Cypress Scenario—Cypress has received aggregate transaction proceeds in cash or marketable securities (not subject to escrow, lock-up, trading restrictions or claw-back) with respect to the disposition of more than 50% of its common equity interests in Affinia Group Holdings Inc. in an amount that represents a per-share equivalent value that is greater than or equal to two times the average per share price paid by Cypress for its aggregate common equity investment in Affinia Group Holdings Inc.; or |
| • | IPO Scenario—Affinia Group Holdings Inc.’s common stock trades on a public stock exchange at an average closing price of $225 (as adjusted for stock splits) over a 60 consecutive trading day period. |
As of March 31, 2011, 239,000 RSUs had been awarded, none of which have vested. We estimate the fair value of market-based RSUs using a Monte Carlo simulation model on the date of grant. Our weighted-average Monte Carlo fair value assumptions include:
| Cypress Scenario | IPO Scenario | |||||||
| Effective term |
0.6 years | 1.4 years | ||||||
| Risk free interest rate |
1.1 | % | 1.1 | % | ||||
| Expected volatility |
70 | % | 70 | % | ||||
| Fair value of an RSU |
$ | 107.72 | $ | 124.25 | ||||
| Expected expense (Dollars in millions) |
$ | 26 | $ | 30 | ||||
In the event that either of the performance-based conditions (Cypress Scenario or IPO Scenario) is met, the fair value of the RSUs will be recognized in stock-based compensation expense either 1) pro rata over the requisite service term including a cumulative catch-up related to service provided through the date the performance condition is met or 2) in full once the respective market-based condition is met or 3) in full if the requisite service period has already passed when the performance condition is met. Stock-based compensation expense, which would be recorded in selling, general and administrative expenses, and tax related income tax benefits was not recorded for the first three months of 2011 as neither of the performance conditions have been met. If the RSUs do not vest prior to ten years from the date of grant then the RSUs will expire. If the performance condition is met on the 239,000 RSUs the amount of expense we would have to record is $30 million under the IPO scenario or $26 million under the Cypress scenario.
| RSUs | ||||
| Outstanding at December 31, 2010 |
239,000 | |||
| Granted |
— | |||
| Forfeited/expired |
— | |||
| Outstanding at March 31, 2011 |
239,000 | |||
16
Table of Contents
Note 15. Venezuelan Operations
As required by U.S. GAAP, effective January 1, 2010, we accounted for Venezuela as a highly inflationary economy because the three-year cumulative inflation rate for Venezuela using the blended Consumer Price Index (which is associated with the city of Caracas) and the National Consumer Price Index (developed commencing in 2008 and covering the entire country of Venezuela) exceeded 100%.
Effective January 1, 2010, our Venezuelan subsidiary uses the U.S. Dollar as its functional currency. The financial statements of our subsidiary must be re-measured into the Company’s reporting currency (U.S. Dollar) and future exchange gains and losses from the re-measurement of monetary assets and liabilities are reflected in current earnings, rather than exclusively in the equity section of the balance sheet, until such time as the economy is no longer considered highly inflationary. The local currency in Venezuela is the bolivar fuerte (“VEF”).
On January 11, 2010, the Venezuelan government devalued the country’s currency and changed to a two-tier exchange structure. The official exchange rate moved from 2.15 VEF per U.S. Dollar to 2.60 for essential goods and 4.30 for non-essential goods and services, with our products falling into the non-essential category. A Venezuelan currency control board is responsible for foreign exchange procedures, including approval of requests for exchanges of VEF for U.S. Dollars at the official (government established) exchange rate. Our business in Venezuela has been unsuccessful in obtaining U.S. Dollars at the official exchange rate. An unregulated parallel market existed for exchanging VEF for U.S. Dollars through securities transactions; and our Venezuelan subsidiary had been able to enter into such exchange transactions until May 2010, as discussed further below. The Company used the unregulated parallel market rate to translate the financial statements of its Venezuelan subsidiary through May 2010 because we expected to obtain U.S. Dollars at the unregulated parallel market rate for future dividend remittances. During the second quarter of 2010, the unregulated parallel market was suspended and the Central Bank of Venezuela began regulating the parallel market. The Central Bank of Venezuela has also imposed volume restrictions on use of the regulated parallel market, which is also referred to as the SITME rate. We will use the regulated parallel market rate to re-measure the financial statements of our Venezuelan subsidiary to comply with the regulations of Venezuela and are analyzing the impact of the volume restrictions on our business. The currency exchange limitations to date have not had a material effect on our 2010 earnings and cash flow.
Effective January 1, 2010, we changed the rate used to re-measure our Venezuelan subsidiary’s transactions and balances from the official exchange rate of 2.15 VEF to the U.S. Dollar to the parallel market rate, which ranged between 5.30 and 7.70 VEF to the U.S. Dollar during 2010. The one-time devaluation had a $2 million negative impact on our pre-tax net income. As described above, during the second quarter of 2010, we changed the rate used to re-measure our Venezuelan subsidiary’s transactions to the SITME rate of 5.30 VEF to the U.S. Dollar. For the 2010 fiscal year, our Venezuela subsidiary represented approximately 1% of our consolidated net sales and it had a net loss attributable to the Company of $8 million, of which $7 million related to restructuring. The Venezuelan subsidiary also had $8 million of total assets and $7 million of total liabilities as of December 31, 2010. For the first quarter of 2011, our Venezuela subsidiary represented approximately 2% of our consolidated net sales and it had a net income attributable to the Company of $1 million. The Venezuelan subsidiary also had $10 million of total assets and $8 million of total liabilities as of March 31, 2011.
On December 30, 2010, the Venezuelan government devalued the VEF by unifying the essential goods exchange rate of 2.60 VEF per U.S. Dollar with the non-essential goods and services exchange rate of 4.30 VEF per U.S. Dollar. The Company does not transact at the essential goods exchange rate as it has been unsuccessful in obtaining U.S. Dollars at the official exchange rate; as such, the devaluation does not impact the Company’s financial statements. The Company continues to use the regulated parallel market rate of 5.30 VEF per U.S. Dollar.
Note 16. Derivatives
The Company’s financial derivative assets and liabilities consist of standard currency forward contracts. The fair value framework requires the categorization of assets and liabilities into three levels based upon the assumptions (inputs) used to price the assets or liabilities. Level 1 provides the most reliable measure of fair value, whereas Level 3 generally requires significant management judgment. The three levels are defined as follows:
| • | Level 1: Unadjusted quoted prices in active markets for identical assets and liabilities. |
| • | Level 2: Observable inputs other than those included in Level 1. For example, quoted prices for similar assets or liabilities in active markets or quoted prices for identical assets or liabilities in inactive markets. |
| • | Level 3: Unobservable inputs reflecting management’s own assumptions about the inputs used in pricing the asset or liability. |
All derivative instruments are recognized on our balance sheet at fair value. The fair value measurements of our currency derivatives are based upon Level 2 inputs consisting of observable market data pertaining to relevant currency exchange rates, as
17
Table of Contents
reported by a recognized independent third-party financial information provider. Based upon the Company’s periodic assessment of our own creditworthiness, and of the counterparties to our derivative instruments’ fair value measurements are not adjusted for nonperformance risk.
Currency Rate Derivatives
Our currency derivative contracts are valued using then-current spot and forward market data as provided by external financial institutions. We enter into short-term hedging transactions with banking institutions of only the highest tiered credit ratings and thus the counterparty credit risk associated with these contracts is not considered significant.
Our currency derivatives are undesignated hedges of specific monetary asset balances subject to currency revaluation. Changes in the fair value of these hedging transactions are recognized in income each accounting period. The Company’s outstanding currency forward contracts are recorded in the Consolidated Balance Sheets as “Other current assets” or “Other accrued expenses,” accordingly. Currency derivative gains and losses are recognized in “Other income, net” in the Consolidated Statements of Operations in the reporting period of occurrence. The Company has not recorded currency derivative gains (losses) to other comprehensive income (loss) nor has it reclassified prior period currency derivative results from other comprehensive income (loss) to earning during the last twelve months. The Company does not anticipate that it will record any currency derivative gains or losses to other comprehensive income (loss) or that it will reclassify prior period currency derivative results from other comprehensive income (loss) to earnings in the next twelve months.
The notional amount and fair value of our outstanding currency forward contracts were as follows:
| (Dollars in millions) |
Notional Amount | Asset Derivative | Liability Derivative | |||||||||
| As of March 31, 2011 |
$ | 113 | $ | 1 | $ | — | ||||||
| As of December 31, 2010 |
$ | 121 | $ | 1 | $ | — | ||||||
Note 17. Accounts Receivable Factoring
We have agreements with third party financial institutions to factor on a non-recourse basis certain receivables. The terms of the factoring arrangements provide for the factoring of certain U.S. Dollar-denominated or Canadian Dollar-denominated receivables, which are purchased at the face value amount of the receivable discounted at the annual rate of LIBOR plus a spread on the purchase date. The amount factored is not contractually defined by the factoring arrangements and our use will vary each month based on the amount of underlying receivables and the cash flow needs of the Company.
We began factoring our accounts receivable during the third quarter of 2010. During the first three months of 2011, the total accounts receivable factored was $87 million and the cost incurred on factoring was $1 million. Accounts receivable factored by the Company are accounted for as a sale and removed from the balance sheet at the time of factoring and the cost of the factoring is accounted for in other income.
Note 18. Discontinued Operation
We entered into a Sale and Purchase Agreement with Klarius Group Limited (“KGL”) and Auto Holding Paris S.A.S. (“AHP”) (collectively, the “Purchaser”) on February 2, 2010 (the “Agreement”), for the sale of our Commercial Distribution Europe segment for a purchase price of $12 million. We settled with KGL on a working capital adjustment in February 2011 and as a result the purchase price was lowered by $1 million effective for 2010. Consequently, the net purchase price after the settlement was $11 million. In accordance with ASC Topic 360, “Property, Plant, and Equipment,” the Commercial Distribution Europe segment qualified as a discontinued operation. The condensed consolidated statements of operations and the condensed consolidated balance sheets for all periods presented have been adjusted to reflect this segment as a discontinued operation. The consolidated statements of cash flows for all periods presented were not adjusted to reflect this segment as a discontinued operation. The Commercial Distribution Europe segment’s net sales were $18 million and the income from discontinued operations, net of tax was $2 million for our period of ownership in the first quarter of 2010. In accordance with ASC Topic 360, “Property, Plant, and Equipment,” intangibles and other long-lived assets were assessed for recoverability and it was determined that the net carrying value of the Commercial Distribution Europe segment may not be recoverable through the sales process. As a result, an impairment charge of $75 million was recorded within discontinued operations in 2009 to reduce the carrying value of the business to expected realizable value. A tax benefit to the Company of $24 million was recorded resulting from this transaction. The sale was consummated on February 2, 2010 and the estimated loss was subsequently decreased $2 million resulting in income from discontinued operations.
18
Table of Contents
Note 19. Financial Information for Guarantors and Non-Guarantors
Affinia Group Intermediate Holdings Inc. (presented as “Parent” in the following schedules), through its 100%-owned subsidiary, Affinia Group Inc. (presented as Issuer in the following schedules), issued $225 million aggregate principal amount of its 10.75% Senior Secured Notes due 2016 (the “Secured Notes”) on August 13, 2009 and Affinia Group Inc. issued $300 million aggregate principal amount of its 9% Senior Subordinated Notes due 2014 (the “Subordinated Notes”) on November 30, 2004, with an additional $100 million in principal amount issued December 9, 2010. As of March 31, 2011 there were $367 million and $200 million of Subordinated Notes and Secured Notes outstanding, respectively. The notes were offered only to qualified institutional buyers and certain persons in offshore transactions
The Secured Notes are fully, unconditionally and jointly and severally guaranteed on a senior secured basis and the Subordinated Notes are fully, unconditionally and jointly and severally guaranteed on an unsecured senior subordinated basis. The Subordinated Notes are general obligations of the Issuer and guaranteed by the Parent and all of the Issuer’s wholly owned current and future domestic subsidiaries (the “Guarantors”). The Issuer’s obligations under the Secured Notes are guaranteed by the Guarantors and are secured by first-priority liens, subject to permitted liens and exceptions for excluded assets, on substantially all of the Issuers and the Guarantors’ tangible and intangible assets (excluding the ABL Collateral as defined below), including real property, fixtures and equipment owned or acquired in the future by the Issuer and the Guarantors (the “Non-ABL Collateral”) and are secured by second-priority liens on all accounts receivable, inventory, cash, deposit accounts, securities accounts and proceeds of the foregoing and certain assets related thereto held by the Issuer and the Guarantors, which constitute collateral under the asset-based revolving credit facility (the “ABL Revolver”) on a first-priority basis (the “ABL Collateral”).
The following unaudited information presents Condensed Consolidating Statements of Operations for the three months ended March 31, 2010 and 2011, Condensed Consolidating Balance Sheets as of December 31, 2010 and March 31, 2011 and Condensed Consolidating Statements of Cash Flows for the three months ended March 31, 2010 and 2011 of (1) the Parent, (2) the Issuer, (3) the Guarantors, (4) the Non-Guarantors, and (5) eliminations to arrive at the information for the Company on a consolidated basis. Other separate financial statements and other disclosures concerning the Parent and the Guarantors are not presented because management does not believe that such information is material to investors.
19
Table of Contents
Affinia Group Intermediate Holdings Inc.
Supplemental Guarantor
Condensed Consolidating Statement of Operations
For the Three Months Ended March 31, 2010
| (Dollars in millions) |
Parent | Issuer | Guarantor | Non-Guarantor | Eliminations | Consolidated Total |
||||||||||||||||||
| Net sales |
$ | — | $ | — | $ | 280 | $ | 237 | $ | (74 | ) | $ | 443 | |||||||||||
| Cost of sales |
— | — | (233 | ) | (194 | ) | 74 | (353 | ) | |||||||||||||||
| Gross profit |
— | — | 47 | 43 | — | 90 | ||||||||||||||||||
| Selling, general and administrative expenses |
— | (7 | ) | (35 | ) | (25 | ) | — | (67 | ) | ||||||||||||||
| Operating profit (loss) |
— | (7 | ) | 12 | 18 | — | 23 | |||||||||||||||||
| Other income (loss), net |
— | 5 | (3 | ) | (1 | ) | — | 1 | ||||||||||||||||
| Interest expense |
— | (16 | ) | — | — | — | (16 | ) | ||||||||||||||||
| Income (loss) from continuing operations before income tax provision, equity in income and noncontrolling interest |
— | (18 | ) | 9 | 17 | — | 8 | |||||||||||||||||
| Income tax benefit (provision) |
— | 3 | — | (5 | ) | — | (2 | ) | ||||||||||||||||
| Equity interest in income, net of tax |
6 | 21 | 14 | — | (41 | ) | — | |||||||||||||||||
| Net income from continuing operations |
6 | 6 | 23 | 12 | (41 | ) | 6 | |||||||||||||||||
| Income from discontinued operations, net of tax |
— | — | — | 2 | — | 2 | ||||||||||||||||||
| Net income |
6 | 6 | 23 | 14 | (41 | ) | 8 | |||||||||||||||||
| Less: Net income attributable to noncontrolling interest, net of tax |
— | — | 2 | — | — | 2 | ||||||||||||||||||
| Net income attributable to the Company |
$ | 6 | $ | 6 | $ | 21 | $ | 14 | $ | (41 | ) | $ | 6 | |||||||||||
20
Table of Contents
Affinia Group Intermediate Holdings Inc.
Supplemental Guarantor
Condensed Consolidating Statement of Operations
For the Three Months Ended March 31, 2011
| (Dollars in millions) |
Parent | Issuer | Guarantor | Non-Guarantor | Eliminations | Consolidated Total |
||||||||||||||||||
| Net sales |
$ | — | $ | — | $ | 310 | $ | 287 | $ | (92 | ) | $ | 505 | |||||||||||
| Cost of sales |
— | — | (270 | ) | (234 | ) | 92 | (412 | ) | |||||||||||||||
| Gross profit |
— | — | 40 | 53 | — | 93 | ||||||||||||||||||
| Selling, general and administrative expenses |
— | (10 | ) | (36 | ) | (25 | ) | — | (71 | ) | ||||||||||||||
| Operating profit (loss) |
— | (10 | ) | 4 | 28 | — | 22 | |||||||||||||||||
| Other income (loss), net |
— | (2 | ) | 1 | — | — | (1 | ) | ||||||||||||||||
| Interest expense |
— | (16 | ) | — | (1 | ) | — | (17 | ) | |||||||||||||||
| Income (loss) from continuing operations before income tax provision, equity in income and noncontrolling interest |
— | (28 | ) | 5 | 27 | — | 4 | |||||||||||||||||
| Income tax benefit (provision) |
— | 6 | — | (7 | ) | — | (1 | ) | ||||||||||||||||
| Equity interest in income, net of tax |
2 | 24 | 20 | — | (46 | ) | — | |||||||||||||||||
| Net income from continuing operations |
2 | 2 | 25 | 20 | (46 | ) | 3 | |||||||||||||||||
| Loss from discontinued operations, net of tax |
— | — | — | — | — | — | ||||||||||||||||||
| Net income |
2 | 2 | 25 | 20 | (46 | ) | 3 | |||||||||||||||||
| Less: Net income attributable to noncontrolling interest, net of tax |
— | — | 1 | — | — | 1 | ||||||||||||||||||
| Net income attributable to the Company |
$ | 2 | $ | 2 | $ | 24 | $ | 20 | $ | (46 | ) | $ | 2 | |||||||||||
21
Table of Contents
Affinia Group Intermediate Holdings Inc.
Supplemental Guarantor
Consolidating Balance Sheet
December 31, 2010
| (Dollars in millions) |
Parent | Issuer | Guarantor | Non-Guarantor | Eliminations | Consolidated Total |
||||||||||||||||||
| Assets |
||||||||||||||||||||||||
| Current assets: |
||||||||||||||||||||||||
| Cash and cash equivalents |
$ | — | $ | 9 | $ | 3 | $ | 43 | $ | — | $ | 55 | ||||||||||||
| Restricted cash |
— | — | — | 12 | — | 12 | ||||||||||||||||||
| Accounts receivable |
— | — | 177 | 139 | — | 316 | ||||||||||||||||||
| Inventories |
— | — | 323 | 197 | — | 520 | ||||||||||||||||||
| Other current assets |
— | 34 | 4 | 75 | — | 113 | ||||||||||||||||||
| Total current assets |
— | 43 | 507 | 466 | — | 1,016 | ||||||||||||||||||
| Investments and other assets |
— | 254 | 38 | 64 | — | 356 | ||||||||||||||||||
| Intercompany investments |
436 | 1,209 | 345 | — | (1,990 | ) | — | |||||||||||||||||
| Intercompany receivables |
— | (349 | ) | 446 | (97 | ) | — | — | ||||||||||||||||
| Property, plant and equipment, net |
— | 3 | 90 | 124 | — | 217 | ||||||||||||||||||
| Total assets |
$ | 436 | $ | 1,160 | $ | 1,426 | $ | 557 | $ | (1,990 | ) | $ | 1,589 | |||||||||||
| Liabilities and Equity |
||||||||||||||||||||||||
| Current liabilities: |
||||||||||||||||||||||||
| Accounts payable |
$ | — | $ | 15 | $ | 149 | $ | 80 | $ | — | $ | 244 | ||||||||||||
| Notes payable |
— | — | — | 27 | — | 27 | ||||||||||||||||||
| Accrued payroll and employee benefits |
— | 10 | 7 | 16 | — | 33 | ||||||||||||||||||
| Other accrued liabilities |
— | 21 | 60 | 70 | — | 151 | ||||||||||||||||||
| Total current liabilities |
— | 46 | 216 | 193 | — | 455 | ||||||||||||||||||
| Deferred employee benefits and noncurrent liabilities |
— | 8 | — | 9 | — | 17 | ||||||||||||||||||
| Long-term debt |
— | 658 | — | 11 | — | 669 | ||||||||||||||||||
| Total liabilities |
— | 712 | 216 | 213 | — | 1,141 | ||||||||||||||||||
| Total shareholder’s equity |
436 | 448 | 1,210 | 344 | (1,990 | ) | 448 | |||||||||||||||||
| Total liabilities and equity |
$ | 436 | $ | 1,160 | $ | 1,426 | $ | 557 | $ | (1,990 | ) | $ | 1,589 | |||||||||||
22
Table of Contents
Affinia Group Intermediate Holdings Inc.
Supplemental Guarantor
Condensed Consolidating Balance Sheet
March 31, 2011
| (Dollars in millions) |
Parent | Issuer | Guarantor | Non-Guarantor | Eliminations | Consolidated Total |
||||||||||||||||||
| Assets |
||||||||||||||||||||||||
| Current assets: |
||||||||||||||||||||||||
| Cash and cash equivalents |
$ | — | $ | 11 | $ | — | $ | 44 | $ | — | $ | 55 | ||||||||||||
| Restricted cash |
— | — | — | 14 | — | 14 | ||||||||||||||||||
| Trade accounts receivable |
— | — | 195 | 150 | — | 345 | ||||||||||||||||||
| Inventories, net |
— | — | 354 | 206 | — | 560 | ||||||||||||||||||
| Other current assets |
— | 35 | 11 | 65 | — | 111 | ||||||||||||||||||
| Total current assets |
— | 46 | 560 | 479 | — | 1,085 | ||||||||||||||||||
| Investments and other assets |
— | 236 | 58 | 65 | — | 359 | ||||||||||||||||||
| Intercompany investments |
452 | 1,319 | 387 | — | (2,158 | ) | — | |||||||||||||||||
| Intercompany receivables |
— | (394 | ) | 473 | (79 | ) | — | — | ||||||||||||||||
| Property, plant and equipment, net |
— | 3 | 91 | 135 | — | 229 | ||||||||||||||||||
| Total assets |
$ | 452 | $ | 1,210 | $ | 1,569 | $ | 600 | $ | (2,158 | ) | $ | 1,673 | |||||||||||
| Liabilities and shareholder’s equity |
||||||||||||||||||||||||
| Current liabilities: |
||||||||||||||||||||||||
| Accounts payable |
$ | — | $ | 12 | $ | 169 | $ | 83 | $ | — | $ | 264 | ||||||||||||
| Notes payable |
— | — | — | 35 | — | 35 | ||||||||||||||||||
| Accrued payroll and employee benefits |
— | 11 | 13 | 18 | — | 42 | ||||||||||||||||||
| Other accrued expenses |
— | 14 | 67 | 58 | — | 139 | ||||||||||||||||||
| Total current liabilities |
— | 37 | 249 | 194 | — | 480 | ||||||||||||||||||
| Deferred employee benefits and noncurrent liabilities |
— | 10 | 1 | 10 | — | 21 | ||||||||||||||||||
| Long-term debt |
— | 698 | — | 9 | — | 707 | ||||||||||||||||||
| Total liabilities |
— | 745 | 250 | 213 | — | 1,208 | ||||||||||||||||||
| Total shareholder’s equity |
452 | 465 | 1,319 | 387 | (2,158 | ) | 465 | |||||||||||||||||
| Total liabilities and shareholder’s equity |
$ | 452 | $ | 1,210 | $ | 1,569 | $ | 600 | $ | (2,158 | ) | $ | 1,673 | |||||||||||
23
Table of Contents
Affinia Group Intermediate Holdings Inc.
Supplemental Guarantor
Condensed Consolidating Statement of Cash Flows
For the Three Months Ended March 31, 2010
| (Dollars in millions) |
Parent | Issuer | Guarantor | Non-Guarantor | Elimination | Consolidated Total |
||||||||||||||||||
| Operating activities |
||||||||||||||||||||||||
| Net cash provided by (used in) operating activities |
$ | — | $ | (23 | ) | $ | 3 | $ | (19 | ) | $ | — | $ | (39 | ) | |||||||||
| Investing activities |
||||||||||||||||||||||||
| Proceeds from the sale of affiliates |
— | 11 | — | — | — | 11 | ||||||||||||||||||
| Change in restricted cash |
— | — | — | (2 | ) | — | (2 | ) | ||||||||||||||||
| Additions to property, plant and equipment |
— | — | (2 | ) | (4 | ) | — | (6 | ) | |||||||||||||||
| Other investing activities |
— | — | (1 | ) | — | — | (1 | ) | ||||||||||||||||
| Net cash provided by (used in) investing activities |
— | 11 | (3 | ) | (6 | ) | — | 2 | ||||||||||||||||
| Financing activities |
||||||||||||||||||||||||
| Net increase in other debt |
— | — | — | 8 | — | 8 | ||||||||||||||||||
| Net proceeds from ABL Revolver |
— | 10 | — | — | — | 10 | ||||||||||||||||||
| Net cash provided by financing activities |
— | 10 | — | 8 | — | 18 | ||||||||||||||||||
| Effect of exchange rates on cash |
— | — | — | (1 | ) | — | (1 | ) | ||||||||||||||||
| Decrease in cash and cash equivalents |
— | (2 | ) | — | (18 | ) | — | (20 | ) | |||||||||||||||
| Cash and cash equivalents at beginning of the period |
— | 9 | — | 56 | — | 65 | ||||||||||||||||||
| Cash and cash equivalents at end of the period |
$ | — | $ | 7 | $ | — | $ | 38 | $ | — | $ | 45 | ||||||||||||
24
Table of Contents
Affinia Group Intermediate Holdings Inc.
Supplemental Guarantor
Condensed Consolidating Statement of Cash Flows
For the Three Months Ended March 31, 2011
| (Dollars in millions) |
Parent | Issuer | Guarantor | Non-Guarantor | Elimination | Consolidated Total |
||||||||||||||||||
| Operating activities |
||||||||||||||||||||||||
| Net cash provided by (used in) operating activities |
$ | — | $ | (38 | ) | $ | (1 | ) | $ | 8 | $ | — | $ | (31 | ) | |||||||||
| Investing activities |
||||||||||||||||||||||||
| Change in restricted cash |
— | — | — | (2 | ) | — | (2 | ) | ||||||||||||||||
| Additions to property, plant and equipment |
— | — | (4 | ) | (12 | ) | — | (16 | ) | |||||||||||||||
| Other investing activities |
— | — | 2 | — | — | 2 | ||||||||||||||||||
| Net cash used in investing activities |
— | — | (2 | ) | (14 | ) | — | (16 | ) | |||||||||||||||
| Financing activities |
||||||||||||||||||||||||
| Net increase in other short-term debt |
— | — | — | 8 | — | 8 | ||||||||||||||||||
| Payments of other debt |
— | — | — | (2 | ) | — | (2 | ) | ||||||||||||||||
| Net proceeds from ABL Revolver |
— | 40 | — | — | — | 40 | ||||||||||||||||||
| Net cash provided by financing activities |
— | 40 | — | 6 | — | 46 | ||||||||||||||||||
| Effect of exchange rates on cash |
— | — | — | 1 | — | 1 | ||||||||||||||||||
| Increase (decrease) in cash and cash equivalents |
— | 2 | (3 | ) | 1 | — | — | |||||||||||||||||
| Cash and cash equivalents at beginning of the period |
— | 9 | 3 | 43 | — | 55 | ||||||||||||||||||
| Cash and cash equivalents at end of the period |
$ | — | $ | 11 | $ | — | $ | 44 | $ | — | $ | 55 | ||||||||||||
25
Table of Contents
| Item 2. | Management’s Discussion and Analysis of Financial Condition and Results of Operations |
Company Overview
We are a global leader in the light and commercial vehicle replacement products and services industry, which also is referred to as the aftermarket. Our extensive aftermarket product offering consists principally of filtration, brake and chassis products. Our filtration products fit heavy and medium duty trucks, light vehicles, equipment in the off-highway market (i.e., construction, mining, forestry and agricultural) and equipment for industrial and marine applications. Our brake and chassis products fit light vehicles and heavy and medium duty trucks. In addition, we provide aftermarket products and distribution services in South America. We believe that the growth of the global aftermarket, from which we derived approximately 98% of our net sales in 2010, is predominantly driven by the size, age and use of the population of vehicles and equipment in operation. We design, manufacture, distribute and market a broad range of aftermarket products in North America, South America, Europe, Asia and Africa and generate sales in over 70 countries. The following charts illustrate our net sales by product grouping, together with major brands and the concentration of on and off-highway replacement product sales and original equipment manufacturers (“OEM”) sales for the year ended December 31, 2010.
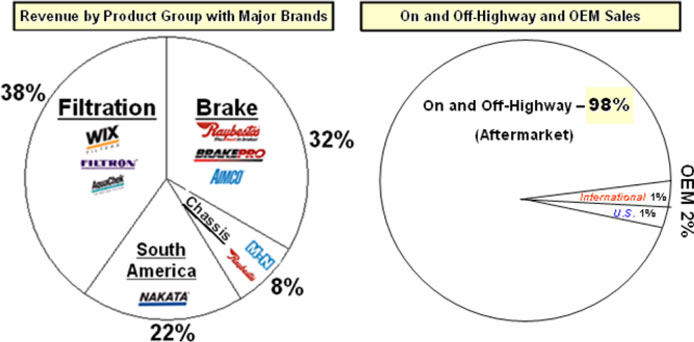
We market our products under a variety of well-known brands, including WIX®, Raybestos®, Nakata®, Brake-Pro®, Filtron™, AIMCO® and McQuay-Norris®. Additionally, we provide private label products to large aftermarket distributors, including NAPA®, CARQUEST® and ACDelco®, as well as co-branded products for Federated and ADN. We believe that we have achieved our leading market positions due to the quality and reputation of our brands and products among professional installers, who are the primary decision makers for the purchase of the products we supply to the aftermarket.
We provide our primary customers with an extensive range of services which help build customer loyalty and generate repeat business while differentiating us from our competitors. These services include detailed product catalogs, e-catalogs, technical services, electronic data interchange, direct shipments of products and point-of-sale marketing materials. The depth of our value added services has led to numerous customer awards.
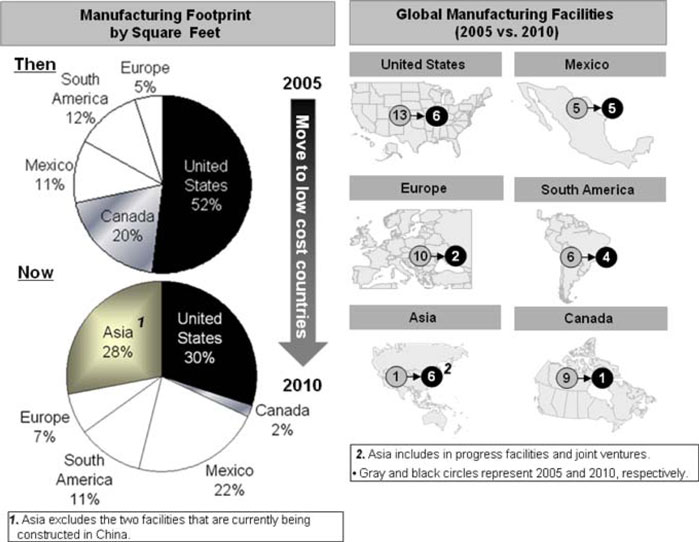
Transformation
In the last six years, the diversification of our manufacturing locations has transformed us from a domestic to a global manufacturer with a significant portion of our manufacturing base in lower labor cost countries. We have accomplished this transformation by acquiring or opening new locations in low labor cost countries and closing or selling our operations (i.e. Commercial Distribution Europe) in high labor cost countries. During the last six years, we have incurred $181 million in restructuring costs and we have closed or sold 71 facilities. We are continuing to focus on growing our business in emerging markets as we continue to diversify our global manufacturing and distribution capabilities. We intend to continue expanding our global capabilities as we pursue our objective of becoming a world class on and off-highway replacement products and services company.
26
Table of Contents
The charts below illustrate our global change in square footage and number of locations from January 1, 2005 to December 31, 2010. There were no changes to the charts in the first quarter of 2011.
The following are major transformation projects we have completed or in the process of completing:
| • | 2010 and 2011 – Our Brazilian distribution company opened one new branch in 2010, opened a new warehouse in January 2011 and plans on opening two new branches in 2011. The new branch has contributed to the growth in the Brazilian distribution company. |
| • | Fourth quarter of 2010 – We purchased the remaining 50% ownership in our India joint venture, which was formed in the fourth quarter of 2008. |
| • | Fourth quarter of 2010 – We purchased substantially all the assets of NAPD, a chassis distributor. |
| • | Fourth quarter of 2010 – We initiated filter product distribution capabilities in Russia. |
| • | Third quarter of 2010 – We formed a friction company in China, in which we have an 85% ownership interest, with the intention to manufacture products in China and distribute these products in Asia and North America. We anticipate that we will complete the manufacturing facility near the end of 2011. |
| • | First quarter of 2010 – We formed a filtration company in China, in which we have an 85% ownership interest, with the intention to manufacture products in China and distribute products principally in Asia. In the second quarter of 2010 we commenced construction of the filtration manufacturing facility. During April of 2011 the construction of the manufacturing facility was completed and we have begun testing filtration products. |
| • | Fourth quarter of 2008 – Effective October 31, 2008, we purchased an 85% controlling interest in Haimeng, one of the world’s largest drum and rotor manufacturing companies. Haimeng has over 1 million square feet of modern manufacturing and machining capacity. |
27
Table of Contents
| • | Fourth quarter of 2008 – We started production of brake products at a new facility in northern Mexico. |
| • | Third quarter of 2007 – We opened our first filter manufacturing operation in Mexico. During 2008, the manufacturing operation was brought up to its full capabilities. This operation serves markets in both North America and Central America. We are expanding our distribution capabilities at this operation to increase our sales in the Mexican market. |
| • | Second quarter of 2007 – We opened a new filter manufacturing plant in Ukraine on April 1, 2007 to help meet increased demand for filtration products in Eastern Europe. The plant became fully operational in 2009. |
Acquisitions and New Technology
On December 16, 2010, the Company, through its subsidiary Affinia Products Corp LLC, acquired substantially all the assets of NAPD, which is located in Ramsey, New Jersey. NAPD designs and engineers chassis products, which are manufactured by contractors in low labor cost countries. The NAPD acquisition expands our product offering of chassis parts to one of broadest in the industry. We acquired NAPD’s assets and liabilities for cash consideration of $52 million.
On December 3, 2010, the Company acquired the remaining 50% ownership interest in Affinia India Private Limited, the Company’s India joint venture, for $24 million in cash, increasing our ownership interest from 50% to 100%.
In January 2011, we introduced ecoLAST™ oil filters, a line of heavy duty oil filters that has been demonstrated to double oil life. WIX ecoLAST oil filters capture dirt and soot like a traditional filter, while utilizing media to sequester the acids in the oil. WIX ecoLAST oil filters are a direct replacement with no changes or modification required to the vehicle. The first ecoLAST oil filters became available in April 2011.
Critical Accounting Policies
The Company’s critical accounting policies are those related to asset impairment, inventories, revenue recognition, sales returns and rebates, estimated costs related to product warranties, pensions, income taxes, contingency reserves and restructuring expenses. These policies are more fully described in the notes to the consolidated financial statements in the Company’s Annual Report on Form 10-K for the year ended December 31, 2010.
The preparation of interim financial statements involves the use of certain estimates that are consistent with those used in the preparation of the annual financial statements.
Basis of Presentation
The On and Off-highway segment is comprised of the following operations: Filtration, Brake North America and Asia, Commercial Distribution South America, and Chassis. The Company also has two other reportable segments, which are Commercial Distribution Europe, which is classified as a discontinued operation, and Brake South America. In the Results of Operations tables below, we have identified in tabular format the revenue by product. Previously reported consolidated statements of operations for all periods presented have been adjusted to reflect the Commercial Distribution Europe segment as a discontinued operation.
28
Table of Contents
Results of Operations
Three months ended March 31, 2010 compared to the three months ended March 31, 2011
Net sales. Consolidated sales increased by $62 million in the first quarter of 2011 in comparison to the first quarter of 2010 due to improving market conditions, increased sales to new and existing customers and favorable currency translation effects. The following table summarizes the consolidated net sales results for the three months ended March 31, 2010 and the consolidated results net sales for the three months ended March 31, 2011:
| (Dollars in millions) |
Consolidated Three Months Ended March 31, 2010 |
Consolidated Three Months Ended March 31, 2011 |
Dollar Change |
Percent Change |
Currency Effect (1) |
|||||||||||||||
| Net sales |
||||||||||||||||||||
| Filtration products |
$ | 185 | $ | 196 | $ | 11 | 6 | % | $ | 2 | ||||||||||
| Brake North America and Asia products |
125 | 139 | 14 | 11 | % | 2 | ||||||||||||||
| Commercial Distribution South America products |
98 | 110 | 12 | 12 | % | 8 | ||||||||||||||
| Chassis products |
36 | 59 | 23 | 64 | % | — | ||||||||||||||
| On and Off-highway segment |
444 | 504 | 60 | 14 | % | 12 | ||||||||||||||
| Brake South America segment |
3 | 4 | 1 | 33 | % | 1 | ||||||||||||||
| Eliminations and other |
(4 | ) | (3 | ) | 1 | 25 | % | — | ||||||||||||
| Total net sales |
$ | 443 | $ | 505 | $ | 62 | 14 | % | $ | 13 | ||||||||||
| (1) | The currency effect was calculated by comparing the local currency net sales for all international locations for both periods, each at the current year exchange rate, to determine the impact of the currency between periods. These currency effects provide a more clear understanding of the operating results of our foreign entities because they exclude the varying effects that changes in foreign currency exchange rates may have on those results. |
On and Off-highway segment products sales increased due to the following:
| (1) | Filtration products sales increased in the first quarter of 2011 in comparison to the first quarter of 2010 due to increased sales in our Polish operations, favorable currency translation effects of $2 million and new business with new and existing customers. Our sales increased $9 million due mainly to our Polish, Russian and Venezuelan operations. Sales increased $5 million related to new and existing customers. |
| (2) | Brake North America and Asia products sales increased in the first quarter of 2011 in comparison to the first quarter of 2010 due to increased sales in our Chinese operations, favorable currency translation effects and the impact of price increases on certain products. Our Chinese operations increased sales by $8 million to third party customers in China and other countries in the first quarter of 2011 in comparison to the first quarter of 2010. Approximately, half of the increase in our China operations was related to the inclusion of an extra month of operations in the current quarter, which eliminates a one-month reporting lag. Our brake product material and freight costs have been increasing and as a result we have increased prices, which had a $2 million favorable impact on first quarter sales. |
| (3) | Commercial Distribution South America products sales increased in the first quarter of 2011 in comparison to the first quarter of 2010 due to favorable currency translation effects and the impact of price increases on certain products. Our Brazilian distribution company accounted for the majority of the increase in sales. |
| (4) | Chassis products sales increased in the first quarter of 2011 in comparison to the first quarter of 2010 due to new business with new customers and existing customers. During the fourth quarter, we began shipping premium Chassis products to an existing customer, which accounted for a $16 million increase in first quarter sales in 2011. We also benefited from over $5 million in additional sales related to NAPD, which we acquired during the fourth quarter of 2010. |
Brake South America segment products sales increased in the first quarter of 2011 in comparison to the first quarter of 2010 due favorable currency translation effects of $1 million.
29
Table of Contents
The following table summarizes the consolidated results for the three months ended March 31, 2010 and the consolidated results for the three months ended March 31, 2011:
| (Dollars in millions) |
Consolidated Three Months Ended March 31, 2010 |
Consolidated Three Months Ended March 31, 2011 |
Dollar Change |
Percent Change |
||||||||||||
| Net Sales |
443 | 505 | 62 | 14 | % | |||||||||||
| Cost of sales(1) |
(353 | ) | (412 | ) | (59 | ) | 17 | % | ||||||||
| Gross profit |
90 | 93 | 3 | 3 | % | |||||||||||
| Gross margin |
20 | % | 18 | % | ||||||||||||
| Selling, general and administrative expenses(2) |
(67 | ) | (71 | ) | (4 | ) | 6 | % | ||||||||
| Selling, general and administrative expenses as a percent of sales |
15 | % | 14 | % | ||||||||||||
| Operating profit (loss) |
||||||||||||||||
| On and Off-highway segment |
32 | 33 | 1 | 3 | % | |||||||||||
| Brake South America segment |
(1 | ) | (1 | ) | — | NM | ||||||||||
| Corporate, eliminations and other |
(8 | ) | (10 | ) | (2 | ) | -25 | % | ||||||||
| Operating profit |
23 | 22 | (1 | ) | -4 | % | ||||||||||
| Operating margin |
5 | % | 4 | % | ||||||||||||
| Other income, net |
1 | (1 | ) | (2 | ) | NM | ||||||||||
| Interest expense |
(16 | ) | (17 | ) | (1 | ) | 6 | % | ||||||||
| Income from continuing operations, before income tax provision, equity in income and noncontrolling interest |
8 | 4 | (4 | ) | -50 | % | ||||||||||
| Income tax provision |
(2 | ) | (1 | ) | 1 | -50 | % | |||||||||
| Net income from continuing operations |
6 | 3 | (3 | ) | -50 | % | ||||||||||
| Income from discontinued operations, net of tax |
2 | — | (2 | ) | NM | |||||||||||
| Net income |
8 | 3 | (5 | ) | -63 | % | ||||||||||
| Less: net income attributable to noncontrolling interest, net of tax |
2 | 1 | (1 | ) | NM | |||||||||||
| Net income attributable to the Company |
$ | 6 | $ | 2 | (4 | ) | -67 | % | ||||||||
| (1) | We recorded $1 million of restructuring costs in cost of sales in the first quarter of 2010. |
| (2) | We recorded $3 million and $2 million of restructuring costs in selling, general and administrative expenses for the first quarter of 2010 and 2011, respectively. |
| NM | (Not Meaningful) |
Gross profit/Gross margin. Gross profit increased by $3 million during the first quarter of 2011 in comparison to the first quarter of 2010. Gross margin decreased in the first quarter of 2011 to 18% from 20% in the first quarter of 2010. The decrease in gross margin related to an increase in our freight and operating costs during the first quarter of 2011 in comparison to the first quarter of 2010. Historically, we have been able to mitigate the material and operating cost increases with selling price increases but it usually takes several months or more to fully mitigate the material and operating cost increases.
Selling, general and administrative expenses. Our selling, general and administrative expenses for the first quarter of 2011 increased $4 million from the first quarter of 2010 due mainly to higher sales. Our advertising expenses increased $3 million and our legal and professional fees increased $1 million during the first quarter of 2011 in comparison to the first quarter of 2010.
30
Table of Contents
Operating profit/Operating margin. Operating profit decreased by $1 million in the first quarter of 2011 in comparison to the first quarter of 2010. The operating margin decreased from 5% in the first quarter of 2010 to 4% in the first quarter of 2011. Although our sales increased in the first quarter, the operating profit decreased mainly due to a lower gross margin.
Interest expense. Interest expense increased by $1 million in the first quarter of 2011 in comparison to the first quarter of 2010.
Income tax provision. The income tax provision was $1 million and $2 million for the first quarter of 2011 and 2010, respectively. The effective tax rate was similar for both 2011 and 2010.
Net income. Net income decreased in 2011 in comparison to 2010 due mainly to a lower gross margin.
Results by Geographic Region
Net sales by geographic region were as follows:
| (Dollars in millions) |
Three Months Ended March 31, 2010 |
Three Months Ended March 31, 2011 |
||||||
| Net sales |
||||||||
| United States |
$ | 260 | $ | 287 | ||||
| Foreign |
183 | 218 | ||||||
| Total net sales |
$ | 443 | $ | 505 | ||||
United States. Net sales increased in the first quarter of 2011 in comparison to first quarter of 2010 due to improving market conditions and increased sales to new customers and existing customers. The majority of our increased sales to new and existing customers in the United States were in our Chassis products.
Foreign. Net sales increased in the first quarter of 2011 in comparison to the first quarter of 2010 due to improving market conditions, increased sales to new and existing customers and favorable currency translation effects. Our sales increased by $16 million in South America, $8 million in Asia, $6 million in Europe and $5 million in Canada and Mexico.
Income from continuing operations before income tax provision, equity in income and noncontrolling interest by geographic region was as follows:
| (Dollars in millions) |
Three Months Ended March 31, 2010 |
Three Months Ended March 31, 2011 |
||||||
| Income (loss) from continuing operations before income tax provision, equity in income and noncontrolling interest |
||||||||
| United States |
$ | (9 | ) | $ | (23 | ) | ||
| Foreign |
17 | 27 | ||||||
| Total Income from continuing operations before income tax provision, equity in income and noncontrolling interest |
$ | 8 | $ | 4 | ||||
United States. Loss from continuing operations before income tax provision, equity in income and noncontrolling interest increased in the first quarter of 2011 in comparison to first quarter of 2010 due to an increase in our freight, operating costs, and advertising expenses.
The United States income from continuing operations is lower than the foreign income from continuing operations due to the higher profitability of some of our subsidiaries in foreign locations. The majority of our debt relates to our United States operations and as a consequence almost all of the associated interest expense is allocated to our domestic operations. During 2011, our United States operations had $16 million of interest expense and our foreign operations had $1 million of interest expense. Some of our foreign operations, such as our Polish and Brazilian subsidiaries, have experienced significant growth and as a result their profitability has also increased.
Foreign. Income from continuing operations before income tax provision, equity in income and noncontrolling interest increased in the first quarter of 2011 in comparison to the first quarter of 2010. The majority of the increase is due to an improvement in gross profit, which was driven by an increase in sales volume and favorable currency translation effects. Foreign sales increased by 19% in the first quarter of 2011 in comparison to the first quarter of 2010.
31
Table of Contents
Liquidity and Capital Resources
The Company’s primary source of liquidity is cash flow from operations and available borrowings from our ABL Revolver. Our primary liquidity requirements are significant and are expected to be primarily for debt servicing, working capital, restructuring obligations and capital spending.
We are significantly leveraged as a result of the Acquisition in 2004, the refinancing that occurred in 2009 and the issuance of Additional Notes in 2010. As of March 31, 2011, the Company had $742 million in aggregate indebtedness. As of March 31, 2011, we had an additional $154 million of borrowing capacity available under our ABL Revolver after giving effect to $15 million in outstanding letters of credit, none of which was drawn against, and $3 million for borrowing base reserves. In addition, we had cash and cash equivalents of $55 million as of December 31, 2010 and March 31, 2011, respectively.
We spent $6 million and $16 million in capital expenditures during the first three months of 2010 and 2011, respectively. The cash flow from operations on an annual basis has historically been adequate to meet our liquidity needs. However, during the first half of the year, cash flows from operations are typically not sufficient to meet our liquidity needs, and we therefore utilize our ABL Revolver to bridge our financing needs until the second half of the year. Based on the current level of operations, we believe that cash flow from operations and available cash, together with available borrowings under our ABL Revolver, will be adequate to meet our short term and long term liquidity needs.
Our ABL Revolver matures in November 2015, our Subordinated Notes mature in November 2014 and our Secured Notes mature in 2016. Refinancing our ABL Revolver, our Subordinated Notes and our Secured Notes will require significant additional sources of liquidity over the long term. Furthermore, if we were to undertake a significant acquisition or capital improvement plan, we may need additional sources of liquidity. We expect to meet such liquidity needs by entering into new or additional credit facilities and/or offering new or additional debt securities, but whether such sources of liquidity will be available to us at any given point in the future will depend on a number of factors that are outside of our control, including general market conditions.
Asset Based Credit Facilities
Overview. Affinia Group Intermediate Holdings Inc., Affinia Group Inc. and certain of its subsidiaries entered into a four-year $315 million ABL Revolver maturing in 2015 (subject to early termination under certain limited circumstances). There was $130 million outstanding on the ABL Revolver at March 31, 2011. The ABL Revolver includes (i) a revolving credit facility of up to $295 million for borrowings solely to the U.S. domestic borrowers (the “U.S. Facility”), including (a) a $40 million sub-limit for letters of credit and (b) a $30 million swingline facility and (ii) a revolving credit facility of up to $20 million for Canadian Dollar denominated revolving loans solely to a Canadian borrower (the “Canadian Facility”). Availability under the ABL Revolver is based upon monthly (or more frequent under certain circumstances) borrowing base valuations of Affinia Group Inc.’s eligible inventory and accounts receivable and is reduced by certain reserves in effect from time to time.
Guarantees and Collateral. The indebtedness, obligations and liabilities under the U.S. Facility are unconditionally guaranteed jointly and severally on a senior secured basis by Affinia Group Intermediate Holdings Inc. and certain of its current and future U.S. subsidiaries, and are secured by a first-priority lien on accounts receivable, inventory, cash, deposit accounts, securities accounts and proceeds of the foregoing and certain assets related thereto and a second-priority lien on the collateral securing the Secured Notes on a first-priority basis (collectively, the “U.S. Collateral”).
The indebtedness, obligations and liabilities under the Canadian Facility are unconditionally guaranteed jointly and severally on a senior secured basis by Affinia Group Intermediate Holdings Inc., certain of its current and future U.S. subsidiaries and certain of its Canadian subsidiaries and are also secured by the U.S. Collateral and by a first-priority lien on substantially all of the Canadian borrower’s and the Canadian guarantors’ existing and future assets, including, but not limited to, accounts receivable and inventory (but excluding owned real property and the capital stock of any non-U.S. and non-Canadian subsidiaries of the Canadian borrower or the Canadian guarantors).
Mandatory Prepayments. If at any time the outstanding borrowings under the ABL Revolver (including outstanding letters of credit and swingline loans) exceed the lesser of (i) the borrowing base as in effect at such time and (ii) the aggregate revolving commitments as in effect at such time, the borrowers will be required to prepay an amount equal to such excess and/or cash collateralize outstanding letters of credit.
Voluntary Prepayments. Subject to certain conditions, the ABL Revolver allows the borrowers to voluntarily reduce the amount of the revolving commitments and to prepay the loans without premium or penalty other than customary breakage costs for LIBOR rate contracts.
32
Table of Contents
Covenants. The ABL Revolver contains certain covenants that, among other things, limit or restrict the ability of Affinia Group Intermediate Holdings Inc. and its subsidiaries to (subject to certain qualifications and exceptions):
| • | create liens and encumbrances; |
| • | incur additional indebtedness; |
| • | merge, dissolve, liquidate or consolidate; |
| • | make acquisitions and investments; |
| • | dispose of or transfer assets; |
| • | pay dividends or make other payments in respect of the borrowers’ capital stock; |
| • | amend certain material governance documents; |
| • | change the nature of the borrowers’ business; |
| • | make any advances, investments or loans; |
| • | engage in certain transactions with affiliates; |
| • | issue or dispose of equity interests; |
| • | change the borrowers’ fiscal periods; and |
| • | restrict dividends, distributions or other payments from Affinia Group Intermediate Holdings Inc.’s subsidiaries. |
In addition, commencing on the day that an event of default occurs or availability under the ABL Revolver is less than the greater of (i) 12.5% of the total revolving loan commitments and (ii) $39.5 million, Affinia Group Intermediate Holdings Inc. is required to maintain a fixed charge coverage ratio of at least 1.10x measured for the last 12-month period.
Interest Rates and Fees. Outstanding borrowings under the U.S. Facility will accrue interest at an annual rate of interest equal to (i) a base rate plus the applicable spread or (ii) a LIBOR rate plus the applicable spread. Swingline loans will bear interest at a base rate plus the applicable spread. Outstanding borrowings under the Canadian Facility will accrue interest at an annual rate of interest equal to (i) the Canadian prime rate plus the applicable spread or (ii) the BA rate (the average discount rate of bankers’ acceptances as quoted on the Reuters Screen CDOR page) plus the applicable spread. We will pay a commission on letters of credit issued under the U.S. Facility at a rate equal to the applicable spread for loans based upon the LIBOR rate.
The borrowers will pay certain fees with respect to the ABL Revolver, including (i) an unused commitment fee of 0.50% per annum on the undrawn portion of the credit facility (subject to a step-down to 0.375% in the event more than 50% of the commitments (excluding swingline loans) under the credit facility are utilized) and (ii) customary annual administration fees and fronting fees in respect of letters of credit equal to 0.125% per annum on the stated amount of each letter of credit outstanding during each month. During an event of default, the fee payable under clause (i) will be increased by 2% per annum.
Cash Dominion. If availability under the ABL Revolver is less than the greater of (i) 15% of the total revolving loan commitments and (ii) $47.5 million, or if there exists an event of default, amounts in Affinia Group Intermediate Holdings Inc.’s deposit accounts and the deposit accounts of the subsidiary guarantors (other than certain excluded accounts) will be transferred daily into a blocked account held by the administrative agent and applied to reduce the outstanding amounts under the ABL Revolver.
Senior Notes
Overview. In November 2004, Affinia Group Inc. issued $300 million aggregate principal amount of the Subordinated Notes, which bear interest at a rate of 9% and mature on November 30, 2014, pursuant to an indenture dated as of November 30, 2004 (the “senior subordinated indenture”). On December 9, 2010, Affinia Group Inc. issued $100 million of Additional Notes. In connection with our refinancing in August 2009, Affinia Group Inc. issued $225 million aggregate principal amount of the Secured Notes (together with the Subordinated Notes, the “Senior Notes”), which bear interest at a rate of 10.75% and mature on August 15, 2016, pursuant to an indenture dated as of August 13, 2009 (the “senior secured indenture” and, together with the senior subordinated indenture, the “senior indentures”). On December 31, 2010, Affinia Group Inc. redeemed $22.5 million aggregate principal amount of the Secured Notes pursuant to their terms at a redemption price equal to 103% of the principal amount of such notes being redeemed, plus accrued and unpaid interest to the redemption date. As of March 31, 2011, $367 million principal amount of the Subordinated Notes was outstanding and $200 million principal amount of the Secured Notes was outstanding, net of a $2 million issue discount which is being amortized until the Secured Notes mature.
Guarantees and Collateral. The Subordinated Notes are unconditionally guaranteed jointly and severally on a senior subordinated basis by substantially all of our wholly-owned domestic subsidiaries. The Secured Notes are unconditionally guaranteed jointly and severally on a senior secured basis by substantially all of our wholly-owned domestic subsidiaries.
33
Table of Contents
The Secured Notes and the related guarantees are secured on a first-priority lien basis by substantially all of the assets (other than accounts receivable, inventory, cash, deposit accounts, securities accounts and proceeds of the foregoing and certain assets related thereto) of Affinia Group Inc. and the guarantors and on a second-priority lien basis by the accounts receivable, inventory, cash, deposit accounts, securities accounts and proceeds of the foregoing and certain assets related thereto of Affinia Group Inc. and the guarantors.
Interest Payments. Interest on the Subordinated Notes is payable on May 30 and November 30 of each year and interest on the Secured Notes is payable on February 15 and August 15 of each year.
Optional Redemption. We may redeem some or all of the Senior Notes at any time at redemption prices described or set forth in the applicable senior indenture.
Change of Control. Upon the occurrence of certain change of control events specified in the applicable senior indenture, each holder of the Subordinated Notes or Secured Notes has the right to require us to repurchase such holder’s Subordinated Notes or Secured Notes, as applicable, at a purchase price in cash equal to 101% of the principal amount thereof, plus accrued and unpaid interest to the repurchase date.
Covenants. The senior indentures contain certain covenants that, among other things, limit or restrict the ability of Affinia Group Inc. and its restricted subsidiaries to (subject to certain qualifications and exceptions):
| • | incur and guarantee additional indebtedness, issue disqualified stock or issue certain preferred stock; |
| • | pay dividends, make other distributions on, redeem or repurchase stock or make certain other restricted payments; |
| • | create certain liens or encumbrances; |
| • | sell assets; |
| • | issue capital stock; |
| • | make certain investments or acquisitions; |
| • | make capital expenditures; |
| • | restrict dividends, distributions or other payments from our subsidiaries; |
| • | change their line of business; |
| • | enter into transactions with affiliates; |
| • | consolidate, merge, sell or otherwise dispose of all or substantially all of their assets; and |
| • | designate subsidiaries as unrestricted subsidiaries. |
34
Table of Contents
Cash Flows
Net cash used in operating activities
Net cash used in operating activities for the three months ended March 31, 2010 and 2011 was $39 million and $31 million, respectively. The following table summarizes significant changes in our operating activities:
| (Dollars in millions) |
Three Months Ended March 31, 2010 |
Three Months Ended March 31, 2011 |
||||||
| Net income |
$ | 8 | $ | 3 | ||||
| Change in trade accounts receivable |
(48 | ) | (27 | ) | ||||
| Change in inventories |
(21 | ) | (34 | ) | ||||
| Change in other current operating liabilities |
11 | 14 | ||||||
| Subtotal |
(50 | ) | (44 | ) | ||||
| Other changes in operating activities |
11 | 13 | ||||||
| Net cash used in operating activities |
$ | (39 | ) | $ | (31 | ) | ||
Change in trade accounts receivable – The change in trade accounts receivable was a $48 million and $27 million use of cash in the first three months of 2010 and 2011, respectively. The change in trade accounts receivable was due to timing of payments.
Inventories – The change in inventories was a $21 million and a $34 million use of cash in the first three months of 2010 and the first three months of 2011. In the first quarter of 2011, we built up inventory to keep up with increased demand, which was due to improved market conditions in the aftermarket industry, new business with new customers and additional business with existing customers.
Change in other current operating liabilities – The change in other current operating liabilities was an $11 million and a $14 million source of cash during the first quarter of 2010 and 2011, respectively. The change was primarily due to a decrease in accounts payable, which was a $22 million and a $19 million source of cash in the first quarter of 2010 and 2011, respectively. Accounts payable fluctuates from quarter to quarter due to the timing of payments.
Net cash provided by (used in) investing activities
Net cash provided by (used in) investing activities for the first three months of 2010 and 2011 was a source of cash of $2 million and a use of cash of $16 million, respectively. The following table summarizes significant changes in our investing activities:
| (Dollars in millions) |
Three Months Ended March 31, 2010 |
Three Months Ended March 31, 2011 |
||||||
| Proceeds from the sale of affiliates |
$ | 11 | $ | — | ||||
| Change in restricted cash |
(2 | ) | (2 | ) | ||||
| Additions to property, plant and equipment |
(6 | ) | (16 | ) | ||||
| Other investing activities |
(1 | ) | 2 | |||||
| Net cash provided by (used in) investing activities |
$ | 2 | $ | (16 | ) | |||
Proceeds from the sale of affiliates – On February 2, 2010, we sold our Commercial Distribution Europe business unit for approximately $12 million reduced by post-closing purchase price adjustments of $1 million.
Additions to property, plant and equipment – The additions increased significantly in 2011 due to the expansion in China for new friction and filtration facilities. The total additions to property, plant and equipment in China increased $8 million in the first quarter of 2011 in comparison to the first quarter of 2010.
Net cash provided by financing activities
Net cash provided by financing activities for the first three months of 2010 and 2011 was a source of cash of $18 million and $46 million, respectively. During the first quarter of 2011 we borrowed $40 million on our ABL Revolver compared to $10 million in the first quarter of 2010. The additional borrowings in 2011 were needed to fund the additional operational needs related to increased levels of capital spending and higher levels of working capital.
35
Table of Contents
| Item 3. | Quantitative and Qualitative Disclosures About Market Risk |
We are exposed to various market risks, such as currency exchange and interest rate fluctuation. Where necessary to minimize such risks we may enter into financial derivative transactions, however we do not enter into derivatives or other financial instruments for trading or speculative purposes.
Currency risk
We conduct business throughout the world. Although we manage our businesses in such a way as to reduce a portion of the risks associated with operating internationally, changes in currency exchange rates may adversely impact our results of operations and financial position.
The results of operations and financial position of each of our operations are measured in their respective local (functional) currency. Business transactions denominated in currencies other than an operation’s functional currency produce foreign exchange gains and losses, as a result of the re-measurement process, as described in ASC Topic 830, “Foreign Currency Matters.” To the extent that our business activities create monetary assets or liabilities denominated in a non-local currency, changes in an entity’s functional currency exchange rate versus each currency in which an entity transacts business have a varying impact on an entity’s results of operations and financial position, as reported in functional currency terms. Therefore, for entities that transact business in multiple currencies, we seek to minimize the net amount of cash flows and balances denominated in non-local currencies. However, in the normal course of conducting international business, some amount of non-local currency exposure will exist. Therefore, management monitors these exposures and may engage in business activities or execute financial hedge transactions intended to mitigate the potential financial impact due to changes in the respective exchange rates.
Our consolidated results of operations and financial position, as reported in U.S. Dollars, are also affected by changes in currency exchange rates. The results of operations of non-U.S. Dollar functional entities are translated into U.S. Dollars for consolidated reporting purposes each period at the average currency exchange rate experienced during the period. To the extent that the U.S. Dollar may appreciate or depreciate over time, the contribution of non-U.S. Dollar denominated results of operations to our U.S. Dollar reported consolidated earnings will vary accordingly. Therefore, changes in the various local currency exchange rates, as applied to the revenue and expenses of our non-U.S. Dollar operations may have a significant impact on our sales and, to a lesser extent, consolidated net income trends. In addition, a significant portion of our consolidated financial position is maintained at foreign locations and is denominated in functional currencies other than the U.S. Dollar. The non-U.S. Dollar denominated monetary assets and liabilities are translated into U.S. Dollars at each respective currency’s exchange rate then in effect at the end of each reporting period. The financial impact of the translation process is reflected within the other comprehensive income component of shareholder’s equity. Accordingly, the amounts shown in our consolidated shareholder’s equity account will fluctuate depending upon the cumulative appreciation or depreciation of the U.S. Dollar versus each of the respective functional currencies in which we conduct business. Management seeks to lessen the potential financial impact upon the our consolidated results of operations due to exchange rate changes by engaging in business activities or by executing financial derivative transactions intended to mitigate specific transactional underlying currency exposures. We do not engage in activities solely intended to counteract the impact that changes in currency exchange rates may have upon our U.S. Dollar reported statement of financial condition nor do we engage in currency transactions for speculative purposes.
Our foreign currency exchange rate risk management efforts primarily focus upon operationally managing the net amount of non-functional currency denominated monetary assets and liabilities. In addition, we routinely execute short-term currency exchange rate forward contracts intended to mitigate the earnings impact related to the re-measurement process. At March 31, 2011, we had currency exchange rate derivatives with an aggregate notional value of $113 million and fair values of $1 million in assets and less than $1 million in liabilities.
Interest rate risk
We are exposed to the risk of rising interest rates to the extent that we fund operations with short-term or variable-rate borrowings. At March 31, 2011, the Company’s $742 million of aggregate debt outstanding consisted of $150 million of floating-rate debt and $592 million of fixed-rate debt.
Pursuant to our written interest rate risk management policy we actively monitor and manage our fixed versus floating rate debt composition within a specified range. At quarter-end, fixed rate debt comprised approximately 80% of our total debt. Based on the amount of floating-rate debt outstanding at March 31, 2011, a 1% rise in interest rates would result in approximately $1.5 million in incremental interest expense.
36
Table of Contents
Commodity Price Risk Management
We are exposed to adverse price movements or surcharges related to commodities that are used in the normal course of business operations. Management actively seeks to negotiate contractual terms with our customers and suppliers to limit the potential financial impact related to these exposures.
| Item 4. | Controls and Procedures |
We maintain disclosure controls and procedures that are designed to ensure that information required to be disclosed in our reports under the Exchange Act is recorded, processed, summarized and reported within the time periods specified in the Securities and Exchange Commission’s rules and forms, and that such information is accumulated and communicated to our management, including our principal executive officer and principal financial officer, as appropriate, to allow timely decisions regarding required disclosures. Any controls and procedures, no matter how well designed and operated, can provide only reasonable assurance of achieving the desired control objectives. Under the supervision and with the participation of our management, including our principal executive officer and principal financial officer, we conducted an evaluation of our disclosure controls and procedures, as such term is defined under Rule 13a-15(e) promulgated under the Exchange Act. Based on this evaluation, our principal executive officer and our principal financial officer concluded that our disclosure controls and procedures were effective at the reasonable assurance level as of the quarter ended March 31, 2011.
During the quarter ended March 31, 2011, there were no changes in our internal control over financial reporting (as such term is defined in Rules 13a-15(f) and 15d-15(f) under the Exchange Act) that have materially affected, or are reasonably likely to materially affect, our internal control over financial reporting.
OTHER INFORMATION
| Item 1. | Legal Proceedings |
On March 31, 2008, a class action lawsuit was filed by S&E Quick Lube Distributors, Inc. of Utah against several auto parts manufacturers for allegedly conspiring to fix prices for replacement oil, air, fuel and transmission filters. Several auto parts companies are named as defendants, including Champion Laboratories, Inc., Purolator Filters NA LLC, Honeywell International Inc., Cummins Filtration Inc., Donaldson Company, Baldwin Filters Inc., Bosch USA., Mann + Hummel USA Inc., ArvinMeritor Inc., United Components Inc. and Wix Filtration Corp LLC (“Wix Filtration”), one of our subsidiaries. The lawsuit is currently pending as a consolidated Multi-District Litigation (“MDL”) Proceeding in Chicago, IL because of multiple “tag-along” filings in several jurisdictions. Two suits have also been filed in the Canadian provinces of Ontario and Quebec. Wix Filtration, along with other named defendants, have filed various motions to dismiss plaintiffs’ complaints, which were denied by the court in December 2009. Several defendants, including Wix Filtration, refiled motions to dismiss based upon plaintiff’s most recent amended complaint. The court denied those motions in September 2010. Discovery in the action continues. Significantly, the deposition of plaintiffs’ main witness occurred in December 2010 and did not implicate Wix in any overt acts of price fixing. The U.S. Department of Justice moved to intervene and stay the proceedings for 3 months while they complete their grand jury investigation. The motion was granted by the Court and a 90 day stay is currently in place. We believe that Wix Filtration did not engage in any improper conduct and in any event did not have significant sales in this particular market at the relevant time periods so we do not expect the lawsuit to have a material adverse effect on our financial condition or results of operations. We intend to vigorously defend this matter.
| Item 1A. | Risk Factors |
In addition to the other information set forth in this report, you should carefully consider the factors discussed in Part I, “Item 1A. Risk Factors” in our Annual Report on Form 10-K for the year ended December 31, 2010, which could materially affect our business, financial condition or future results. The risks described in our Annual Report on Form 10-K are not the only risks facing our Company. Additional risks and uncertainties not currently known to us or that we currently deem to be immaterial also may materially adversely affect our business, financial condition and/or operating results.
| Item 6. | Exhibits |
| (a) | Exhibits |
| 18.1 | Preferability letter from DELOITTE & TOUCHE LLP | |
| 31.1 | Certification of President and Chief Executive Officer pursuant to Rule 13a-14(a) of the Securities and Exchange Act, as amended. | |
| 31.2 | Certification of Senior Vice President and Chief Financial Officer pursuant to Rule 13a-14(a) of the Securities and Exchange Act, as amended. | |
| 32.1 | Certifications of Executive Officers pursuant to 18 U.S.C. Section 1350(b) | |
37
Table of Contents
Pursuant to the requirements of the Securities and Exchange Act of 1934, the registrant has duly caused this report to be signed on its behalf by the undersigned thereunto duly authorized.
| AFFINIA GROUP INTERMEDIATE HOLDINGS INC. | ||
| By: |
/s/ Terry R. McCormack | |
| Terry R. McCormack | ||
| Chief Executive Officer, President, and Director (Principal Executive Officer) | ||
| By: |
/s/ Thomas H. Madden | |
| Thomas H. Madden Senior Vice President and Chief Financial Officer (Principal Financial Officer) | ||
Date: May 6, 2011
38