Attached files
| file | filename |
|---|---|
| 8-K - FORM 8-K - SVB FINANCIAL GROUP | d8k.htm |
 RBC Capital
Markets 2011 Financial Institutions Conference
May 5, 2011
Exhibit 99.1 |
| The presentations
made at today’s meeting contain projections or other forward- looking statements
regarding management’s expectations about the future events or the future financial
performance of the Company, as well as future economic, market and tax conditions.
Forward-looking statements are
statements that are not historical facts.
We wish to caution you that such
statements are just predictions and actual events or results may
differ materially,
due to changes in economic, business and regulatory factors and trends.
We refer you to the documents the Company files from time to time with the
Securities and Exchange Commission, specifically the company’s latest Annual
Report on Form 10-K for the year ended December 31, 2010, which was filed on
February 25, 2011.
This document contains and identifies important risk factors
that could cause the Company’s actual results to differ materially from those
contained in our projections or other forward-looking statements.
All subsequent
written or oral forward-looking statements attributable to the company or
persons acting on its behalf are expressly qualified in their entirety by these
cautionary statements. All forward-looking statements included in this
presentation are made only as of today’s date and the Company undertakes no
obligation to update such forward-looking statements.
Safe Harbor Disclosure
2 |
 SVB’s
Unique Model Strong Performance
Growth Initiatives
Outlook for 2011
Appendix
Overview
3 Overview |
 A Unique
Financial Services Company Differentiated business model
•
Focus on “innovation”
markets
•
Balance sheet lender
•
Low cost funds from highly liquid clients
•
Diversified revenue streams
Leader
•
Leading market share
•
More than 550 venture firm clients
•
The bank for high-growth innovation companies
Established
(1)
•
26 U.S. and seven international offices
•
12,000+ clients and 1,350+ employees
•
$32.4 billion in total client funds
(2)
•
$18.6 billion in total assets
1) At 3/31/11
2) Total Client Funds includes deposits and off-balance sheet client investment
funds. 4 SVB’s Unique Model
|
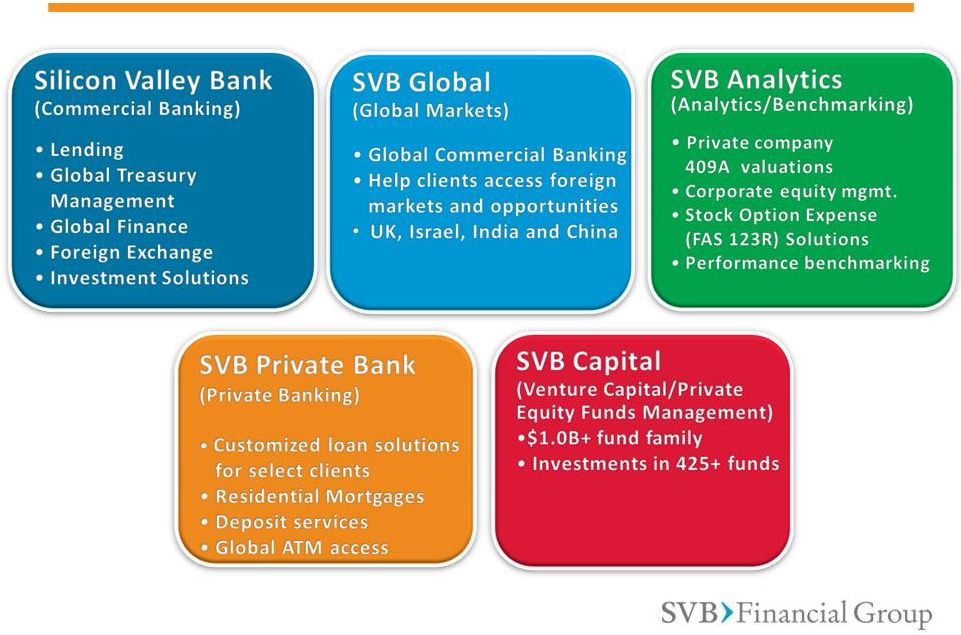 Complete
Financial Services Platform 5 SVB’s
Unique Model |
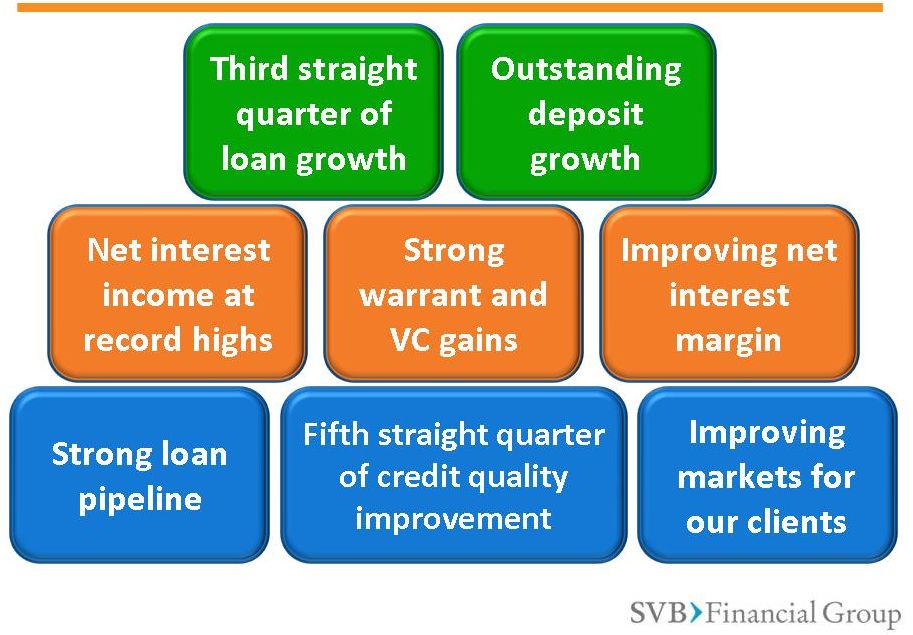
 Strong Organic
Growth in Q111 6
6
Strong Performance
* Sequential |
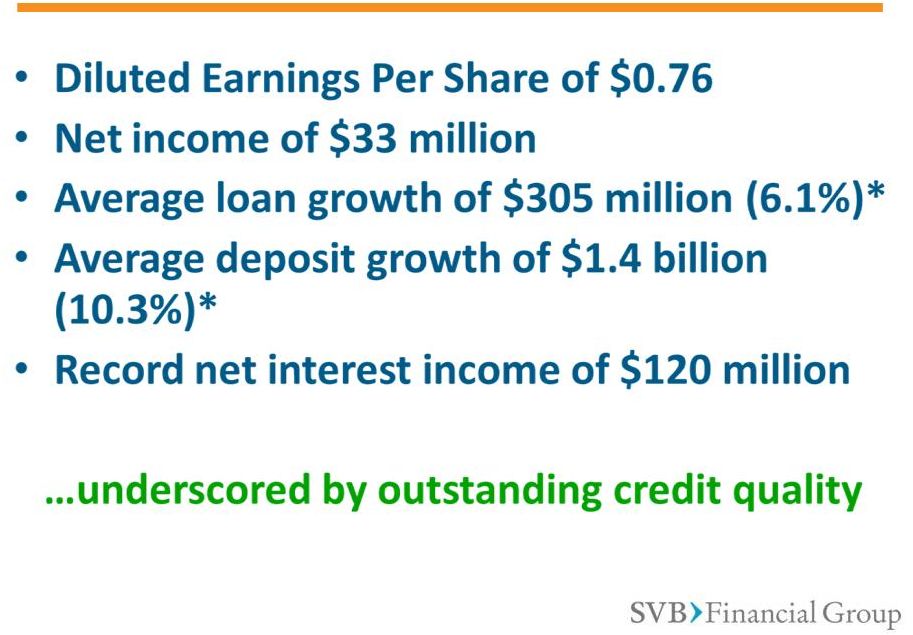
 Solid
Performance 7
Strong Performance |
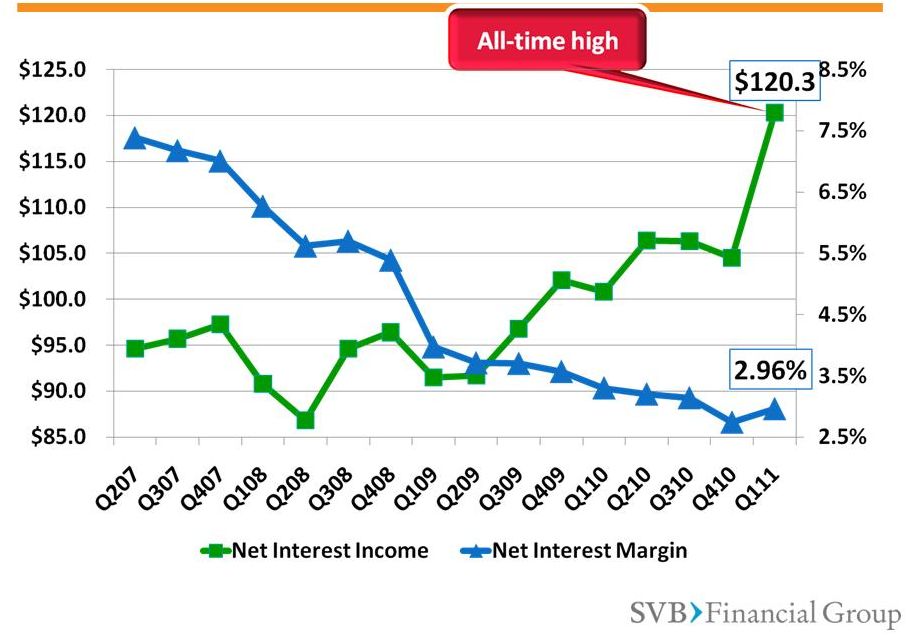 Net Interest
Income Remains Strong 8
Millions
8
Strong Performance
NIM |
 A Growing Balance
Sheet DRIVERS
•
New client acquisition
•
High client liquidity
•
Low interest rate environment
WE REMAIN FOCUSED ON MANAGING OUR
BALANCE SHEET
•
New client investment products
•
Tender for debt repurchase
•
Strong asset sensitivity
9
9
Strong Performance |
 Our Growth
Initiatives 10
UK Branch
Application
India Branch
Application
China JV
Application
Israel Office
Correspondent
Banking
Network
Debit & Credit
Cards
New Products &
Services
Custom Credit
Products &
Programs
GLOBAL MARKETS & REACH
Global Core
Banking System
IT Backbone
Upgrade
Global Payment
Systems
Enhanced On-
line/Mobile
Systems
GLOBAL PLATFORM
PRODUCT LINES
Front-Line
Sales Staff
Private
Bank
Client
Segmentation
Client
Experience
CLIENT NEEDS
10
Growth Initiatives |
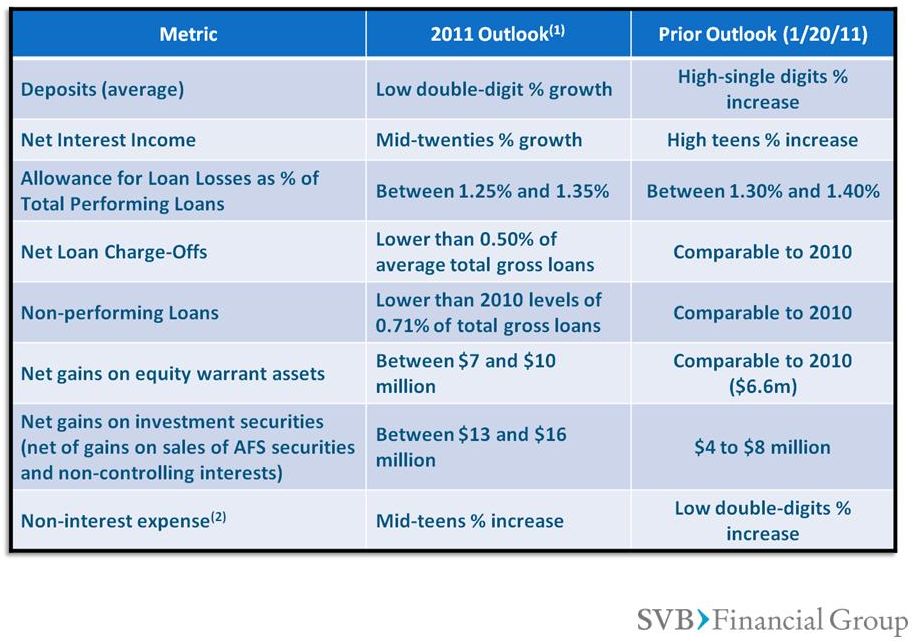 Our 2011 Outlook
Has Improved 1) See latest quarterly press release for more information
2) Excluding expenses related to non-controlling interests. Non-GAAP number.
Please see non-GAAP disclosures at end of presentation and our most recent financial
releases for more information 11
Outlook for 2011 |
 Solid Momentum
For Growth in 2011 •
An improving business environment
•
Growing client revenues due to increasing
technology spending
•
Improving venture-backed exit markets
•
Beginning to see results from growth
initiatives
12
12
Outlook for 2011 |
 |
 Appendix
1)
First Quarter Review
•
Highlights
16
•
Loans & Credit Quality
17-20
•
Assets and Client Liquidity
21-22
•
Balance Sheet
23
•
Sensitivity Charts
24-25
•
Capital Ratios
26
•
2011 Outlook
27
2)
Annual Metrics
28-29
3)
Growth Initiatives
30-33
4)
Venture Capital Markets
34-35
6)
Non-GAAP Reconciliations
36-40 |
 First Quarter
Review 15
Appendix –
First Quarter Review |
 Quarterly
Financial Highlights Q111
Q410
Q310
Q210
Q110
Diluted Earnings Per Share
$0.76
$0.41
$0.89
(1)
$0.50
$0.44
Net Income Available to
Common Stockholders
$33.0M
$17.5M
$37.8M
(1)
$21.1M
$18.6M
Average Loans (Change)
$5.3B
(+6.1%)
$5.0B
(+11.3%)
$4.5B
(+9.4%)
$4.1B
(-0.1%)
$4.1B
(-5.8%)
Average Deposits/ (Change)
$14.7B
(+10.3%)
$13.3B
(+11.6%)
$11.9B
(+0.1%)
$11.9B
(+8.6%)
$11.0B
(+11.0%)
Net Interest Margin
2.96%
2.74%
3.14%
3.20%
3.30%
Net Interest Income
$120.3M
$104.5M
$106.3M
$106.4M
$100.8M
Non-Interest Income
$90.0M
$71.9M
$86.2M
(1)
$40.2M
$49.3M
Net (Recoveries) Charge-
Offs/Total Average Gross
Loans
(0.19%)
(2)
0.57%
0.73%
0.38%
1.46%
Non-Interest Expense
$117.4M
$115.9M
$104.2M
$104.2M
$98.6M
1)
Includes $23.6 million in pre-tax gains from sale of AFS securities
2)
Represents net recovery of $2.5 million
16
Appendix –
First Quarter Review |
 Loans Are At an
All-Time High 17
17
Appendix –
First Quarter Review |
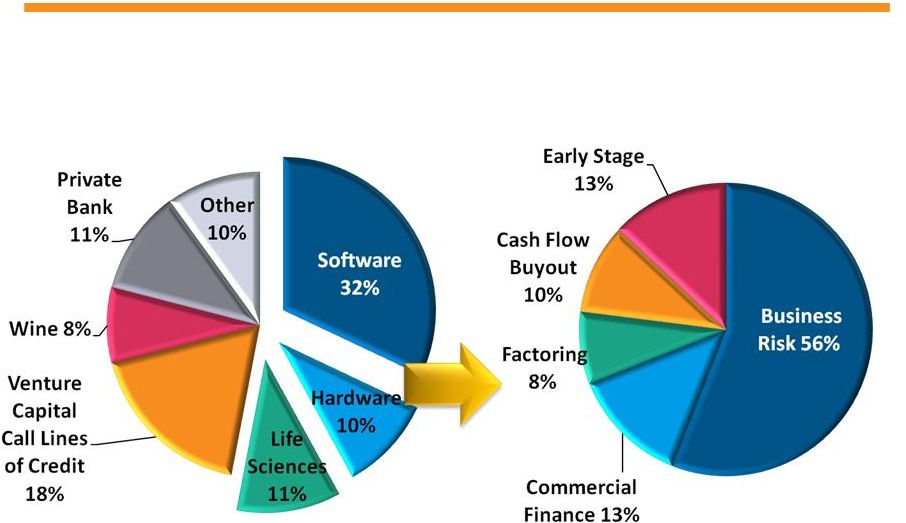 A Focused,
High-Quality Loan Portfolio Risk Composition of Technology
and Life Science Lending
Total Loan Portfolio (3/31/11)
$5.7 Billion
18
Appendix –
First Quarter Review |
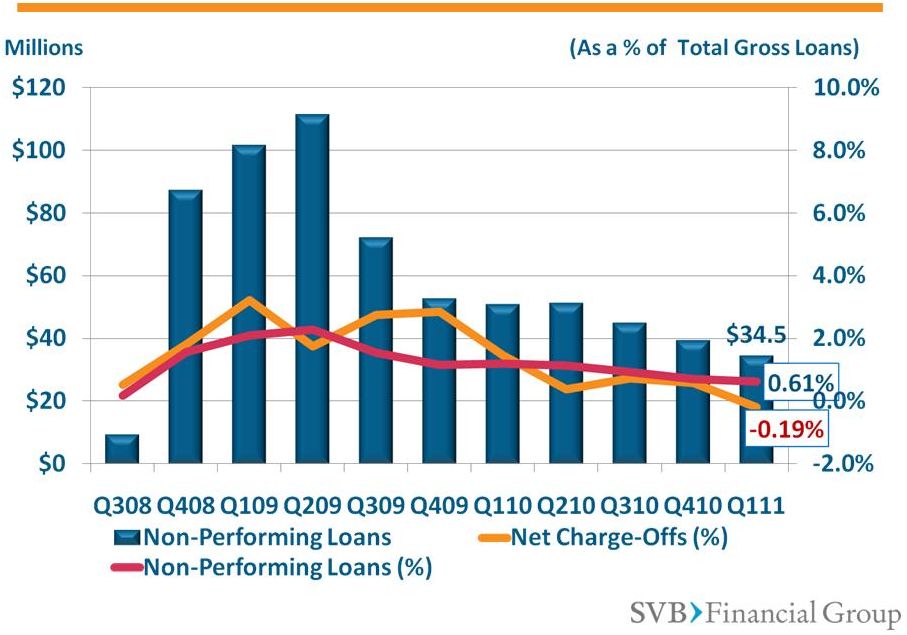 Credit Quality
Has Improved 19
Appendix –
First Quarter Review |
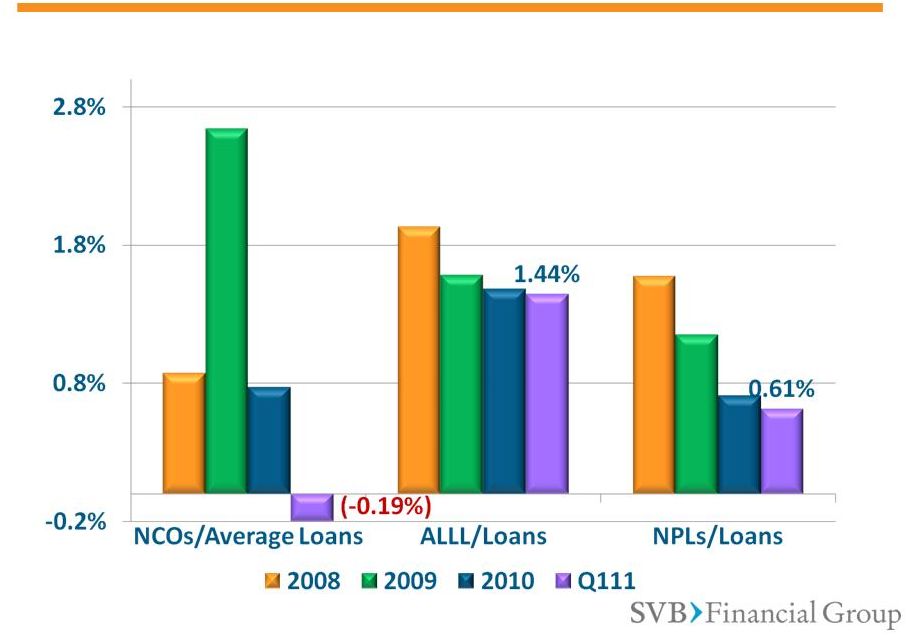 Credit Quality
Has Improved 20
Appendix –
Annual Metrics |
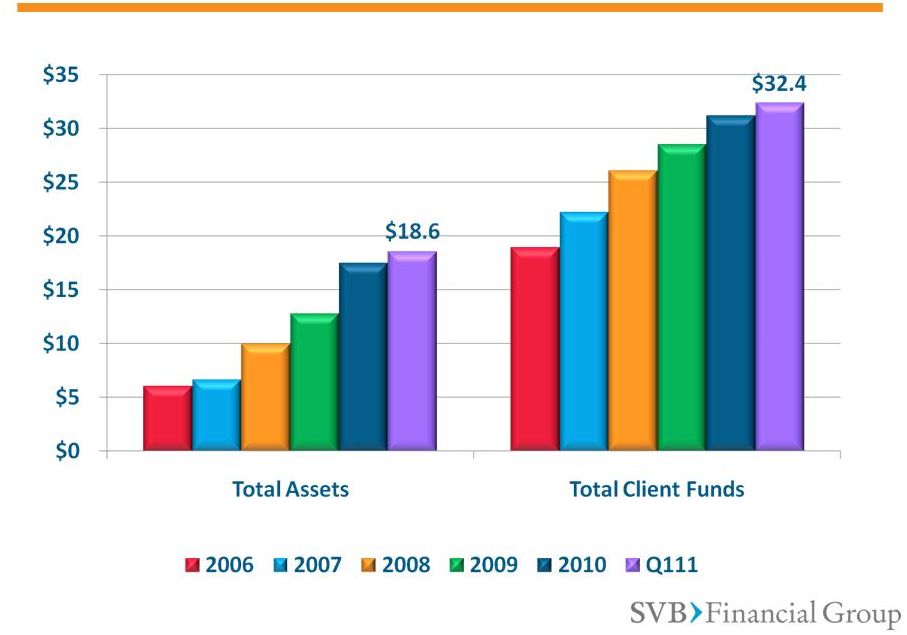 Solid and
Growing Franchise 21
Billions
21
Appendix –
Annual Metrics |
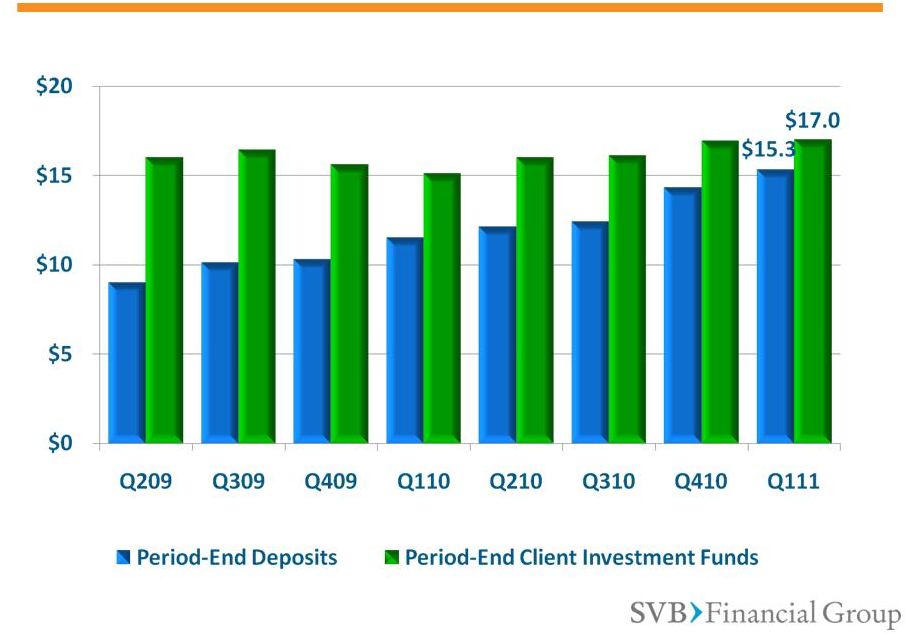 Our Clients Have
Ample Liquidity 22
Billions
22
Appendix –
First Quarter Review |
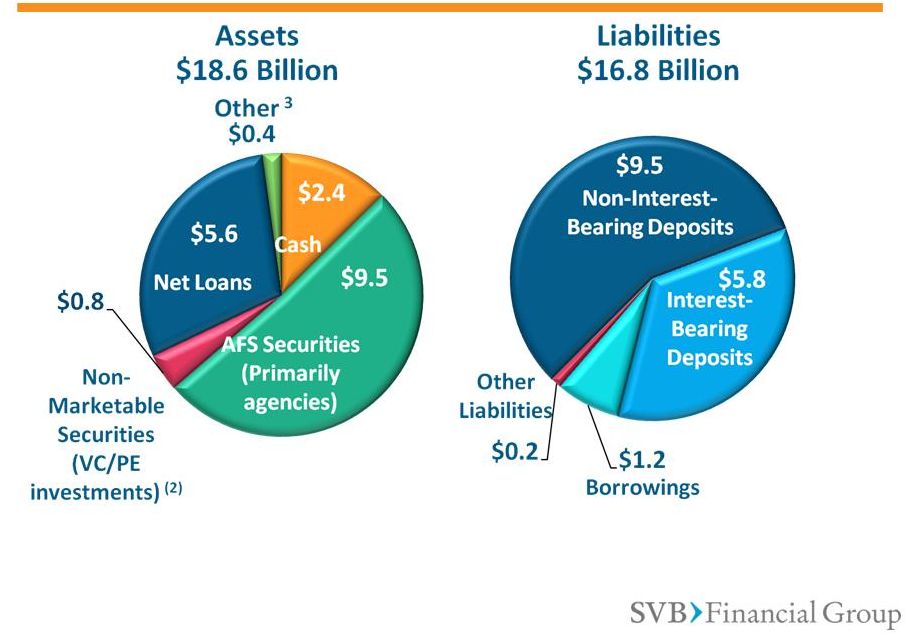 A Liquid Balance
Sheet (1)
1)
At 3/31/11
2)
Net of non-controlling interests, non-marketable securities were $310.1 million.
Non-GAAP number. Please see non-GAAP disclosures at end of presentation and
our most recent financial releases for more information. 3) Includes A)
Premises and Equipment Net of Accumulated Depreciation and Amortization, and B) Accrued Interest Receivable and Other Assets
23
Appendix –
First Quarter Review |
 Rising Rates
Will Benefit Us Significantly Each 25 bps increase in the Fed Funds rate contributes
approximately $4 –
$8 million to Net Interest Income**
**Tax-effected, estimates are based on static balance sheet and assumptions as of
3/31/11 Changes in
Fed Funds
Rate (basis
points)
Changes in
Net Interest
Income (tax
effected)
Incremental
EPS Effect
Incremental
ROE Effect
Net Interest
Margin Effect
+75
+14.3 million
$0.34
+0.8%
+0.14%
+100
+$23.4 million
$0.55
+1.3%
+0.22%
+200
+$57.7 million
$1.36
+3.1%
+0.56%
+300
+$93.7 million
$2.21
+4.8%
+0.90%
24
Appendix –
First Quarter Review |
 Higher Loan
Balances Will Benefit Us **Estimates
are
based
on
static
balance
sheet
and
assumptions
as
of
3/31/11
Each $250 million increase in loan volume contributes
approximately $0.22 to EPS**
25
Appendix –
First Quarter Review
Growth in
Overall Loan
Balances
($$)
Changes in
Net Interest
Income (tax
effected)
Incremental
EPS Effect
Incremental
ROE Effect
Net Interest
Margin
Effect
+250 million
+9.5 million
$0.22
+0.5%
+0.09%
+500 million
+$18.9 million
$0.45
+1.0%
+0.18%
+750 million
+$28.4 million
$0.67
+1.5%
+0.27%
+1 billion
+$37.9 million
$0.89
+2.0%
+0.37% |
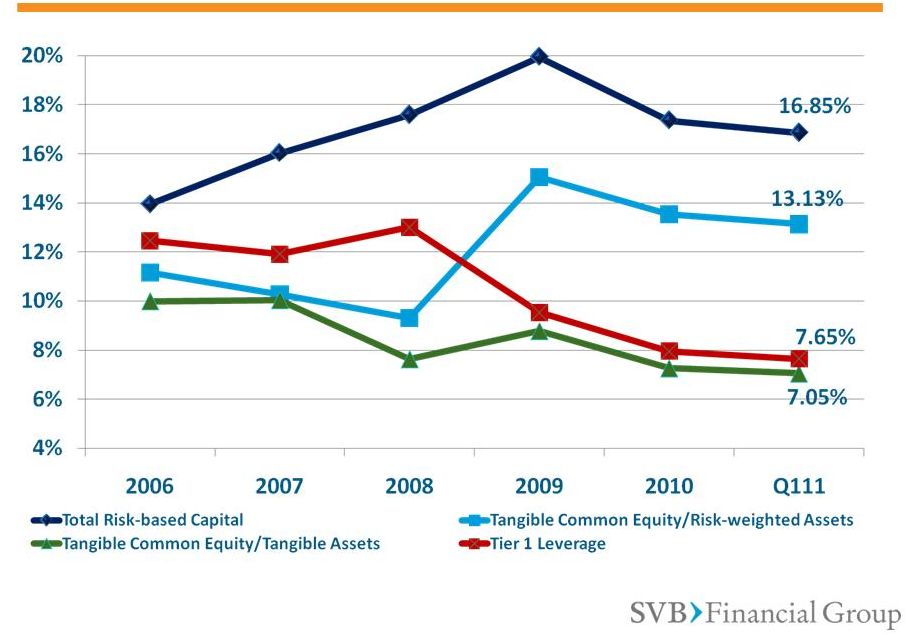 We Are Well
Capitalized TCE/TA and TCE/RWA are non-GAAP Numbers: Please Refer to
Non-GAAP measure disclosure at end of presentation for more information. 26
Appendix –
First Quarter Review |
 Full Year
Outlook: 2011 vs. 2010 Metric
2010 Actual
2011 Outlook
(3)
as of 4/21/11
Loans (average)
$4.4 Billion
Mid-20s % growth
Deposits (average)
$12.0 Billion
Low double-digit % growth
Net Interest Income
$418.1 Million
Mid-twenties % growth
Net Interest Margin
3.08%
Between 3.30% and 3.40%
Allowance for loan losses for performing loans
/period end gross performing loans
1.37%
Between 1.25% and 1.35%
Net Loan Charge-Offs
$34.5 million
Lower than 0.50% of average total gross
loans
Non-Performing Loans/Total Loans
0.71%
Lower than 2010 levels
“Core”
Fee Income
(1)
$109.0 million
High single-digit % increase
Net gains on equity warrant assets
$6.6 million
Between $7 and $10 million
Net gains on investment securities (net of gains
on sales of available-for-sale securities and
non-controlling interests)
$16.1 million
Between $13 and $16 million
Non-interest expense
(excluding expenses
related to non-controlling interests)
$410.5 million
(2)
Mid-teens % increase
1)
“Core”
is defined as fees for deposit services, letters of credit, business credit card, client
investment, and foreign exchange, in aggregate 2)
Non-GAAP number. Please see non-GAAP measure disclosures at end of presentation
and our most recent financial releases for more information. 3)
See latest financial press release for more information
27
Appendix –
First Quarter Review |
 Annual
Metrics 28
Appendix –
Annual Metrics |
 Financial
Highlights: 2008 -2010 2010
2009
2008
Diluted Earnings Per Share
$2.24
$0.66
$2.16
Net Income Available to
Common Stockholders
$95.0M
$22.7M
$73.6M
Average Loans (Change)
$4.4B (-5.6%)
$4.7B
$4.6B
Average Deposits/
(Change)
$12.0B (+36.8%)
$8.8B
$4.9B
Average AFS Securities
$5.4B
$2.3B
$1.3B
Net Interest Margin
3.08%
3.73%
5.72%
Net Interest Income
(Change)
$418.1M (+9.4%)
$382.2M
$368.6M
Non-Interest Income
$247.5M
$97.7M
$152.4M
Net Charge-Offs/Total
Average Gross Loans
0.77%
2.64%
0.87%
Non-Interest Expense
$422.8M
$343.9M
$312.9M
29
Appendix –
Annual Metrics |
 Growth
Initiatives 30
Appendix –
Growth Initiatives |
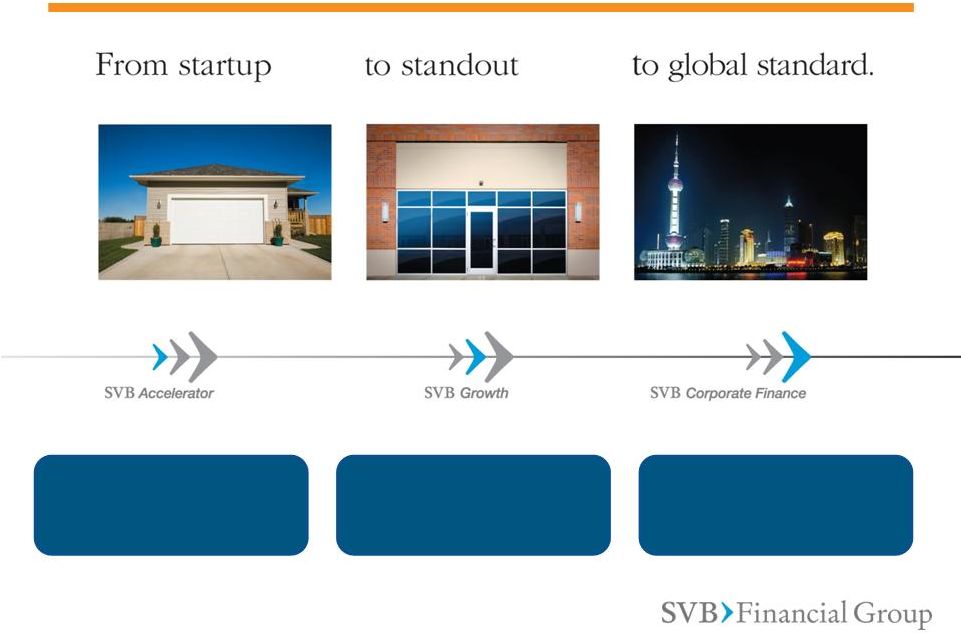 We’re
Supporting Clients At All Stages 50%
Market Share
10% –
12%
Market Share
< 10%
Market Share
31
Appendix –
Growth Initiatives |
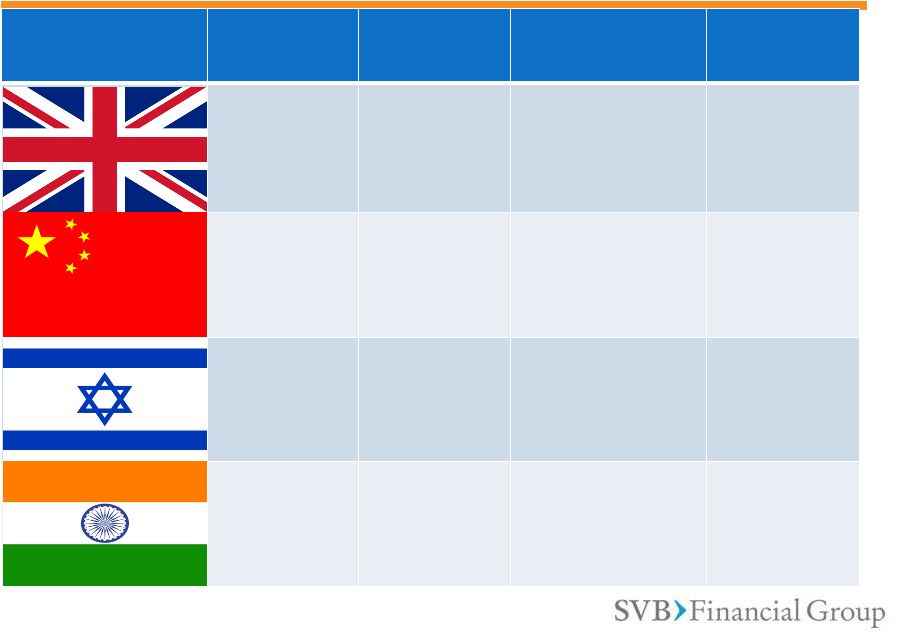 Prior to
2011
2011 -
2012
Long Term
Financial
Impact
-
Rep office
-
LPO
Branch and
full product
set
Subsidiary bank +
Europe;
expansion and
growth
0-2 years
-
Rep Office
-
Funds
JV Bank and
related
activities
Subsidiary
Branch;
expansion and
growth
3-5 years
-
Rep Office
-
LPO
Expansion and
growth
0-2 years
-
NBFC
-
Fund
Branch or
subsidiary
with full
product set
Subsidiary
3-5 years
We Are Extending Our Platform Globally
32
32
Appendix –
Growth Initiatives |
 Private
Bank •
Expanded private banking services
•
Tailored lending for influencers in the SVB
ecosystem
•
An advanced, easy-to-use, online platform
•
Support for clients’
success in all arenas:
business, family, life
33
Appendix –
Growth Initiatives |
 Venture Capital
Markets 34
Appendix –
Venture Capital Markets |
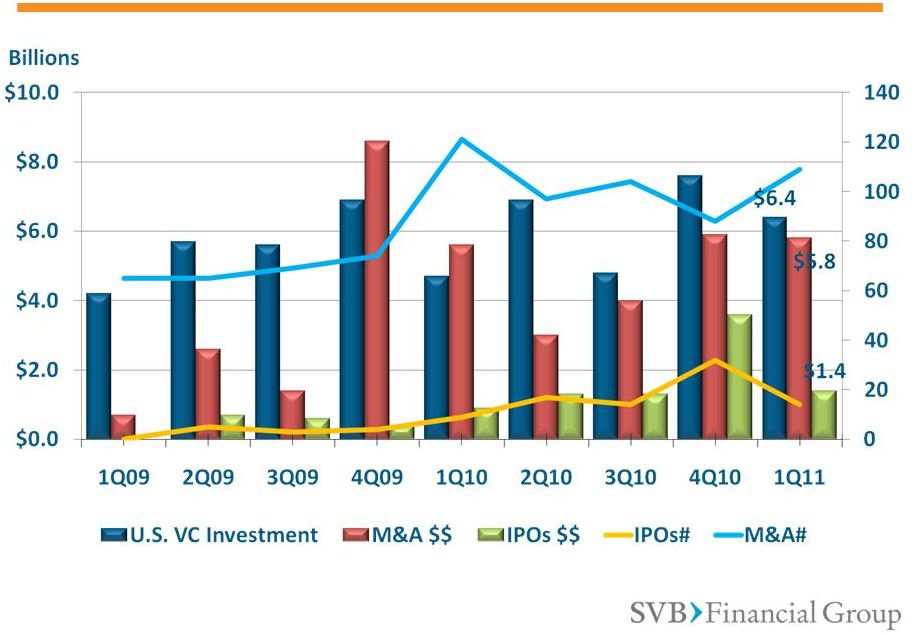 VC Markets Are
Stabilizing Source: Thomson Reuters, National Venture Capital Association, Dow
Jones 35
Appendix –
Venture Capital Markets |
 Non-GAAP
Measures 36
Appendix –
Non-GAAP Reconciliations |
 Non-GAAP
TCE/TA and TCE/RWA Reconciliation Non-GAAP tangible common equity and
tangible assets
(dollars in thousands, except ratios)
March 31,
December 31,
March 31,
2011
2010
2010
GAAP SVBFG stockholders' equity
$ 1,313,574
$ 1,274,350
$ 1,173,480
Less: intangible assets
749
847
979
Tangible common equity
$ 1,312,825
$ 1,273,503
$ 1,172,501
GAAP total assets
$ 18,618,266
$ 17,527,761
$ 14,125,249
Less: intangible assets
749
847
979
Tangible assets
$ 18,617,517
$ 17,526,914
$ 14,124,270
Risk-weighted assets
$ 10,000,214
$ 9,406,677
$ 7,324,526
Tangible common equity to tangible assets
7.05 %
7.27
%
8.30 %
Tangible common equity to risk-weighted
assets
13.13 %
13.54 %
16.01 %
For additional Non-GAAP disclosures, please refer to our regularly filed forms 10-Q and
10-K, as well as our quarterly earnings releases. 37
Appendix –
Non-GAAP Reconciliations |
 Non-GAAP
Non-Interest Income Reconciliation Three
months
ended
Year
ended
Non-GAAP noninterest
income, net of
noncontrolling interests
(dollars in thousands)
March 31,
December 31,
March 31,
December 31,
December 31,
2011
2010
2010
2010
2009
GAAP noninterest income
$ 89,954
$ 71,864
$ 49,273
$ 247,530
$ 97,743
Less: income (losses)
attributable to
noncontrolling interests,
including carried interest
43,562
19,785
13,891
54,186
(24,901)
Less: gains on sales of
available-for-sale securities
-
-
-
24,699
-
Non-GAAP noninterest
income, net of
noncontrolling interests
$ 46,392
$ 52,079
$ 35,382
$ 168,645
$ 122,644
38
Appendix –
Non-GAAP Reconciliations
For additional Non-GAAP disclosures, please refer to our regularly filed forms 10-Q and
10-K, as well as our quarterly earnings releases. |
 Non-GAAP
Non-Interest Expense Reconciliation For additional GAAP to Non-GAAP reconciliation
information, please refer to our regularly filed forms 10-Q and 10-K, as well as our quarterly earnings releases.
39
Appendix –
Non-GAAP Reconciliations
Three
months
ended
Year
ended
Non-GAAP operating efficiency ratio,
net of noncontrolling interests
(dollars in thousands, except ratios)
March 31,
December 31,
March 31,
December 31,
December 31,
2011
2010
2010
2010
2009
GAAP noninterest expense
$ 117,435
$ 115,891
$ 98,576
$ 422,818
$ 343,866
Less: amounts attributable to
noncontrolling interests
3,481
3,298
3,231
12,348
12,451
Less: impairment of goodwill
-
-
-
-
4,092
Non-GAAP noninterest expense,
net of noncontrolling interests
$ 113,954
$ 112,593
$ 95,345
$ 410,470
$ 327,323
GAAP taxable equivalent net interest
income
$ 120,806
$ 105,025
$ 101,362
$ 420,186
$ 384,354
Less: income (losses) attributable to
noncontrolling interests
7
8
(7)
28
(18)
Non-GAAP taxable equivalent net
interest income, net of noncontrolling
interests
120,799
105,017
101,369
420,158
384,372
Non-GAAP noninterest income, net of
noncontrolling interests
46,392
52,079
35,382
168,645
122,644
Non-GAAP taxable equivalent
revenue, net of noncontrolling
interests
$ 167,191
$ 157,096
$ 136,751
$ 588,803
$ 507,016
Non-GAAP
operating
efficiency
ratio
(1)
68.16 %
71.67
%
69.72
%
69.71
%
64.56 %
(1)
The
non-GAAP
operating
efficiency
ratio
is
calculated
by
dividing
non-GAAP
noninterest
expense,
net
of
noncontrolling
interests
by
non-GAAP
taxable
equivalent
revenue,
net
of
noncontrolling
interests.
For
additional
GAAP
to
Non-GAAP
disclosures,
please
refer
to
our
regularly
filed
forms
10-Q
and
10-K,
as
well as
our quarterly earnings releases. |
 Non-GAAP
Non-Marketable
Securities
Reconciliation
For additional GAAP to Non-GAAP disclosures, please refer to our regularly filed forms
10-Q and 10-K, as well as our quarterly earnings releases. 40
Appendix –
Non-GAAP Reconciliations
Non-GAAP non-marketable
securities, net of
noncontrolling interests
(dollars in thousands)
March 31,
December 31,
March 31,
2011
2010
2010
GAAP non-marketable
securities
$ 798,064
$ 721,520
$ 591,692
Less: noncontrolling interests
in non-marketable securities
488,013
423,400
344,890
Non-GAAP non-marketable
securities, net of
noncontrolling interests
$ 310,051
$ 298,120
$ 246,802 |