Attached files
| file | filename |
|---|---|
| 8-K - SUNOCO INC--FORM 8-K - SUNOCO INC | d8k.htm |
| EX-99.1 - PRESS RELEASE - SUNOCO INC | dex991.htm |
 1
1Q11 Earnings Conference Call
May 5, 2011
Exhibit 99.2 |
 2
This slide presentation should be reviewed in conjunction with Sunoco’s First
Quarter 2011 earnings conference call held on May
5,
2011
at
5:30
p.m.
ET.
You
may
listen
to
the
audio
portion
of
the
conference
call
on
the
website
or
an
audio
recording
will be
available
after
the
call’s
completion
by
calling
1-888-566-0627
and
entering
conference
ID
#6570590.
Statements in this presentation that are not historical facts are
forward-looking statements intended to be covered by the safe
harbor
provisions
of
Section
27A
of
the
Securities
Act
of
1933
and
Section
21E
of
the
Securities
Exchange
Act
of
1934.
These
forward-looking statements are based upon assumptions by Sunoco concerning
future conditions, any or all of which ultimately may prove to be
inaccurate, and upon the current knowledge, beliefs and expectations of Sunoco management. These
forward-looking statements are not guarantees of future performance.
Forward-looking statements are inherently uncertain and involve significant
risks and uncertainties that could cause actual results
to
differ
materially
from
those
described
during
this
presentation.
Such
risks
and
uncertainties
include
economic,
business, competitive and/or regulatory factors affecting Sunoco's business, as
well as uncertainties related to the outcomes of pending
or
future
litigation.
In
accordance
with
the
safe
harbor
provisions
of
the
Private
Securities
Litigation
Reform
Act
of
1995, Sunoco has included in its Annual Report on Form 10-K for the year ended
December 31, 2010, and in its subsequent Form 10-Q and Form 8-K
filings, cautionary language identifying important factors (though not necessarily all such factors) that
could
cause
future
outcomes
to
differ
materially
from
those
set
forth
in
the
forward-looking
statements.
For
more
information
concerning these factors, see Sunoco's Securities and Exchange Commission filings,
available on Sunoco's website at www.SunocoInc.com.
Sunoco
expressly
disclaims
any
obligation
to
update
or
alter
its
forward-looking
statements,
whether
as
a result of new information, future events or otherwise.
This presentation includes certain non-GAAP financial measures intended to
supplement, not substitute for, comparable GAAP measures. Reconciliations of
non-GAAP financial measures to GAAP financial measures are provided in the Appendix at the
end
of
the
presentation.
Investors
are
urged
to
consider
carefully
the
comparable
GAAP
measures
and
the
reconciliations
to
those measures provided in the Appendix, or on our website at
www.SunocoInc.com. Safe Harbor Statement |
 3
1Q11 Results
After-tax loss before special items of $122MM* ($1.01/share diluted), pretax
loss of $141MM*
Retail contributed $12MM pretax in a period of rising crude prices
Logistics delivered strong results with pretax income of $31MM
SunCoke earned $9MM pretax
Refining & Supply (R&S) reported a pretax loss of $138MM as operational
issues hindered performance
* For reconciliation to Net Income (Loss), see Slide 13. Special Items in
1Q11 include a net gain of $21MM after-tax.
Summary |
 4
Retail Marketing –
Pretax Earnings of $12MM
Achieved 6.9 cpg average gasoline margins in face of sharply rising
wholesale prices throughout the quarter
Logistics –
Pretax Earnings of $31MM
Earnings helped by 2010 acquisitions (Texon butane blending acquisition
& additional equity interests in West Texas Gulf and Mid-Valley pipelines)
as well as crude lease acquisition results
Coke –
Pretax Earnings of $9MM
Impacted by costs of ~$25 million at Indiana Harbor vs. 1Q10, including
costs to cover projected 2011 coke production shortfall
R&S –
Pretax Loss of $138MM
Operational issues hindered performance –
74% utilization
Rising crude prices also impacted results by ~$40MM
* Pretax Business Unit Income Before Special Items, excluding income attributable
to noncontrolling interests. For reconciliation to Net Income (Loss), see
Slide 13. Segment Pretax Results* -
1Q11 |
 5
1Q10
2Q10
3Q10
4Q10
1Q11
Refining & Supply
(70)
138
(70)
(17)
(138)
Retail Marketing
34
73
68
1
12
Logistics
27
30
40
35
31
Coke
51
56
44
25
9
Chemicals
Continuing Operations
5
7
5
6
(9)
Discontinued Polypropylene Operations
33
-
-
-
-
Corporate Expenses
(23)
(30)
(28)
(27)
(22)
Net Financing Expenses & Other
(28)
(27)
(28)
(27)
(24)
Pretax Income (Loss) Before Special Items
29
247
31
(4)
(141)
Pretax Income (Loss) Before Special Items*, MM$
(141)
(4)
31
247
29
($200)
($100)
$0
$100
$200
$300
* Pretax Income (Loss) Before Special Items. For reconciliation to Net Income
(Loss), see Slide 13. |
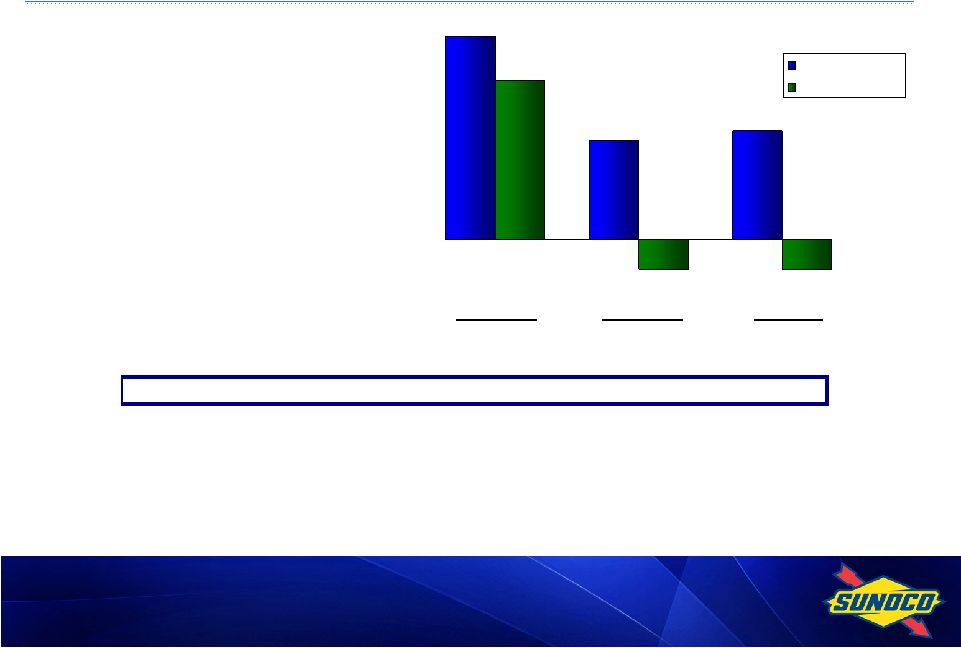
 6
* R&S Weighted
Benchmark. For calculation, see Slide 22.
Realized R&S Margin vs. Benchmark, $/B |
 7
0.65
1.52
0.92
(0.33)
0.92
-3.00
-1.00
1.00
3.00
1Q10
2Q10
3Q10
4Q10
1Q11
Crude Cost vs. Weighted Benchmark
(2.05)
(0.69)
(0.07)
0.50
(0.67)
-4.00
-2.00
0.00
2.00
1Q10
2Q10
3Q10
4Q10
1Q11
Products vs. Weighted Benchmark
Total Refining & Supply
* R&S Weighted
Benchmark. For calculation, see Slide 22.
1Q11 Comments:
Timing hit of ~$1.00/B due to rising crude
prices for third consecutive quarter
Transportation costs and quality differentials
also higher than benchmark
1Q11 Comments:
Realizations impacted by reliability issues-
because of lack of ratability, significant
purchases required, lower yield gains and
sub-optimal product slate
Non-crack product margins squeezed by
rising crude prices
Realized R&S Margin vs. Benchmark*, $/B |
 8
SUN
SXL
(ex SXL)
Sunoco
Cash from ops ex working capital
70
(203)
(133)
Working capital
(40)
(195)
(235)
Cash flow from operations
30
(398)
(368)
Capital expenditures
(28)
(158)
(186)
Cash flow from ops less capex
2
(556)
(554)
Divestments and other investing activities
-
546
546
Dividends to Sunoco shareholders
-
(18)
(18)
Distributions and other financing activities
(29)
3
(26)
SXL dividends to Sunoco
(24)
24
-
Net cash flow before net debt activity
(51)
(1)
(52)
Net debt activity
51
(4)
47
Net decrease in cash & cash equivalents
-
(5)
(5)
1Q11
Sunoco and SXL Cash Flow, MM$ |
 9
12/31/09
12/31/10
3/31/11
Sunoco (ex-SXL)*
32%
-6%
-6%
SXL
50%
54%
55%
Consolidated**
41%
20%
22%
Sunoco Net Debt/(Cash)
1,223
(182)
(165)
SXL Net Debt***
866
1,227
1,278
Consolidated Net Debt, MM$
2,089
945
1,013
Total Cash, MM$
377
1,485
1,480
20%
22%
41%
-6%
-6%
32%
Consolidated
Sunoco (ex-SXL)
* Proforma.
** Sunoco Revolver Covenant basis. For calculation, see Slide 18.
*** Includes intercompany loan due to Sunoco from SXL at 12/31/2010 and 3/31/2011
which is eliminated in consolidation.
Net Debt-to-Capital Ratio, % |
 10
Refining
& Supply
1,100
Chemicals
690
Logistics
1,070
Will create two well-positioned businesses:
Leading high-quality metallurgical coke manufacturer with operations in the
U.S. and abroad
Streamlined fuels business that is better positioned to become the premier
provider of transportation fuels in its markets
Enhances both businesses and allows each to pursue more
focused strategic plan
Fritz Henderson hired to lead SunCoke; will be CEO after
separation
Relocation of corporate headquarters to Chicago area in mid-May
Filed registration statement with SEC in March for proposed IPO
of stock in SunCoke => 2 step separation planned
Unlocking Shareholder Value via SunCoke Separation |
 11
Market remains challenging, but we continue to execute our strategy
Strong
results
in
logistics
and
good
execution
in
retail
in
face
of
challenging
market
Strong balance sheet provides flexibility
~$1.5 B cash at 3/31/11
Refining
remains
focused
on
improving
reliability/utilization,
margin
capture
and
cost
structure
Focused on fundamentals
Run safely and reliably at optimal capacity utilization; match product yield to
demand Improve margin capture
Lower our break-even cost per barrel
Balance sheet: High cash balance provides strategic flexibility
Positioning for future success
Become premier provider of transportation fuels in our markets
Grow through Retail and SXL
Achieve sustainably lower cost structure
Separation of SunCoke Energy on track
Key Takeaways |
 12
Appendix |
 13
Earnings Profile, MM$
*
Represents
a
loss
recognized
in
connection
with
the
divestment
of
the
polypropylene
chemicals
business.
1Q10
2Q10
3Q10
4Q10
FY10
1Q11
Refining & Supply
(70)
138
(70)
(17)
(19)
(138)
Retail Marketing
34
73
68
1
176
12
Logistics
27
30
40
35
132
31
Chemicals:
Continuing Operations
5
7
5
6
23
(9)
Discontinued Operations
33
-
-
-
33
-
Coke
51
56
44
25
176
9
Corporate and Other:
Corporate Expenses
(23)
(30)
(28)
(27)
(108)
(22)
Net Financing Expenses & Other
(28)
(27)
(28)
(27)
(110)
(24)
Pretax Income (Loss) attributable to Sunoco, Inc.
shareholders before special items
29
247
31
(4)
303
(141)
Income Tax Expense (Benefit) attributable to
Sunoco, Inc. shareholders
12
89
4
(17)
88
(19)
Income (Loss) attributable to Sunoco, Inc.
shareholders before special items
17
158
27
13
215
(122)
Special Items:
Continuing Operations
(45)
(22)
62
123
118
51
Discontinued Operations*
(169)
-
-
-
(169)
-
Pretax Income (Loss) from special items
(214)
(22)
62
123
(51)
51
Income Tax Expense (Benefit)
(134)
(9)
24
49
(70)
30
Income (Loss) from special items
(80)
(13)
38
74
19
21
Net Income (Loss) attributable to
Sunoco, Inc. shareholders
(63)
145
65
87
234
(101) |
 14
Earnings Summary and EPS
MM$
1Q10
2Q10
3Q10
4Q10
FY10
1Q11
Income (Loss) attributable to Sunoco, Inc.
shareholders before special items
17
158
27
13
215
(122)
Special Items:
Continuing Operations
(45)
(22)
62
123
118
51
Discontinued Operations*
(169)
-
-
-
(169)
-
Pretax Income (Loss) from special items
(214)
(22)
62
123
(51)
51
Income Tax Expense (Benefit)
(134)
(9)
24
49
(70)
30
Income (Loss) from special items
(80)
(13)
38
74
19
21
Net Income (Loss) attributable to
Sunoco, Inc. shareholders
(63)
145
65
87
234
(101)
$/Share (diluted)
Earnings (Loss) per share of common stock (diluted):
Income (Loss) attributable to Sunoco, Inc.
shareholders before special items
0.14
1.31
0.22
0.11
1.79
(1.01)
Income (Loss) from special items
(0.67)
(0.11)
0.32
0.61
0.16
0.17
Net Income (Loss) attributable to
Sunoco, Inc. shareholders
(0.53)
1.20
0.54
0.72
1.95
(0.84)
* Represents a loss recognized in connection with the divestment
of the polypropylene chemicals business. |
 15
1Q10
2Q10
3Q10
4Q10
FY10
1Q11
Total Refining & Supply
Crude Throughputs, MB/D
533
618
632
572
589
460
% Capacity
79
92
94
85
87
74
Net Prod. Available for Sale, MB/D
591
664
682
634
643
512
Net Prod. Available for Sale, MMB
53
61
62
58
234
46
Key Volume Indicators –
Refining & Supply |
 16
1Q10
2Q10
3Q10
4Q10
FY10
1Q11
Realized Margin Indicators
Refining & Supply, $/B
4.08
7.34
3.88
4.77
5.04
3.14
Retail Marketing, cpg
Gasoline
8.9
11.5
10.5
6.6
9.4
6.9
Distillate
8.0
9.0
7.8
5.6
7.6
7.1
Chemicals, cpp*
9.9
8.9
7.6
9.1
8.8
7.4
Market Indicators
Dated Brent Crude Oil, $/B
76.24
78.30
76.86
86.53
79.48
104.90
Natural Gas, $/DT
5.04
4.34
4.23
3.97
4.40
4.20
* Excludes discontinued polypropylene operations.
Key Indicators |
 17
1Q10
2Q10
3Q10
4Q10
FY10
1Q11
Retail Marketing
Gasoline Sales, MM Gal
1,026
1,130
1,171
1,171
4,498
1,086
Middle Distillate Sales, MM Gal
91
114
117
110
432
97
Total Sales, MM Gal
1,117
1,244
1,288
1,281
4,930
1,183
Gasoline and Diesel Throughput
147
159
148
161
156
150
(Company-Owned or Leased Outlets)
(M Gal/Site/Month)
Merchandise Sales (M$/Store/Month)
87
101
103
92
96
85
Chemicals*
Phenol and Related Sales, MM#
449
554
567
582
2,152
470
Coke
Production, M Tons:
United States
841
883
953
916
3,593
861
Brazil
413
422
431
370
1,636
331
* Excludes discontinued polypropylene operations.
Key Volume Indicators –
Retail, Chemicals, Coke |
 18
* Represents intercompany loan due to Sunoco from SXL which is eliminated in
consolidation. ** Represents Partners’
Capital for SXL and Shareholders’
Equity for Sunoco.
*** The Net Debt / Capital ratio is used by Sunoco management in its internal
financial analysis and by investors and creditors
in
the
assessment
of
Sunoco’s
financial
position;
calculation
excludes
noncontrolling
interests
except
for
SXL
as prescribed by the revolver covenant.
Financial Ratios, MM$ except ratios
Proforma
Proforma
Proforma
SUN
SUN
SUN
SXL
(ex SXL)
Sunoco
SXL
(ex SXL)
Sunoco
SXL
(ex SXL)
Sunoco
Debt
868
1,596
2,464
1,129
1,300
2,429
1,180
1,292
2,472
Intercompany Debt*
-
-
-
100
-
-
100
-
Plus: Debt Guarantees
-
2
2
-
1
1
-
21
21
Less: Cash
(2)
(375)
(377)
(2)
(1,483)
(1,485)
(2)
(1,478)
(1,480)
Net Debt
866
1,223
2,089
1,227
(182)
945
1,278
(165)
1,013
Equity**
862
2,557
2,557
965
3,046
3,046
963
2,950
2,950
SXL Noncontrolling Interest
-
-
488
77
-
692
78
-
692
Other Noncontrolling Interest
-
74
74
-
61
61
-
52
52
Capital
1,728
3,854
5,208
2,269
2,925
4,744
2,319
2,837
4,707
Net Debt / Capital (Sunoco
Revolver Covenant
N/A
32%
41%
N/A
-6%
20%
N/A
-6%
22%
Basis)***
Debt / Capital
50%
38%
44%
54%
29%
39%
55%
30%
40%
(GAAP Basis)
12/31/2009
12/31/2010
3/31/2011 |
 19
Liquidity*, B$
* Includes cash and cash equivalents of $0.4B, $1.5B and $1.5B at 12/31/09,
12/31/10, and 3/31/11 respectively.
0.0
0.5
1.0
1.5
2.0
2.5
3.0
3.5
12/31/2009
12/31/2010
3/31/2011
SXL
Sunoco
1.7
3.4
3.4 |
 20
1Q10
2Q10
3Q10
4Q10
FY10
1Q11
Total Refining & Supply
Net Production, MB/D
590.5
664.2
681.5
633.9
642.8
512.4
Gasoline
52%
52%
52%
54%
52%
52%
Middle Distillates
34%
37%
37%
35%
36%
36%
Residual Fuel
6%
6%
5%
4%
5%
5%
Petrochemicals
4%
3%
4%
4%
4%
3%
Other
9%
7%
7%
8%
8%
9%
Less Refinery Fuel
-5%
-5%
-5%
-5%
-5%
-5%
Refining & Supply –
Products Manufactured |
 21
1Q10
2Q10
3Q10
4Q10
FY10
1Q11
Total Refining & Supply
Gasoline Production, MB/D
306.3
343.1
357.9
339.9
337.0
265.4
RFG
47%
48%
43%
45%
46%
49%
Conventional
53%
52%
57%
55%
54%
51%
Distillate Production, MB/D
202.4
244.5
250.1
225.1
230.6
183.6
On-Road Diesel Fuel
53%
66%
62%
52%
59%
52%
Heating Oil / Off-Road Diesel
28%
15%
18%
25%
21%
26%
Jet Fuel
17%
19%
19%
21%
19%
20%
Kerosene/Other
2%
0%
1%
2%
1%
2%
Refining & Supply –
Gasoline and Distillate Production |
 22
Toledo 4-3-1 Benchmark
4 WTI Crude: NYMEX Futures Close + $2.00 for transportation
3 Unleaded Gasoline: Chicago Pipeline Platt’s Low
1 Distillate: 50% ULSD Chicago Pipeline Platt’s Low
50% Jet Gulf Coast Pipe Platt’s Low
Northeast 6-3-2-1 Value-Added Benchmark
6 Dated Brent Crude: Platt’s Mid + $2.25 for transportation
3 Gasoline: 50% Unleaded RBOB NY Harbor Barge Platt's Low
50% Unleaded Regular Gasoline NY Harbor Barge Platt's Low
2 Distillate: 55% ULSD NY Harbor Barge Platt's Low
20% Jet/Kero NY Harbor Barge Platt's Low
25% No.2 Fuel Oil NY Harbor Barge Platt's Low
1 No. 6 0.3% Sulfur High Pour Resid: NY Harbor Barge Platt’s Low
1Q10
2Q10
3Q10
4Q10
FY10
Jan 11
Feb 11
Mar 11
1Q11
Northeast 6-3-2-1
Value-Added Benchmark
6.09
5.91
4.22
6.05
5.57
5.86
4.70
6.60
5.72
Toledo 4-3-1
Benchmark
3.99
8.89
7.50
6.33
6.68
9.89
15.52
n/a
12.70
1Q10
2Q10
3Q10
4Q10
FY10
Jan 11
Feb 11
Mar 11
1Q11
Northeast 6-3-2-1
at 80% weight*
4.87
4.73
3.37
4.84
4.46
4.69
3.76
6.60
5.02
Toledo 4-3-1
at 20% weight*
0.80
1.78
1.50
1.27
1.33
1.98
3.10
n/a
1.69
R&S Weighted Benchmark*
5.67
6.51
4.87
6.11
5.79
6.67
6.86
6.60
6.71
Sunoco R&S Weighted Benchmark Margin, $/B
* Exception to weighted calculation for March 2011 due to the sale of Toledo
refinery on 3/1/11. -
Prior to Toledo sale on 3/1/11:
80% of NE 6-3-2-1 Value Added Margin and 20% of Toledo
4-3-1 Margin.
-
Post Toledo sale on 3/1/11:
100% of NE 6-3-2-1 Value Added Margin. |
 23
Media releases and SEC filings are available
on our website at www.SunocoInc.com
Contact for more information:
Clare McGrory
(215) 977-6764
For More Information |