Attached files
| file | filename |
|---|---|
| 8-K - SI FINANCIAL GROUP 8-K 5-5-2011 - SI Financial Group, Inc. | form8k.htm |

Investor Presentation
May 5, 2011

Forward Looking Statements
2
This presentation contains forward-looking statements, which can be identified by the use of words such as “believes,” “expects,”
“anticipates,” “estimates” or similar expressions. These forward-looking statements include, but are not limited to:
“anticipates,” “estimates” or similar expressions. These forward-looking statements include, but are not limited to:
u statements of our goals, intentions and expectations;
u statements regarding our business plans, prospects, growth and operating strategies;
u statements regarding the asset quality of our loan and investment portfolios; and
u estimates of our risks and future costs and benefits.
These forward-looking statements are subject to significant risks and uncertainties. Actual results may differ materially from those
contemplated by the forward-looking statements due to, among others, the following factors:
contemplated by the forward-looking statements due to, among others, the following factors:
Ø general economic conditions, either nationally or in our market areas, that are worse than expected;
Ø changes in the interest rate environment that reduce our margins or reduce fair value of financial instruments;
Ø increased competitive pressures among financial services companies;
Ø changes in consumer spending, borrowing and savings habits;
Ø legislative or regulatory changes that adversely affect our business;
Ø adverse changes in the securities and credit markets; and
Ø changes in accounting policies and practices, as may be adopted by bank regulatory agencies or the Financial Accounting
Standards Board.
Standards Board.
Any of the forward-looking statements that we make in this presentation and in other public statements we make may later prove
incorrect because of inaccurate assumptions, the factors illustrated above or other factors that we cannot foresee. Consequently, no
forward-looking statement can be guaranteed.
incorrect because of inaccurate assumptions, the factors illustrated above or other factors that we cannot foresee. Consequently, no
forward-looking statement can be guaranteed.
Because of these and other uncertainties, our actual future results may be materially different from the results indicated by these
forward-looking statements.
forward-looking statements.

3

4
|
Issuer:
|
SI Financial Group, Inc.
|
|
Listing / Ticker:
|
Nasdaq Global Market / “SIFI”
|
|
Market Price Per Share:
|
$9.95
|
|
Shares Outstanding:
|
10,576,302
|
|
Market Capitalization:
|
$105.2 million
|
|
Tangible Book Value Per Share:
|
$11.80
|
|
Price to Tangible Book Value:
|
84.3%
|
|
Dividend Yield:
|
1.2%
|
Market Summary as of 05/02/11
Company Overview

Company History
6
u Headquartered in Willimantic, CT
u Established in 1842
u Total assets in 1995: $252 million
u Total assets at 3/31/11: $929 million

Experienced Management Team
7
u Savings Institute’s management team is comprised of experienced individuals that
have operated through various credit cycles and have executed the Bank’s growth
strategy
have operated through various credit cycles and have executed the Bank’s growth
strategy
u 156 years of Banking Experience, 91 years at SIBT
u CEO, CFO and SCO with 88 years of commercial bank experience
u Chief Risk Officer with 10 years of compliance and operations experience

Company Profile
Headquartered in Willimantic, CT, SI
Financial reorganized to a two-tier
mutual holding company in 2000 and sold
a minority interest in 2004. In 2011, SI
Financial completed their 2nd step
conversion.
Financial completed their 2nd step
conversion.
As of December 31, 2010 / March 31, 2011:
u Total assets: $926.4 M / $929.4 M
u Total capital: $81.1 M / $128.9 M
u Number of banking offices: 21
u Number of full-time employees: 237
u Number of part-time employees: 38 / 37

Market Area Overview
9
u Savings Institute operates 21 full-service community banking locations in
Windham, New London, Tolland, Hartford and Middlesex counties in Connecticut
Windham, New London, Tolland, Hartford and Middlesex counties in Connecticut
u 30 miles east of Hartford, Connecticut
u Diverse economy primarily oriented to the educational, service, entertainment,
manufacturing and retail industries. Largest employers include:
manufacturing and retail industries. Largest employers include:
u The Mohegan Sun and Foxwoods casinos
u General Dynamics Defense Systems
u Pfizer, Inc.
u Several institutions of higher education (University of Connecticut, Eastern Connecticut
State University, Mitchell College, Connecticut College)
State University, Mitchell College, Connecticut College)
u Small to mid-sized businesses generally support the local economies
u During the current economic downturn Savings Institute’s primary market area has
remained a relatively stable banking market
remained a relatively stable banking market
u Since 2000, primary market’s population has grown by approximately 7.1% versus 3.8%
for Connecticut
for Connecticut
u In the 5 counties Savings Institute maintains branches median household income levels
ranged from $58,000 to $78,000 versus $70,000 for Connecticut and $54,000 for the
U.S.
ranged from $58,000 to $78,000 versus $70,000 for Connecticut and $54,000 for the
U.S.

Market Area Presence
10
u Savings Institute is among the top 10 banks by market share in 3 of the 5 counties
in which it does business
in which it does business
Source: FDIC. Data as of 6/30/10.

Business Strategy
11
u Continue community oriented focus by offering a full range of financial products
and services to its customers
and services to its customers
u Optimize future growth opportunities by executing a proven business model and by
seeking acquisition opportunities in areas in or adjacent to existing market area
seeking acquisition opportunities in areas in or adjacent to existing market area
u Actively manage the balance sheet and diversify the asset mix
u Prudently increase percentage of assets consisting of multi-family, commercial real
estate and commercial business loans
estate and commercial business loans
u Continue conservative underwriting practices and maintain a high quality loan
portfolio
portfolio
u Increase core deposits by emphasizing demand, savings and money market
accounts
accounts
u Supplement noninterest income through expanded mortgage banking operations
and existing wealth management operations
and existing wealth management operations

Acquisition Opportunities
12
u In Connecticut, Rhode Island and
Massachusetts there are
approximately 26 public and private
banks and thrifts with assets
between $100 million and $500
million
Massachusetts there are
approximately 26 public and private
banks and thrifts with assets
between $100 million and $500
million
u 11 are de novo
u 4 have TARP outstanding
u 2 have Texas ratios of greater than
50%*
50%*
u On a selective basis Savings
Institute would consider expanding
into contiguous or near-contiguous
markets via:
Institute would consider expanding
into contiguous or near-contiguous
markets via:
u Whole bank acquisitions
u Branch acquisitions
u FDIC assisted transactions
* Texas ratio defined as nonperforming assets, accruing restructured debt and accruing loans 90+ days past due divided by tangible common equity plus loan loss reserves.

Financial Highlights

Franchise Growth
u Savings Institute has grown organically and through acquisitions, resulting in an
asset CAGR from 2005 to 2010 of 6.0%
asset CAGR from 2005 to 2010 of 6.0%
u Since 2005 has acquired 2 branches, opened 4 branches and relocated or renovated 6
existing branches, expanding market presence in Tolland, New London, Hartford and
Middlesex counties
existing branches, expanding market presence in Tolland, New London, Hartford and
Middlesex counties

Diversified Loan Portfolio
15
u Savings Institute has diversified its portfolio mix by increasing commercial real
estate, multi-family and commercial business lending while maintaining prudent
underwriting practices
estate, multi-family and commercial business lending while maintaining prudent
underwriting practices
u Increased focus on SBA and USDA guaranteed commercial lending
At March 31, 2011
Total Loans: $611.4 million
At December 31, 2005
Total Loans: $516.4 million
Other loans consist of home equity and other consumer.
1-4 Family
Residential
52%
Other
Commercial
4%
Construction
9%
SBA and USDA
Guaranteed
Commercial
11%
Other
5%
Multi-family and
CRE
19%
Other
Commercial
4%
Construction
1%
SBA and USDA
Guaranteed
Commercial
21%
Other
5%
Multi-family and
CRE
26%
1-4 Family
Residential
43%
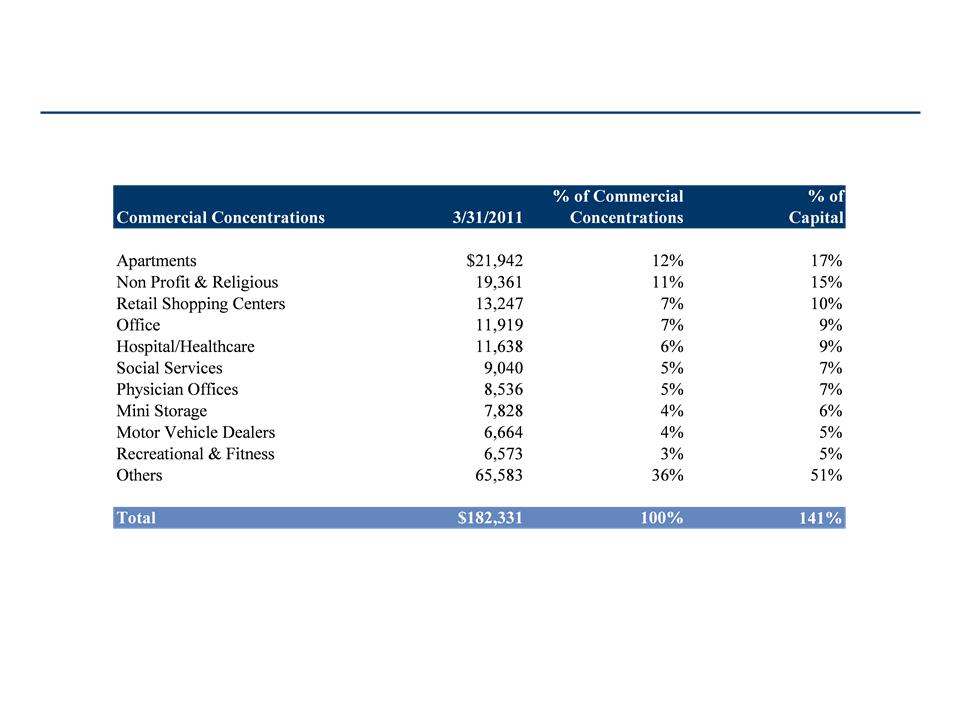
Commercial Loan Concentrations
16
Commercial loan concentration includes CRE, Multi-family and C&I loans
Dollars in thousands

Asset Quality Trends
u Savings Institute has maintained high asset quality with solid reserve coverage
u Aggressive early recognition of nonperforming loans
NPAs and TDRs/Assets
Peer group comprised of all publicly traded banks and thrifts in Connecticut.
2005
2006
2007
2008
2009
2010
3/31/2011
Total Nonperforming Loans
$240
$1,392
$7,632
$9,328
$3,007
$4,925
$6,173
Other Real Estate Owned
325
0
913
0
3,680
1,285
830
Total Nonperforming Assets
$565
$1,392
$8,545
$9,328
$6,687
$6,210
$7,003
Accruing Troubled Debt Restructurings
74
72
71
69
67
5,261
5,704
Total NPAs and TDRs
$639
$1,464
$8,616
$9,397
$6,754
$11,471
$12,707
NPLs/Loans
0.05%
0.24%
1.29%
1.50%
0.49%
0.80%
1.01%
NCOs/Avg Loans
(0.01)
0.03
0.03
0.09
0.64
0.16
0.29
NPAs and TDRs/Assets
0.09
0.19
1.09
1.10
0.77
1.24
1.37
Reserves/Loans
0.71
0.76
0.89
0.97
0.80
0.78
0.75
Reserves/NPLs
1,529.6
313.6
68.7
64.8
162.7
97.4
73.9

Non Performing Asset Breakdown
18
Dollars in thousands
30-59 days
60-89 days
Non
At 3/31/11
Accruing
Accruing
Accrual
OREO
1-4 Family Residential
$2,417
$11
$4,079
$190
CRE and Multi-family
595
0
1,992
640
Other Commercial
0
0
52
0
Home Equity
285
0
50
0
Other Consumer
9
2
0
0
Total
$3,306
$13
$6,173
$830
Excludes Purchased SBA/USDA Loans

Securities Portfolio
19
u Savings Institute maintains a diversified securities portfolio totaling $217 million as
of March 31, 2011
of March 31, 2011
u Savings Institute has previously taken $2.3 million in OTTI charges on 3 pooled trust
preferred securities and one non agency MBS
preferred securities and one non agency MBS
u Savings Institute performs impairment analyses on its securities portfolio quarterly
u As of March 31, 2011 investments below investment grade consisted of pooled trust
preferred securities with a book value of $6.7 million and a fair value of $3.7 million and
non-agency MBS with a book value of $7.3 million and a fair value of $6.9 million
preferred securities with a book value of $6.7 million and a fair value of $3.7 million and
non-agency MBS with a book value of $7.3 million and a fair value of $6.9 million
March 31, 2011
Equity
1%
USG and Agency
Obligations
17%
Corporate Debt
7%
Agency MBS -
Residential
47%
Non-Agency MBS
- Residential
6%
State and
Municipal Debt
3%
CDOs (TRuPs)
2%
GSE Debt
Obligations
17%

Deposit Mix
20
u Savings Institute has grown deposits and emphasized the growth of core deposits through
investments to its branch network, new product offerings and attracting commercial deposits
from small and medium size businesses
investments to its branch network, new product offerings and attracting commercial deposits
from small and medium size businesses
u From 2005 to 2010 total deposits and non-time deposits have grown at CAGRs of 5.3% and
7.0%, respectively
7.0%, respectively
Total deposits exclude mortgagors’ and investors’ escrow accounts.
Cost of
Interest
Bearing
Deposits
Interest
Bearing
Deposits
1.98%
2.74%
3.19%
2.85%
2.25%
1.55%
1.28%

Electronic Banking
21
Transactions at SIBT ATMs
195,229
190,790
Debit Signature Transactions
466,042
513,614
Debit POS/ATM Transactions
522,519
555,505
On Line Bill Pay Transactions
78,954
82,292
eStatement Accounts
7,796
9,524
Consumer Online Customers
10,989
13,021
Business Online Customers
471
848

Mortgage Banking
22
Dollars in thousands
u Savings Institute has recently started selling mortgage loans but has been retaining
the servicing portion and receives a fee for doing so.
the servicing portion and receives a fee for doing so.
Residential Mortgage Loans
Originated
$17,314,000
$25,094,000
Sold
7,624,000
19,844,000
Residential Loans Sold / Serviced
$125,543,757
$163,778,354

Core Profitability
23
u Core earnings have remained profitable, after excluding the following events:
u 2008 write down on securities of $7.1 million
u 2009 FDIC special assessment of $393,000
* Excludes events as noted above.

Strong Capital Profile
24
(1) Represents bank level data.
u Through internal capital generation Savings Institute has remained well capitalized
throughout the current economic crisis
throughout the current economic crisis
u As a result of our recent 2nd step offering, Savings Institute continues to have a
strong capital base for growth and execution of its business plan
strong capital base for growth and execution of its business plan
As of March 31, 2011
Minimum
Actual
Tangible Common Equity
NA
10.91%
Leverage (1)
5.00%
10.91
Tier 1 Risk Based (1)
6.00
20.80
Total Risk Based Capital (1)
10.00
21.77

Stock Buybacks and Dividends
25
u Since completing our MHC offering in December 2004, SI Financial has
repurchased approximately 786,000 shares
repurchased approximately 786,000 shares
u Approximately 15.6% of original offering
u Between March 2005 and March 2011 SI Financial has paid stockholders a total of
$0.72 in quarterly dividends
$0.72 in quarterly dividends
u Quarterly dividend was suspended in January 2009 in order to preserve capital
u With improving earnings outlook, quarterly dividend of $0.03 reinstated in May
2010 resulting in an annual dividend yield of 1.50% based on the $8.00 per share
offering price*
2010 resulting in an annual dividend yield of 1.50% based on the $8.00 per share
offering price*
* The rate of such dividends will be in the discretion of the board of directors and will depend upon a number of factors. No assurance can be given that SI Financial will continue
to pay dividends or that they will not be reduced in the future.
to pay dividends or that they will not be reduced in the future.

Investment Merits
u Community-oriented bank with experienced management team
u Managed company through different credit cycles
u Executed various bank and non-bank acquisitions
u Strong asset quality track record and reserve coverage levels
u Strong core deposit base
u Diversified loan portfolio
u Internal and external growth opportunities post-transaction
26
Trading Multiples
27
(1) Peer Group consists of Nationwide thrifts with assets between $500M and $1.5B and market caps between $75M and $125M.
Data as of May 2, 2011
Source: SNL Financial
SIFI
Average
Median
Average
Median
Price
$9.95
Price / Earnings
NM
19.80x
14.76x
26.78x
24.28x
Price / Book
81.62%
90.27%
87.31%
95.43%
91.99%
Price / Tang Book
84.32%
94.30%
88.40%
106.83%
98.62%
Peer Group
(1)
New England Thrifts


30