Attached files
| file | filename |
|---|---|
| 8-K - FORM 8-K - Kraton Corp | d8k.htm |
 May 5,
2011 Kraton Performance Polymers, Inc.
First Quarter 2011 Earnings Conference Call
Exhibit 99.1
*
*
*
*
*
*
* |
 Forward-Looking Statement Disclaimer
2 |
 GAAP
Disclaimer 3 |
 Update
on 2011 Business Priorities Innovation-led Top-line
Growth
Capital Investment
2011 capital expenditures of $80-$85 million
Paulinia IRL expansion complete
Belpre IR conversion will be complete Q2 2011
Belpre DCS upgrade ongoing
Earnings Growth
Q1 sales volume of 81 kT, up 12% year-on-year
Q1 revenue of $345 million, up 26% year-on-year
Q1 GAAP net income of $22 million or $0.68 per share
Restructuring, refinancing and other charges of $10
million or $0.30 per share
Q1 Adjusted EBITDA of $56 million
4
Q1 TTM vitality index of 14%
Q1’11 innovation revenue increase of $17 million over
Q1’10
Continuing review of options for Asian HSBC plant
Anticipate site selection decision in the second
half of 2011 |
 Advanced Materials End Use Review
5
TTM Revenue Profile
Change in Sales Revenue
End Use Revenue
Change in Sales Revenue
US $ in millions |
 Adhesives, Sealants and Coatings End Use Review
TTM Revenue Profile
Change in Sales Revenue
6
End Use Revenue
US $ in millions |
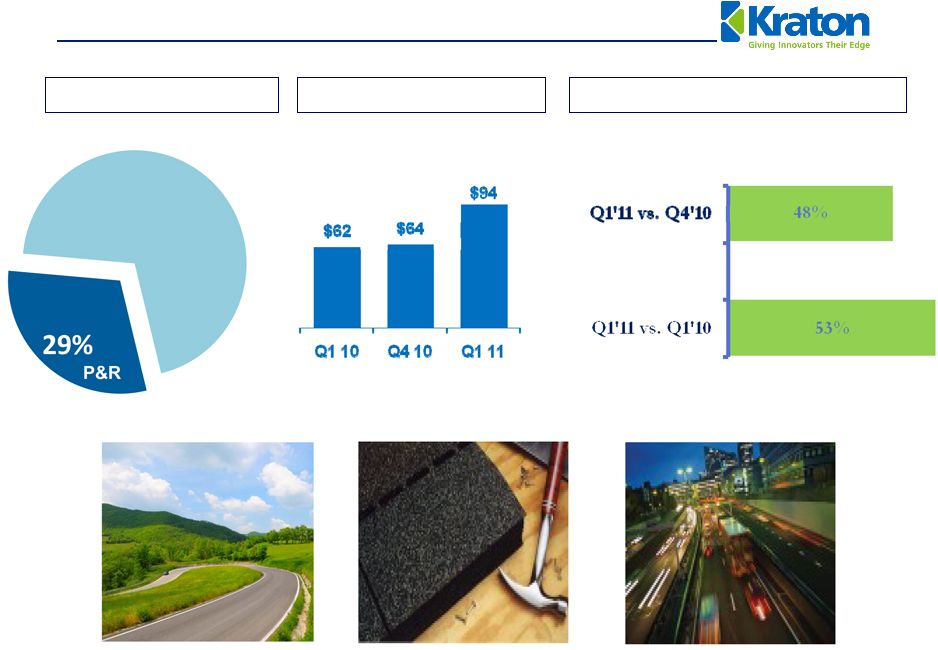 Paving
and Roofing End-Use Review 7
TTM Revenue Profile
Change in Sales Revenue
End Use Revenue
Change in Sales Revenue
US $ in millions |
 Emerging Businesses End Use Review
8
TTM Revenue Profile
Sales Revenue
End Use Revenue
US $ in millions
US $ in millions
0 |
 Innovation-led Top Line Growth
9
Goal -
20% of revenue from innovation
Vitality Index
Q1 TTM vitality index 14%
Strong year-on-year revenue growth in key innovations
Elastomeric roof coatings up 100%
Key Paving & Roofing innovations up 92%
IV films up 75%
Reactive SBS for printing plates up 37%
Robust pipeline of new innovation projects |
 Selected Financial Trends –
Q1 2011
(1)
Adjusted EBITDA is GAAP EBITDA excluding restructuring and related charges,
non-cash compensation expenses, and loss on the extinguishment of
debt. 10 |
 Q1
2011 Sales Revenue Walk US $ in millions
11 |
 Q1
2011 Adjusted EBITDA (1)
Walk
US $ in millions
(1)
Adjusted EBITDA is GAAP EBITDA excluding restructuring and related charges,
non-cash compensation expenses, and loss on the extinguishment of
debt. 12 |
 Q1
2011 Financial Overview (1)
Adjusted EBITDA is GAAP EBITDA excluding restructuring and related charges,
non-cash compensation expenses, and loss on the extinguishment of
debt. US $ in Thousands except per share
data
13
Three months Ended
Three months Ended
Three months Ended
3/31/2011
12/31/2010
3/31/2010
Sales Volume (kt)
81
67
73
Total Operating Revenues
$
344,828
$
288,165
$
272,732 Cost of Goods Sold
257,977
228,793
203,605
Gross Profit
86,851
59,372
69,127
Operating expenses
Research and Development
6,602
5,947
5,984
Selling, General and Administrative
27,171
23,652
22,062
Depreciation and Amortization of Identifiable Intangibles
14,626
13,178
11,046
Loss on Extinguishment of Debt
2,985
-
-
Equity in Earnings of Unconsolidated Joint Venture
141
170
74
Interest Expense, net
11,181
5,506
6,064
Income Before Income Taxes
24,427
11,259
24,045
Income Tax Expense
2,550
960
4,250
Net Income
$
21,877
$
10,299
$
19,795 Earnings per Common Share -
Diluted
$
0.68
$
0.32
$
0.64 Adjusted EBITDA
(1)
$
56,018
$
34,312
$
42,622 |
 US $
in millions 14
Cash at quarter end of $36
million.
Net Debt-to-Capitalization
ratio of 41.5% at quarter
end.
Net Debt to TTM Adjusted
EBITDA was 1.70x at
3/31/11.
(1)
Net debt is equal to Long-term debt, less Cash and Cash equivalents.
Balance Sheet |
 Selected 2011 Estimates
Working capital (excluding cash) as a % of
revenue
25% to 27%
Capital spending
$80 to $85 million
Interest expense
(1)
~$31 million
Research & development
~$27 million
SG&A
~ $100 million
Depreciation and amortization
~$61 million
Book tax rate
~9%
15
(1)
Includes accelerated write-off of deferred financing costs associated with the debt
refinancing of $5 million. |
 May
5, 2011 Appendix
*
*
*
*
*
*
*
* |
 Reconciliation of Net Income to EBITDA and
Adjusted EBITDA
17
US $ in Thousands
Three months Ended
Three months Ended
Three months Ended
3/31/2011
12/31/2010
3/31/2010
Net Income
$
21,877
$
10,299
$
19,795 Add(deduct):
Interest expense, net
11,181
5,506
6,064
Income tax expense
2,550
960
4,250
Depreciation and amortization expenses
14,626
13,178
11,046
EBITDA
(1)
$
50,234
$
29,943
$
41,155 EBITDA
(1)
$
50,234
$
29,943
$
41,155 Add:
Restructuring and related charges
1,505
3,733
135
Other non-cash expenses
1,294
636
1,332
Gain on extinguishment of debt
2,985
-
-
Adjusted EBITDA
(2)
$
56,018
$
34,312
$
42,622 Restructuring and related detail:
Selling, general and administrative
1,505
3,733
135
Total restructuring and related charges
$
1,505
$
3,733
$
135 |
 May
5, 2011 Kraton Performance Polymers, Inc.
First Quarter 2011 Earnings Conference Call
*
*
*
*
*
*
*
*
* |