Attached files
| file | filename |
|---|---|
| 8-K - FORM 8-K - PUBLIC SERVICE ELECTRIC & GAS CO | d8k.htm |
| EX-99.1 - SLIDESHOW PRESENTATION - PUBLIC SERVICE ELECTRIC & GAS CO | dex991.htm |
EXHIBIT 99

|
Investor News | NYSE:PEG |
For further information, contact:
| • Kathleen A. Lally, Vice President – Investor Relations |
Phone: 973-430-6565 | |
| • Carlotta Chan Lane, Manager – Investor Relations |
Phone: 973-430-6596 |
May 5, 2011
PSEG ANNOUNCES 2011 FIRST QUARTER RESULTS
$0.91 PER SHARE FROM CONTINUING OPERATIONS
$0.85 PER SHARE OF OPERATING EARNINGS
Company Maintains 2011 Operating Earnings Guidance of $2.50-2.75 Per Share
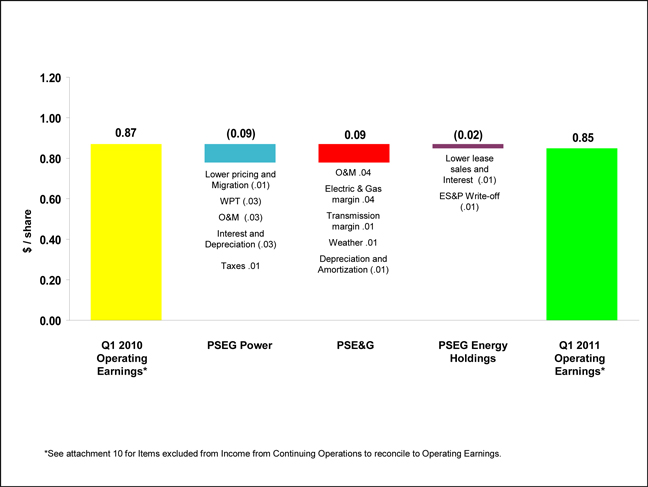
Public Service Enterprise Group (PSEG) reported today Income from Continuing Operations for the first quarter of 2011 of $462 million or $0.91 per share as compared to Income from Continuing Operations of $498 million or $0.99 per share in the first quarter of 2010. Including Income from Discontinued Operations, and gain on sale ($64 million or $0.13 per share), PSEG reported Net Income for the first quarter of 2011 of $526 million or $1.04 per share compared to Net Income for the first quarter of 2010 of $491 million or $0.97 per share. Operating Earnings for the first quarter of 2011 were $431 million or $0.85 per share compared to Operating Earnings in the first quarter of 2010 of $439 million or $0.87 per share.
“We are managing well in difficult market conditions”, said Ralph Izzo, chairman, president and chief executive officer of PSEG. He went on to say “our employees’ on-going commitment to reliability and safety has supported operations in the face of severe winter weather conditions. In addition, our teams worked round-the-clock to verify the effectiveness of all procedures and equipment in place to respond to natural disasters following the earthquake-and-tsunami related damage at the Fukushima nuclear plant in Japan”.
PSEG believes that the non-GAAP financial measure of “Operating Earnings” provides a consistent and comparable measure of performance of its businesses to help shareholders understand performance trends. Operating Earnings exclude the impact of returns/(losses) associated with NDT and MTM accounting. The table below provides a reconciliation of PSEG’s Net Income to Operating Earnings (a non-GAAP measure) for the first quarter. See Attachment 10 for a complete list of items excluded from Income from Continuing Operations in the determination of Operating Earnings.
PSEG CONSOLIDATED EARNINGS (unaudited)
First Quarter Comparative Results
2011 and 2010
| Income ($millions) |
Diluted Earnings Per Share |
|||||||||||||||
| 2011 | 2010 | 2011 | 2010 | |||||||||||||
| Operating Earnings |
$ | 431 | $ | 439 | $ | 0.85 | $ | 0.87 | ||||||||
| Reconciling Items |
31 | 59 | 0.06 | 0.12 | ||||||||||||
| Income from Continuing Operations |
$ | 462 | $ | 498 | $ | 0.91 | $ | 0.99 | ||||||||
| Income/(Loss) Discontinued Operations |
64 | (7 | ) | 0.13 | (0.02 | ) | ||||||||||
| Net Income |
$ | 526 | $ | 491 | $ | 1.04 | $ | 0.97 | ||||||||
| Avg. Shares | 507M | 507M | ||||||||||||||
In discussing the outlook for 2011, Izzo said “we continue to forecast operating earnings for 2011 of $2.50 - $2.75 per share. Although there are signs of economic recovery, a decline in contracted energy and capacity prices from year ago levels beginning in the second quarter will have an impact on operating earnings for the full year. A strong balance sheet, investment in projects that realize reasonable returns and a focus on operations will all support long-term results.”
The following table outlines continued expectations for operating earnings in 2011 by subsidiary:
2011 Operating Earnings Guidance
($ millions, except EPS)
| 2011E | ||
| PSEG Power |
$765-$855 | |
| PSE&G |
495-520 | |
| PSEG Energy Holdings |
0-5 | |
| PSEG Parent |
5-15 | |
| Operating Earnings |
$1,265-$1,395 | |
| Earnings Per Share |
$2.50-$2.75 |
Operating Earnings Review by Subsidiary
See Attachment 5 for detail regarding the quarter-over-quarter reconciliations for each of PSEG’s businesses.
PSEG Power
PSEG Power reported operating earnings of $267 million ($0.53 per share) for the first quarter of 2011 compared with operating earnings of $312 million ($0.62 per share) for the first quarter of 2010.
A decline in dark spreads reduced the dispatch levels of Power’s coal fleet by 21% during the quarter; output from the nuclear fleet rose 2% as volume from the combined cycle fleet grew by 8%. Higher realized pricing within PJM offset the impact on earnings from an increase in customer migration away from the BGS contract. The total decline in generation volume of 1%, as well as lower pricing in non-PJM markets reduced results by $0.01 per share. The erosion in margin on certain wholesale electric energy supply contracts that Power supplies from the market also reduced results in the quarter by $0.03 per share. An increase in operating and maintenance expense associated with planned maintenance of the combined cycle fleet reduced results by $0.03 per share. An increase in depreciation expense and a decline in capitalized interest associated with the commercial operation of the back-end technology on the Hudson and Mercer coal stations reduced results by $0.03 per share. The absence of a Healthcare related tax charge in the year ago period improved results by $0.01 per share.
PSEG Power’s nuclear fleet operated at an average capacity factor of 99% during the first quarter of 2011 compared to an average capacity factor of 97% in the year ago quarter. Power’s nuclear operating team, in response to the March 11 earthquake and tsunami in Japan, has accommodated numerous local, state and federal requests for information on the effectiveness of the nuclear reactor design and emergency procedures in place at the Salem and Hope Creek nuclear reactors as part of its on-going community outreach to ensure public trust in our ability to operate the units in a safe,
reliable manner. Power expects to hear from the Nuclear Regulatory Commission (NRC) later this summer on its request to extend the licenses at the Salem and Hope Creek reactors.
Power has hedged increased amounts of its generation. For the balance of the year, Power’s base-load output is fully hedged at an average price of $68 per MWh; with additional hedges in place on intermediate generation, approximately 75%-80% of total expected generation for that period is hedged at an average price of $68 per MWh. Power’s total generation for 2011 is forecast to be 53 TWh. For 2012, hedges are in place for approximately 60%-70% of expected base-load generation of 36 TWh at an average price of $66 per MWh resulting in approximately 40%-50% of expected total 2012 generation of 54 TWh hedged at an average price of $66 per MWh. For 2013, approximately 25% of anticipated base-load output of 36 TWh is hedged at an average price of $69 per MWh which results in hedges on approximately 10%-20% of estimated total generation of 56 TWh at an average price of $69 per MWh.
PSE&G
PSE&G reported operating earnings of $163 million ($0.32 per share) for the first quarter of 2011 compared with operating earnings of $117 million ($0.23 per share) for the first quarter of 2010.
PSE&G’s results in the quarter were influenced by higher rates, an increase in investment and a decline in operating and maintenance expense. An increase in electric and gas rates that went into effect on June 7, 2010 and July 9, 2010, respectively, added $0.02 per share to results. An annualized increase in transmission revenue of $45 million effective on January 1, 2011 added $0.01 per share to results. An increase in demand aided results by $0.01 per share. Colder winter weather – which was also colder than normal – improved results by $0.01 per share. An increase in revenues associated with investments in capital infrastructure and renewables added $0.01 per share to earnings. PSE&G’s quarterly results also benefited from a decline in pension expense and the absence of storm related costs experienced in the year ago quarter. These items combined to improve results by $0.04 per share. An increase in depreciation expense reduced results by $0.01 per share.
PSE&G experienced a slight increase in weather-normalized electric sales of 0.3% during the quarter. The results were influenced by sales growth of 1% in the commercial sector. Weather-normalized sales to gas customers increased 1.6% during the quarter with growth of 1.4% experienced in the commercial and industrial sector as demand by residential customers grew 1.8% during the quarter.
PSE&G is awaiting New Jersey Board of Public Utilities approval of its request to increase investment in electric and gas distribution capital infrastructure and energy efficiency of approximately $400 million.
PSEG Energy Holdings
PSEG Energy Holdings reported a loss of $3 million ($0.01 per share) for the first quarter of 2011 versus operating earnings of $7 million ($0.01 per share) during the first quarter of 2010. The results reflect the absence of a gain on the sale of a lease in the year-ago period of $0.01 per share. During the quarter, Holdings also wrote-off its investment in the Energy Storage & Power joint venture. Low gas prices and a narrow spread between peak and off-peak power prices have reduced the economics associated with the investment in compressed air energy storage.
######
FORWARD-LOOKING STATEMENT
Readers are cautioned that statements contained in this presentation about our and our subsidiaries’ future performance, including future revenues, earnings, strategies, prospects, consequences and all other statements that are not purely historical, are forward-looking statements for purposes of the safe harbor provisions under The Private Securities Litigation Reform Act of 1995. When used herein, the words “anticipate”, “intend”, “estimate”, “believe”, “expect”, “plan”, “should”, “hypothetical”, “potential”, “forecast”, “project”, variations of such words and similar expressions are intended to identify forward-looking statements. Although we believe that our expectations are based on reasonable assumptions, they are subject to risks and uncertainties and we can give no assurance they will be achieved. The results or developments projected or predicted in these statements may differ materially from what may actually occur. Factors which could cause results or events to differ from current expectations include, but are not limited to:
| • | adverse changes in energy industry law, policies and regulation, including market structures and a potential shift away from competitive markets toward subsidized market mechanisms, transmission planning and cost allocation rules, including rules regarding how transmission is planned and who is permitted to build transmission going forward, and reliability standards, |
| • | any inability of our transmission and distribution businesses to obtain adequate and timely rate relief and regulatory approvals from federal and state regulators, |
| • | changes in federal and state environmental regulations that could increase our costs or limit operations of our generating units, |
| • | changes in nuclear regulation and/or general developments in the nuclear power industry, including various impacts from any accidents or incidents experienced at our facilities or by others in the industry that could limit operations of our nuclear generating units, |
| • | actions or activities at one of our nuclear units located on a multi-unit site that might adversely affect our ability to continue to operate that unit or other units located at the same site, |
| • | any inability to balance our energy obligations, available supply and trading risks, |
| • | any deterioration in our credit quality, or the credit quality of our counterparties, |
| • | availability of capital and credit at commercially reasonable terms and conditions and our ability to meet cash needs, |
| • | any inability to realize anticipated tax benefits or retain tax credits, |
| • | changes in the cost of, or interruption in the supply of, fuel and other commodities necessary to the operation of our generating units, |
| • | delays in receipt of necessary permits and approvals for our construction and development activities, |
| • | delays or unforeseen cost escalations in our construction and development activities, |
| • | adverse changes in the demand for or price of the capacity and energy that we sell into wholesale electricity markets, |
| • | increase in competition in energy markets in which we compete, |
| • | challenges associated with retention of a qualified workforce, |
| • | adverse performance of our decommissioning and defined benefit plan trust fund investments and changes in discount rates and funding requirements, and |
| • | changes in technology and customer usage patterns. |
For further information, please refer to our Annual Report on Form 10-K, including Item 1A. Risk Factors, and subsequent reports on Form 10-Q and Form 8-K filed with the Securities and Exchange Commission. These documents address in further detail our business, industry issues and other factors that could cause actual results to differ materially from those indicated in this presentation. In addition, any forward-looking statements included herein represent our estimates only as of today and should not be relied upon as representing our estimates as of any subsequent date. While we may elect to update forward-looking statements from time to time, we specifically disclaim any obligation to do so, even if our internal estimates change, unless otherwise required by applicable securities laws.
Attachment 1
PUBLIC SERVICE ENTERPRISE GROUP INCORPORATED
Operating Earnings and Per Share Results by Subsidiary
(Unaudited)
| For the Three March 31, |
||||||||
| 2011 | 2010 | |||||||
| Earnings Results ($ Millions) | ||||||||
| PSEG Power |
$ | 267 | $ | 312 | ||||
| PSE&G |
163 | 117 | ||||||
| PSEG Energy Holdings |
(3 | ) | 7 | |||||
| PSEG |
4 | 3 | ||||||
| Operating Earnings |
$ | 431 | $ | 439 | ||||
| Reconciling Items(a) |
31 | 59 | ||||||
| Income from Continuing Operations |
$ | 462 | $ | 498 | ||||
| Discontinued Operations |
64 | (7 | ) | |||||
| Net Income |
$ | 526 | $ | 491 | ||||
| Fully Diluted Average Shares Outstanding (in Millions) |
507 | 507 | ||||||
| Per Share Results (Diluted) | ||||||||
| PSEG Power |
$ | 0.53 | $ | 0.62 | ||||
| PSE&G |
0.32 | 0.23 | ||||||
| PSEG Energy Holdings |
(0.01 | ) | 0.01 | |||||
| PSEG |
0.01 | 0.01 | ||||||
| Operating Earnings |
$ | 0.85 | $ | 0.87 | ||||
| Reconciling Items(a) |
0.06 | 0.12 | ||||||
| Income from Continuing Operations |
$ | 0.91 | $ | 0.99 | ||||
| Discontinued Operations |
0.13 | (0.02 | ) | |||||
| Net Income |
$ | 1.04 | $ | 0.97 | ||||
| (a) | See attachment 10 for details of items excluded from Income from Continuing Operations to compute Operating Earnings. |
Note:
Income from Continuing Operations includes preferred stock dividends relating to PSE&G of $1 million for the three months ended March 31, 2010.
Attachment 2
PUBLIC SERVICE ENTERPRISE GROUP INCORPORATED
Consolidating Statements of Operations
(Unaudited, $ Millions)
| For the Three Months Ended March 31, 2011 | ||||||||||||||||||||
| PSEG | OTHER (a) | PSEG POWER |
PSE&G | PSEG ENERGY HOLDINGS |
||||||||||||||||
| OPERATING REVENUES |
$ | 3,354 | $ | (939 | ) | $ | 1,967 | $ | 2,306 | $ | 20 | |||||||||
| OPERATING EXPENSES |
||||||||||||||||||||
| Energy Costs |
1,563 | (938 | ) | 1,135 | 1,366 | — | ||||||||||||||
| Operation and Maintenance |
651 | (10 | ) | 277 | 368 | 16 | ||||||||||||||
| Depreciation and Amortization |
241 | 4 | 54 | 179 | 4 | |||||||||||||||
| Taxes Other Than Income Taxes |
43 | — | — | 43 | — | |||||||||||||||
| Total Operating Expenses |
2,498 | (944 | ) | 1,466 | 1,956 | 20 | ||||||||||||||
| OPERATING INCOME |
856 | 5 | 501 | 350 | — | |||||||||||||||
| Income from Equity Method Investments |
3 | — | — | — | 3 | |||||||||||||||
| Other Income and Deductions |
63 | — | 58 | 4 | 1 | |||||||||||||||
| Other Than Temporary Impairments |
(4 | ) | (1 | ) | (2 | ) | (1 | ) | — | |||||||||||
| Interest Expense |
(127 | ) | 4 | (51 | ) | (79 | ) | (1 | ) | |||||||||||
| INCOME FROM CONTINUING OPERATIONS BEFORE INCOME TAXES (b) |
791 | 8 | 506 | 274 | 3 | |||||||||||||||
| Income Tax Expense |
(329 | ) | (4 | ) | (208 | ) | (111 | ) | (6 | ) | ||||||||||
| INCOME (LOSS) FROM CONTINUING OPERATIONS |
462 | 4 | 298 | 163 | (3 | ) | ||||||||||||||
| Discontinued Operations, net of tax |
64 | — | 64 | — | — | |||||||||||||||
| NET INCOME (LOSS) |
$ | 526 | $ | 4 | $ | 362 | $ | 163 | $ | (3 | ) | |||||||||
| Income (Loss) from Continuing Operations |
$ | 462 | $ | 4 | $ | 298 | $ | 163 | $ | (3 | ) | |||||||||
| Less: Reconciling Items Excluded from Continuing Operations (C): |
31 | — | 31 | — | — | |||||||||||||||
| OPERATING EARNINGS |
$ | 431 | $ | 4 | $ | 267 | $ | 163 | $ | (3 | ) | |||||||||
| For the Three Months Ended March 31, 2010 | ||||||||||||||||||||
| PSEG | OTHER (a) | PSEG POWER |
PSE&G | PSEG ENERGY HOLDINGS |
||||||||||||||||
| OPERATING REVENUES |
$ | 3,573 | $ | (1,103 | ) | $ | 2,196 | $ | 2,444 | $ | 36 | |||||||||
| OPERATING EXPENSES |
||||||||||||||||||||
| Energy Costs |
1,688 | (1,103 | ) | 1,251 | 1,540 | — | ||||||||||||||
| Operation and Maintenance |
670 | (8 | ) | 251 | 414 | 13 | ||||||||||||||
| Depreciation and Amortization |
227 | 4 | 43 | 177 | 3 | |||||||||||||||
| Taxes Other Than Income Taxes |
42 | — | — | 42 | — | |||||||||||||||
| Total Operating Expenses |
2,627 | (1,107 | ) | 1,545 | 2,173 | 16 | ||||||||||||||
| OPERATING INCOME |
946 | 4 | 651 | 271 | 20 | |||||||||||||||
| Income from Equity Method Investments |
3 | — | — | — | 3 | |||||||||||||||
| Other Income and Deductions |
27 | (3 | ) | 25 | 4 | 1 | ||||||||||||||
| Other Than Temporary Impairments |
(1 | ) | — | (1 | ) | — | — | |||||||||||||
| Interest Expense |
(116 | ) | 3 | (40 | ) | (77 | ) | (2 | ) | |||||||||||
| Preferred Stock Dividends |
— | 1 | — | (1 | ) | — | ||||||||||||||
| INCOME FROM CONTINUING OPERATIONS BEFORE INCOME TAXES (b) |
859 | 5 | 635 | 197 | 22 | |||||||||||||||
| Income Tax Expense |
(361 | ) | (2 | ) | (264 | ) | (80 | ) | (15 | ) | ||||||||||
| INCOME (LOSS) FROM CONTINUING OPERATIONS |
498 | 3 | 371 | 117 | 7 | |||||||||||||||
| Discontinued Operations, net of tax |
(7 | ) | — | (7 | ) | — | — | |||||||||||||
| NET INCOME |
$ | 491 | $ | 3 | $ | 364 | $ | 117 | $ | 7 | ||||||||||
| Income (Loss) from Continuing Operations |
$ | 498 | $ | 3 | $ | 371 | $ | 117 | $ | 7 | ||||||||||
| Less: Reconciling Items Excluded from Continuing Operations (C): |
59 | — | 59 | — | — | |||||||||||||||
| OPERATING EARNINGS |
$ | 439 | $ | 3 | $ | 312 | $ | 117 | $ | 7 | ||||||||||
| (a) | Primarily includes financing activities and donations at the parent and intercompany eliminations. |
| (b) | Income from Continuing Operations before Income Taxes includes preferred stock dividends relating to PSE&G of $1 million for the three months ended March 31, 2010. |
| (c) | See attachment 10 for details of items excluded from Income from Continuing Operations to compute Operating Earnings. |
Attachment 3
PUBLIC SERVICE ENTERPRISE GROUP INCORPORATED
Capitalization Schedule
(Unaudited, $ Millions)
| March 31, 2011 |
December 31, 2010 |
|||||||
| DEBT |
||||||||
| Commercial Paper and Loans |
$ | 21 | $ | 64 | ||||
| Long-Term Debt |
7,742 | 7,748 | ||||||
| Securitization Debt |
1,099 | 1,145 | ||||||
| Project Level, Non-Recourse Debt |
46 | 47 | ||||||
| Total Debt |
8,908 | 9,004 | ||||||
| STOCKHOLDERS’ EQUITY |
||||||||
| Common Stock |
4,813 | 4,807 | ||||||
| Treasury Stock |
(597 | ) | (593 | ) | ||||
| Retained Earnings |
5,928 | 5,575 | ||||||
| Accumulated Other Comprehensive Loss |
(187 | ) | (156 | ) | ||||
| Total Common Stockholders’ Equity |
9,957 | 9,633 | ||||||
| Noncontrolling Interests - Equity Investments |
2 | 8 | ||||||
| Total Equity |
9,959 | 9,641 | ||||||
| Total Capitalization |
$ | 18,867 | $ | 18,645 | ||||
Attachment 4
PUBLIC SERVICE ENTERPRISE GROUP INCORPORATED
CONDENSED CONSOLIDATED STATEMENTS OF CASH FLOWS
(Unaudited, $ Millions)
| For the Three Months Ended March 31, | ||||||||
| 2011 | 2010 | |||||||
| CASH FLOWS FROM OPERATING ACTIVITIES |
||||||||
| Net Income |
$ | 526 | $ | 491 | ||||
| Adjustments to Reconcile Net Income to Net Cash Flows From Operating Activities |
516 | 581 | ||||||
| NET CASH PROVIDED BY OPERATING ACTIVITIES |
1,042 | 1,072 | ||||||
| NET CASH USED IN INVESTING ACTIVITIES |
(155 | ) | (318 | ) | ||||
| NET CASH USED IN FINANCING ACTIVITIES |
(267 | ) | (792 | ) | ||||
| Net Increase (Decrease) in Cash and Cash Equivalents |
620 | (38 | ) | |||||
| Cash and Cash Equivalents at Beginning of Period |
280 | 350 | ||||||
| Cash and Cash Equivalents at End of Period |
$ | 900 | $ | 312 | ||||
Attachment 5
PUBLIC SERVICE ENTERPRISE GROUP INCORPORATED
Quarter-over-Quarter EPS Reconciliation
March 31, 2011 vs. March 31, 2010
(Unaudited)
Attachment 6
PSEG POWER LLC
Generation Measures
(Unaudited)
| GWhr Breakdown | ||||||||
| Three Months March 31, |
||||||||
| 2011 | 2010 | |||||||
| Nuclear - NJ |
5,465 | 5,344 | ||||||
| Nuclear - PA |
2,463 | 2,437 | ||||||
| Total Nuclear |
7,928 | 7,781 | ||||||
| Fossil - Coal - NJ* |
728 | 1,129 | ||||||
| Fossil - Coal - PA |
1,377 | 1,431 | ||||||
| Fossil - Coal - CT |
207 | 361 | ||||||
| Total Coal |
2,312 | 2,921 | ||||||
| Fossil - Oil & Natural Gas - NJ |
2,753 | 2,671 | ||||||
| Fossil - Oil & Natural Gas - NY |
1,026 | 855 | ||||||
| Fossil - Oil & Natural Gas - CT |
11 | 4 | ||||||
| Total Oil & Natural Gas |
3,790 | 3,530 | ||||||
| 14,030 | 14,232 | |||||||
| % Generation by Fuel Type |
||||||||
| Three Months March 31, |
||||||||
| 2011 | 2010 | |||||||
| Nuclear - NJ |
39 | % | 38 | % | ||||
| Nuclear - PA |
18 | % | 17 | % | ||||
| Total Nuclear |
57 | % | 55 | % | ||||
| Fossil - Coal - NJ* |
5 | % | 8 | % | ||||
| Fossil - Coal - PA |
10 | % | 10 | % | ||||
| Fossil - Coal - CT |
1 | % | 2 | % | ||||
| Total Coal |
16 | % | 20 | % | ||||
| Fossil - Oil & Natural Gas - NJ |
20 | % | 19 | % | ||||
| Fossil - Oil & Natural Gas - NY |
7 | % | 6 | % | ||||
| Fossil - Oil & Natural Gas - CT |
0 | % | 0 | % | ||||
| Total Oil & Natural Gas |
27 | % | 25 | % | ||||
| 100 | % | 100 | % | |||||
| * | Includes Pumped Storage. Pumped Storage accounted for <1% of total generation for the three months ended March 31, 2011 and 2010. |
Attachment 7
PUBLIC SERVICE ELECTRIC & GAS COMPANY
Retail Sales and Revenues
(Unaudited)
March 31, 2011
Electric Sales and Revenues
| Three Months Ended |
Change vs. 2010 |
|||||||
| Sales (millions kwh) |
||||||||
| Residential |
3,228 | 1.9 | % | |||||
| Commercial & Industrial |
7,007 | 0.5 | % | |||||
| Street Lighting |
103 | -0.5 | % | |||||
| Interdepartmental |
3 | 2.8 | % | |||||
| Total |
10,341 | 0.9 | % | |||||
| Revenue (in millions) |
||||||||
| Residential |
$ | 551 | 2.6 | % | ||||
| Commercial & Industrial |
527 | -8.5 | % | |||||
| Street Lighting |
20 | -0.7 | % | |||||
| Other Operating Revenues* |
89 | -4.4 | % | |||||
| Total |
$ | 1,187 | -3.2 | % | ||||
| Weather Data |
Three Months Ended |
Change vs. 2010 |
||||||
| THI Hours - Actual |
20 | N/A | ** | |||||
| THI Hours - Normal |
32 | |||||||
| * | Primarily sales of Non-Utility Generator energy to PJM and Transmission related revenues. |
| ** | There were 0 THI Actual hours for 2010. |
Attachment 8
PUBLIC SERVICE ELECTRIC & GAS COMPANY
Retail Sales and Revenues
(Unaudited)
March 31, 2011
Gas Sold and Transported
| Three Months Ended |
Change vs. 2010 |
|||||||
| Sales (millions therms) |
||||||||
| Residential Sales |
670 | 3.9 | % | |||||
| Commercial & Industrial - Firm Sales |
246 | 1.4 | % | |||||
| Commercial & Industrial - Interr. & Cogen |
35 | -0.5 | % | |||||
| Total |
951 | 3.1 | % | |||||
| Gas Transported - Firm Sales |
239 | 20.4 | % | |||||
| Gas Transported - Non-Firm |
229 | 13.2 | % | |||||
| Revenue (in millions) |
||||||||
| Residential Sales |
$ | 417 | -21.7 | % | ||||
| Commercial & Industrial - Firm Sales |
159 | -12.5 | % | |||||
| Commercial & Industrial - Interr. & Cogen |
20 | -12.3 | % | |||||
| Other Operating Revenues* |
36 | -3.8 | % | |||||
| Total |
$ | 632 | -18.4 | % | ||||
| Gas Transported |
487 | 9.7 | % | |||||
| Weather Data |
Three Months Ended |
Change vs. 2010 |
||||||
| Degree Days - Actual |
2,559 | 5.6 | % | |||||
| Degree Days - Normal |
2,513 | |||||||
| * | Primarily Appliance Service. |
Attachment 9
PUBLIC SERVICE ENTERPRISE GROUP INCORPORATED
Statistical Measures
(Unaudited)
| For the Three Months Ended March 31 |
||||||||
| 2011 | 2010 | |||||||
| Weighted Average Common Shares Outstanding (000’s) |
||||||||
| Basic |
505,979 | 505,950 | ||||||
| Diluted |
507,132 | 507,147 | ||||||
| Stock Price at End of Period |
$ | 31.51 | $ | 29.52 | ||||
| Dividends Paid per Share of Common Stock |
$ | 0.3425 | $ | 0.3425 | ||||
| Dividend Payout Ratio* |
44.2 | % | 44.7 | % | ||||
| Dividend Yield |
4.3 | % | 4.5 | % | ||||
| Price/Earnings Ratio* |
10.2 | 9.8 | ||||||
| Rate of Return on Average Common Equity* |
16.7 | % | 17.6 | % | ||||
| Book Value per Common Share |
$ | 19.68 | $ | 18.19 | ||||
| Market Price as a Percent of Book Value |
160 | % | 162 | % | ||||
| Total Shareholder Return |
0.13 | % | -10.23 | % | ||||
| * | Calculation based on Operating Earnings for the 12 month period ended |
Attachment 10
PUBLIC SERVICE ENTERPRISE GROUP INCORPORATED
Reconciling Items Excluded from Continuing Operations to Compute Operating Earnings
(Unaudited)
| For the Three Months Ended |
||||||||
| March 31, | ||||||||
| Pro-forma Adjustments, net of tax |
2011 | 2010 | ||||||
| Earnings Impact ($ Millions) | ||||||||
| Gain (Loss) on Nuclear Decommissioning Trust (NDT) Fund Related Activity (PSEG Power) |
$ | 27 | $ | 10 | ||||
| Gain (Loss) on Mark-to-Market (MTM) (PSEG Power) |
4 | 49 | ||||||
| Total Pro-forma adjustments |
$ | 31 | $ | 59 | ||||
| Fully Diluted Average Shares Outstanding (in Millions) |
507 | 507 | ||||||
| Per Share Impact (Diluted) | ||||||||
| Gain (Loss) on NDT Fund Related Activity (PSEG Power) |
$ | 0.05 | $ | 0.02 | ||||
| Gain (Loss) on MTM (PSEG Power) |
0.01 | 0.10 | ||||||
| Total Pro-forma adjustments |
$ | 0.06 | $ | 0.12 | ||||