Attached files
| file | filename |
|---|---|
| 8-K - FORM 8-K - PPL ELECTRIC UTILITIES CORP | form8k.htm |
| EX-99.1 - EXHIBIT 99.1 - PPL ELECTRIC UTILITIES CORP | form8k-exhibit99_1.htm |

1
© PPL Corporation 2011
PPL Corporation
1st Quarter Earnings Call
May 5, 2011
May 5, 2011
Exhibit 99.2

2
© PPL Corporation 2011
Any statements made in this presentation about future operating
results or other future events are forward-looking statements under
the Safe Harbor Provisions of the Private Securities Litigation Reform
Act of 1995. Actual results may differ materially from such forward-
looking statements. A discussion of factors that could cause actual
results or events to vary is contained in the Appendix to this
presentation and in the Company’s SEC filings.
Cautionary Statements and Factors
That May Affect Future Results
That May Affect Future Results

3
© PPL Corporation 2011
J. H. Miller
W. H. Spence
P. A. Farr
Agenda
First Quarter 2011 Earnings and Outlook
Segment Results and Financial Overview
Operational Review
Q&A
4
© PPL Corporation 2011
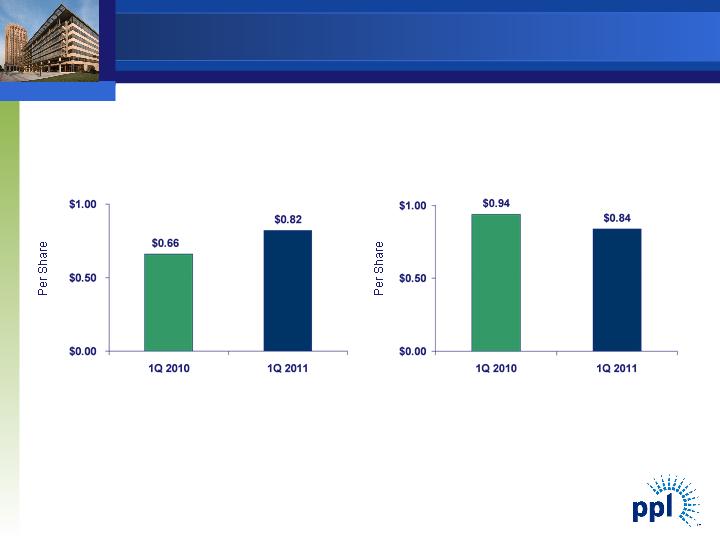
First Quarter
Reported Earnings
First Quarter
Earnings from Ongoing Operations
Note: See Appendix for the reconciliation of earnings from ongoing operations to reported earnings.
Strong Earnings Results
Strong Earnings Results $0.82$0.66$0.00$0.50$1.001Q 20101Q 2011 $0.94$0.84$0.00$0.50$1.001Q 20101Q 2011 First Quarter Reported Earnings First Quarter Earnings from Ongoing Operations Per Share Per Share Note: See Appendix for the reconciliation of earnings from ongoing operations to reported earnings
5
© PPL Corporation 2011
$3.13
$2.75
$/Share
(1) Based on mid-point of forecasted earnings range.
Note: See appendix for reconciliation of earnings from ongoing operations to reported earnings.
(1)
$2.50
2010A
2011E
$2.60
$2.40
2011 Earnings from Ongoing Operations Forecast

6
© PPL Corporation 2011
|
|
Q1
|
|
Q1
|
|
|
|
|
2011
|
|
2010
|
|
Change
|
|
Kentucky Regulated
|
$0.15
|
|
$ -
|
|
$0.15
|
|
International Regulated
|
0.16
|
|
0.20
|
|
(0.04)
|
|
Pennsylvania Regulated
|
0.11
|
|
0.10
|
|
0.01
|
|
Supply
|
0.42
|
|
0.64
|
|
(0.22)
|
|
Total
|
$0.84
|
|
$0.94
|
|
($0.10)
|
|
|
|
|
|
|
|
|
|
|
|
|
|
|
|
Note: See Appendix for the reconciliation of earnings from ongoing operations to reported earnings.
|
Ongoing Earnings Overview

7
© PPL Corporation 2011
|
Note: See Appendix for the reconciliation of earnings from ongoing operations to reported earnings.
|
|
|
1st Quarter
|
|
|
2010 EPS - Ongoing Earnings
|
|
$0.20
|
|
Delivery Revenue
|
0.03
|
|
|
Financing
|
(0.02)
|
|
|
Income Taxes & Other
|
(0.01)
|
|
|
Dilution
|
(0.04)
|
|
|
Total
|
|
(0.04)
|
|
2011 EPS - Ongoing Earnings
|
|
$0.16
|
International Regulated Segment
Earnings Drivers
Earnings Drivers

8
© PPL Corporation 2011
|
Note: See Appendix for the reconciliation of earnings from ongoing operations to reported earnings.
|
|
|
1st Quarter
|
|
|
2010 EPS - Ongoing Earnings
|
|
$0.10
|
|
Electric Delivery Margins
|
0.04
|
|
|
O&M
|
(0.02)
|
|
|
Income Taxes & Other
|
0.02
|
|
|
Dilution
|
(0.03)
|
|
|
Total
|
|
0.01
|
|
2011 EPS - Ongoing Earnings
|
|
$0.11
|
Pennsylvania Regulated Segment
Earnings Drivers
Earnings Drivers

9
© PPL Corporation 2011
|
Note: See Appendix for the reconciliation of earnings from ongoing operations to reported earnings.
|
|
|
1st Quarter
|
|
|
2010 EPS - Ongoing Earnings
|
|
$0.64
|
|
Margins - East
|
(0.11)
|
|
|
O&M
|
-
|
|
|
Income Taxes & Other
|
0.01
|
|
|
Dilution
|
(0.12)
|
|
|
Total
|
|
(0.22)
|
|
2011 EPS - Ongoing Earnings
|
|
$0.42
|
Supply Segment Earnings Drivers
10
© PPL Corporation 2011
Earnings Per Share
Midlands
$0.49
Legacy Ops
$0.08
Other ($0.02)
Margins $0.10
Other ($0.03)
Margins
($0.51)
Taxes
($0.25)
O&M ($0.08)
|
(1) Earnings from ongoing operations.
Note: See Appendix for the reconciliation of earnings from ongoing operations to reported earnings.
|
(1)
(1)
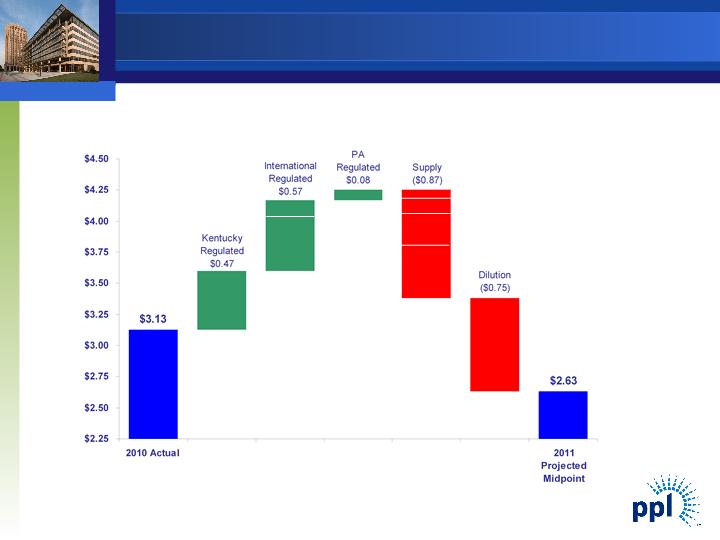
2010 to 2011 Earnings Walk
2010 to 2011 Earnings Walk $2.63 Dilution($0.75) Supply($0.87) International Regulated$0.57 Kentucky Regulated$0.47 PA Regulated$0.08 $3.13 $2.25$2.50$2.75$3.00$3.25$3.50$3.75$4.00$4.25$4.502010 Actual 2011 Projected Midpoint Earnings Per Share Midlands $0.49 Legacy Ops $0.08 Other ($0.02) Margins $0.10 Other ($0.03) Margins ($0.51) Taxes ($0.25) O&M ($0.08) (1) Earnings from ongoing operations Note: See Appendix for the reconciliation of earnings from ongoing operations to reported earnings
11
© PPL Corporation 2011
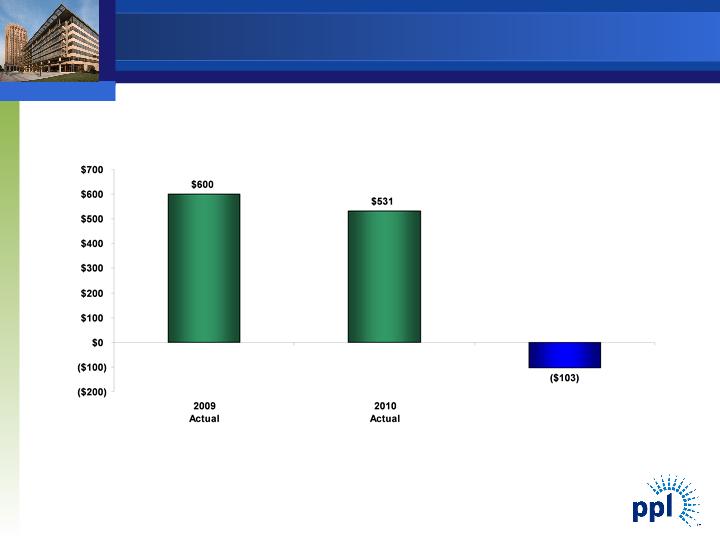
Millions of
Dollars
Dollars
(1) 2010 Free Cash Flow includes two months of the results of the Kentucky Regulated segment.
Note: See Appendix for reconciliation of free cash flow before dividends to cash from operations.
(1)
2011
Forecast
Free Cash Flow before Dividends
12
© PPL Corporation 2011
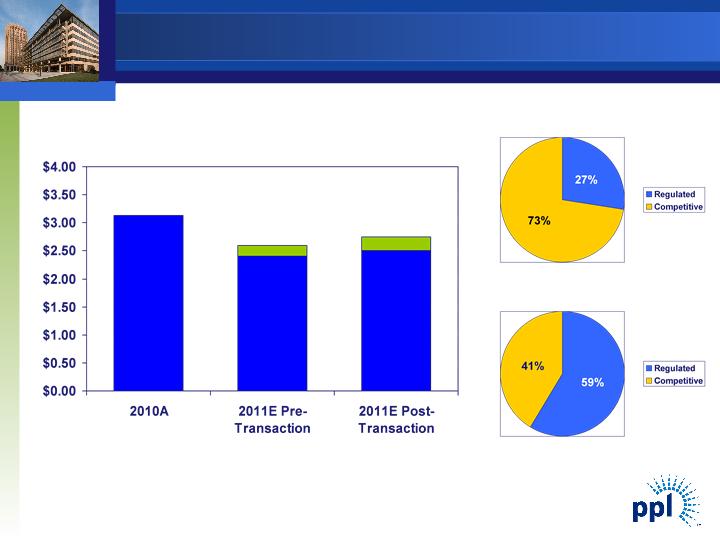
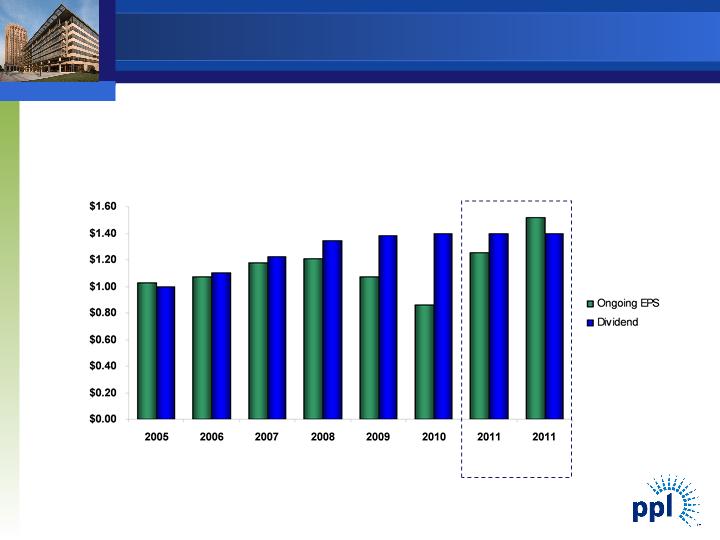
$/Share
Annualized
A significantly more rate-regulated business mix provides strong
support for current dividend and a platform for future growth
(1) Ongoing EPS based on mid-point of forecast. Annualized dividend based on 1st quarter declaration. Actual dividends to
be determined by Board of Directors.
be determined by Board of Directors.
(2) From only regulated segments.
(1)
(2)
(1)
Pre-
Transaction
Transaction
Post-
Transaction
Transaction
Dividend Profile

13
© PPL Corporation 2011
Kentucky Regulated
• Filed Integrated Resource Plan (IRP) with Kentucky PSC on 4/21
• Filed rate case in Virginia on 4/1
Pennsylvania Regulated
• Earned 9th J.D. Power and Associates Award for customer
satisfaction by business customers
satisfaction by business customers
International Regulated Segment
• Completed acquisition of WPD Midlands (formerly Central
Networks)
Networks)
• Integration proceeding as planned
Operational Review
14
© PPL Corporation 2011
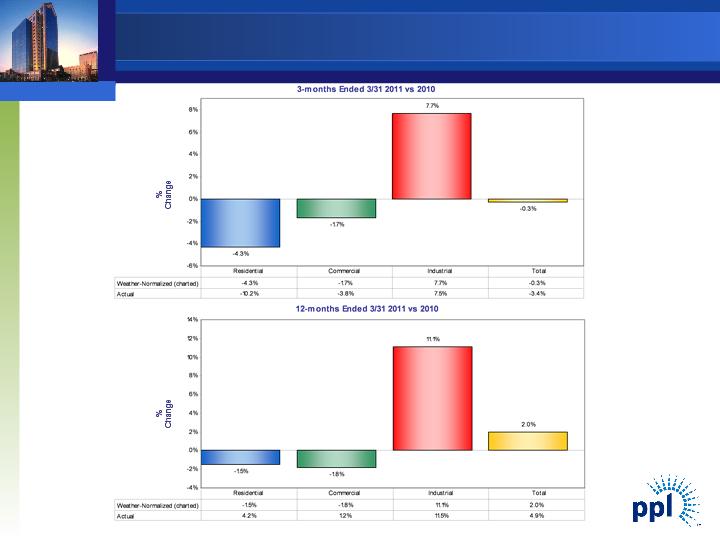
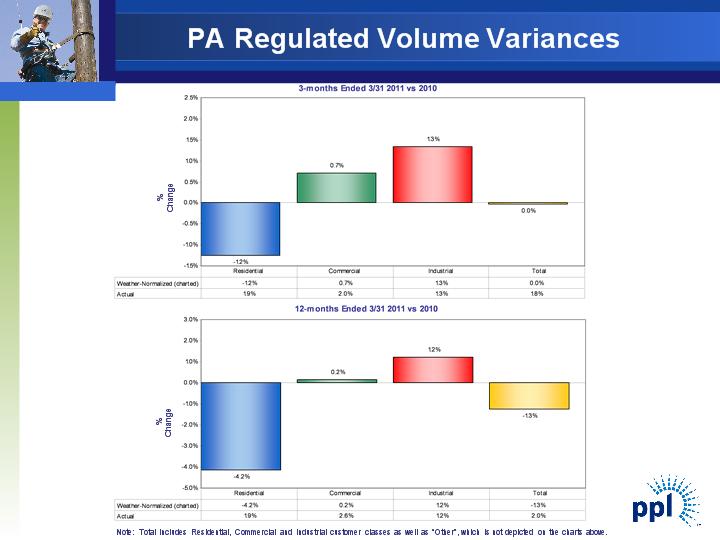
Note: Total includes Residential, Commercial and Industrial customer classes as well as “Other”, which is not depicted on the charts above.
Kentucky Regulated Volume Variances
Kentucky Regulated Volume Variances 12-months Ended 3/31 2011 vs 2010-1.5%-1.8% 11.1% 2.0% -4% -2% 0% 2% 4% 6% 8% 10% 12% 14% Weather-Normalized (charted)-1.5%-1.8%11.1%2.0% Actual4.2%1.2%11.5%4.9% Residential Commercial Industrial Total 3-months Ended 3/31 2011 vs 2010-4.3% -1.7% 7.7% -0.3% -6% -4% -2% 0% 2% 4% 6% 8% Weather-Normalized (charted)-4.3%-1.7%7.7%-0.3% Actual-10.2%-3.8%7.5%-3.4% Residential Commercial Industrial Total % Change % Change Note: Total includes Residential, Commercial and Industrial customer classes as well as “Other”, which is not depicted on the charts above
15
© PPL Corporation 2011
PA Regulated Volume Variances 12-months Ended 3/31 2011 vs 2010-4.2% 0.2% 1.2% -1.3% -5% -4% -3% -2% -1% 0% 1% 2% 3% Weather-Normalized (charted)-4.2%0.2%1.2%-1.3% Actual1.9%2.6%1.2%2.0% Residential Commercial Industrial Total % Change % Change 3-months Ended 3/31 2011 vs 2010-1.2% 0.7% 1.3% 0.0% -2% -1% -1% 0% 1% 1% 2% 2% 3% Weather-Normalized (charted)-1.2%0.7%1.3%0.0% Actual1.9%2.0%1.3%1.8% Residential Commercial Industrial Total Note: Total includes Residential, Commercial and Industrial customer classes as well as “Other”, which is not depicted on the charts above

16
© PPL Corporation 2011
Capacity revenues are expected to be $430 million, $385 million and $590 million for 2011, 2012 and 2013, respectively.
As of March 31, 2011
(1) Represents expected sales based on current business plan assumptions. Amounts do not reflect the impact of the Susquehanna turbine blade inspection/replacement outages.
(2) The 2011 average hedge energy prices are based on the fixed price swaps as of March 31, 2011; the prior collars have all been converted to fixed swaps.
(3) The 2012 ranges of average energy prices for existing hedges were estimated by determining the impact on the existing collars resulting from 2012 power prices at the 5th and 95th percentile
confidence levels.
confidence levels.
(4) Includes three months of actual results.
|
|
|
|
2011(4)
|
|
2012
|
|
|
|
Baseload
|
|
|
|
|
|
|
|
|
Expected Generation(1) (Million MWhs)
|
|
|
50.7
|
|
54.7
|
|
|
|
East
|
|
|
42.5
|
|
46.2
|
|
|
|
West
|
|
|
8.2
|
|
8.5
|
|
|
|
|
|
|
|
|
|
|
|
|
Current Hedges (%)
|
|
|
99%
|
|
86%
|
|
|
|
East
|
|
|
100%
|
|
84%
|
|
|
|
West
|
|
|
97%
|
|
94%
|
|
|
|
|
|
|
|
|
|
|
|
|
Average Hedged Price (Energy Only) ($/MWh)(2) (3)
|
|
|
|
|
|
|
|
|
East
|
|
|
$57
|
|
$55-56
|
|
|
|
West
|
|
|
$54
|
|
$53-54
|
|
|
|
|
|
|
|
|
|
|
|
|
Current Coal Hedges (%)
|
|
|
99%
|
|
96%
|
|
|
|
East
|
|
|
99%
|
|
94%
|
|
|
|
West
|
|
|
100%
|
|
100%
|
|
|
|
|
|
|
|
|
|
|
|
|
Average Hedged Consumed Coal Price (Delivered $/Ton)
|
|
|
|
|
|
|
|
|
East
|
|
|
$73-74
|
|
$76-80
|
|
|
|
West
|
|
|
$23-28
|
|
$23-29
|
|
|
|
|
|
|
|
|
|
|
|
|
Intermediate/Peaking
|
|
|
|
|
|
|
|
|
Expected Generation(1) (Million MWhs)
|
|
|
7.1
|
|
6.2
|
|
|
|
Current Hedges (%)
|
|
|
58%
|
|
26%
|
|
|
Enhancing Value Through Active Hedging

18
© PPL Corporation 2011
Appendix
18
© PPL Corporation 2011
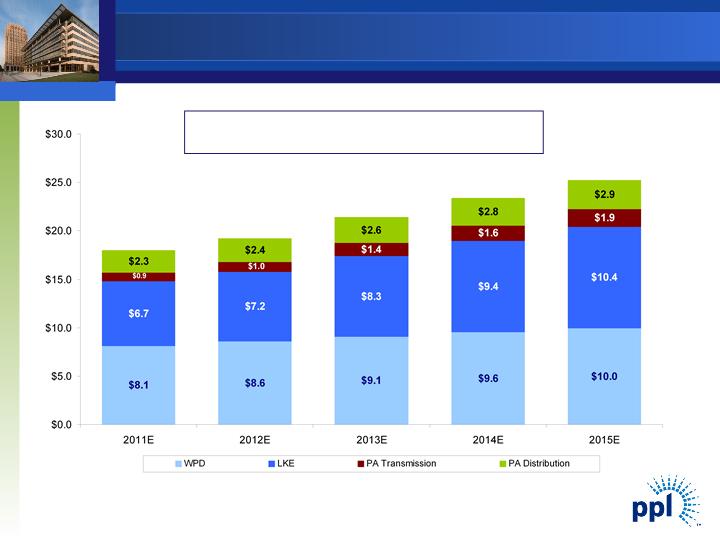
Regulated Rate Base Growth
($ in billions)
(1) Represents capitalization for LKE, as LG&E and KU rate constructs are based on capitalization. Represents Regulatory Asset Value (RAV) for WPD.
(2) Includes RAV for WPD Midlands. Figures based on assumed exchange rate of $1.60 / GBP and are as of year-end December 31.
$18.0
$19.2
$21.4
$23.4
$25.2
2011E - 2015E Regulatory Asset Base(1) CAGR: 8.8%
(2)
19
© PPL Corporation 2011
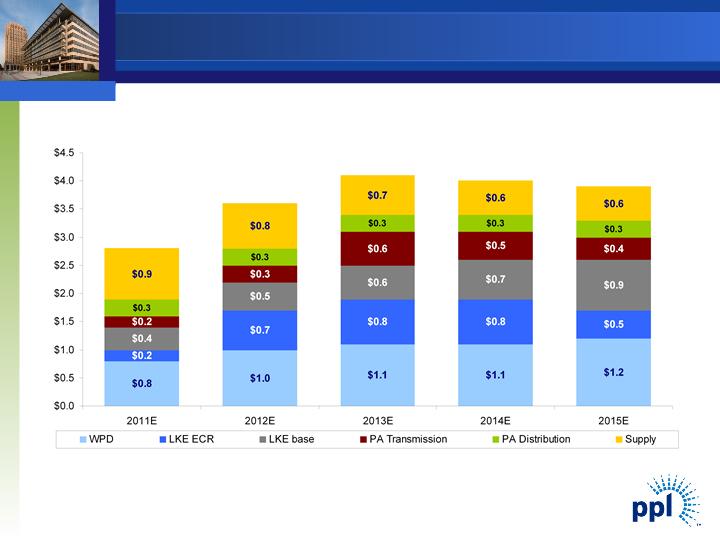
Capital Expenditures
($ in billions)
(1) Includes capex for WPD Midlands. Figures based on assumed exchange rate of $1.60 / GBP.
(2) Expect approximately 85% to receive timely returns via ECR mechanism based on historical experience.
(1)
(2)
$2.8
$3.6
$4.1
$4.0
$3.9
20
© PPL Corporation 2011
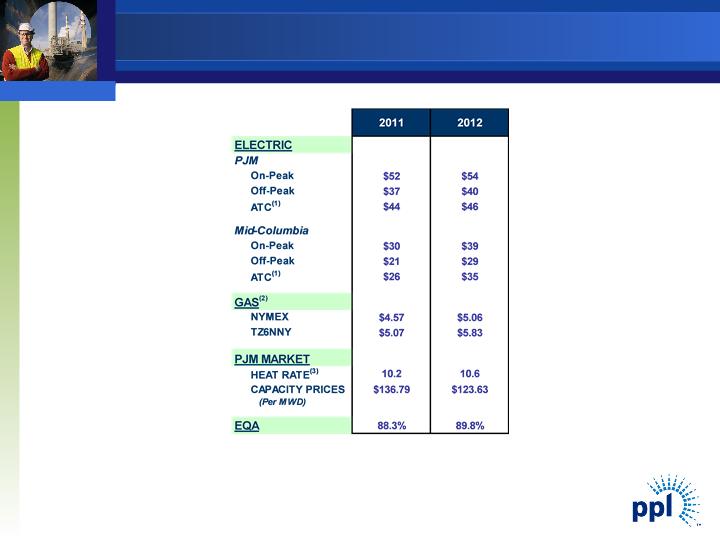
Market Prices
|
(1)
|
24-hour average.
|
|
(2)
|
NYMEX and TZ6NNY forward gas prices on 3/31/2011.
|
|
(3)
|
Market Heat Rate = PJM on-peak power price divided by TZ6NNY gas
price. |
Market Prices 20112012$52 $54 $37 $40 $44 $46 $30 $39 $21 $29 $26 $35 $4.57 $5.06 $5.07 $5.83 10.210.6$136.79 $123.63 88.3%89.8% (Per MWD) EQAHEAT RATE(3) TZ6NNYPJM MARKETATC(1) NYMEXGAS(2) CAPACITY PRICES Mid-Columbia On-Peak Off-Peak ATC(1) ELECTRIC PJM On-Peak Off-Peak (1) 24-hour average. (2) NYMEX and TZ6NNY forward gas prices on 3/31/2011. (3) Market Heat Rate = PJM on-peak power price divided by TZ6NNY gas price 20
21
© PPL Corporation 2011
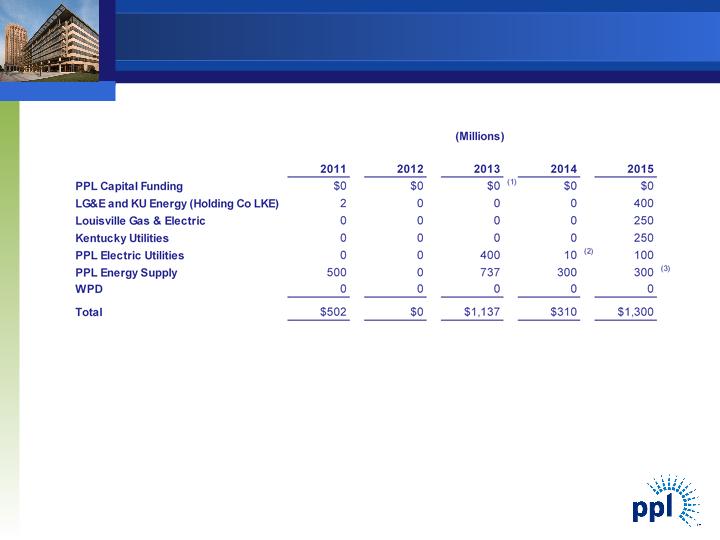
Note: As of March 31, 2011
(1) Excludes $1.15 billion of junior subordinated notes due 2018 that are a component of PPL’s 2010 Equity Units and
may be put back to PPL Capital Funding if the remarketing in 2013 is not successful.
may be put back to PPL Capital Funding if the remarketing in 2013 is not successful.
(2) Bonds defeased in substance in 2008 by depositing sufficient funds with the trustee.
(3) Represents REset Put Securities due 2035 that are required to be put by the holders in October 2015 either for (a)
purchase and remarketing by a remarketing dealer or (b) repurchase by PPL Energy Supply.
purchase and remarketing by a remarketing dealer or (b) repurchase by PPL Energy Supply.
Debt Maturities
20112012201320142015PPL Capital Funding$0$0$0(1)$0$0LG&E and KU Energy (Holding Co LKE)2000400Louisville Gas & Electric0000250Kentucky Utilities0000250PPL Electric Utilities 0040010(2)100PPL Energy Supply 500 0 737 300 300(3) WPD 00000 Total $502 $0 $1,137 $310 $1,300 (Millions) 21
22
© PPL Corporation 2011
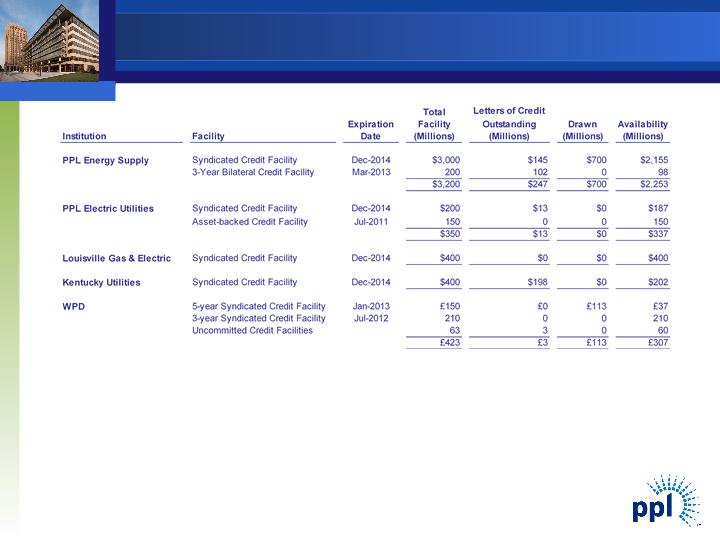
Note: As of March 31, 2011
• PPL Domestic facilities consist of a diverse bank group, with no bank and its affiliates providing an aggregate commitment of more
than 10% of the total committed capacity.
than 10% of the total committed capacity.
• The above does not reflect a Senior Bridge Term Loan Credit Agreement entered into in March 2011, under which PPL Capital
Funding and PPL WEM Holdings plc borrowed an aggregate of £3.6 billion in April 2011 to fund the acquisition of Central
Networks. To date, £2.4 billion was repaid.
Funding and PPL WEM Holdings plc borrowed an aggregate of £3.6 billion in April 2011 to fund the acquisition of Central
Networks. To date, £2.4 billion was repaid.
• In April 2011, WPD (East Midlands) and WPD (West Midlands) each entered into a £300 million 5-year Syndicated Credit Facility.
• In April 2011, Kentucky Utilities entered into a new $198 million letter of credit facility that will be used to issue letters of credit to
support outstanding tax exempt bonds. In May 2011, letters of credit totaling $198 million were issued under the new facility,
replacing letters of credit issued under KU’s Syndicated Credit Facility at March 31, 2011.
support outstanding tax exempt bonds. In May 2011, letters of credit totaling $198 million were issued under the new facility,
replacing letters of credit issued under KU’s Syndicated Credit Facility at March 31, 2011.
Liquidity Profile
Institution Facility Expiration Date Total Facility(Millions) Letters of Credit Outstanding (Millions) Drawn (Millions) Availability (Millions) PPL Energy Supply Syndicated Credit Facility Dec-2014 $3,000 $145 $700 $2,1553-Year Bilateral Credit Facility Mar-2013 2001 02098 $3,200 $247 $700 $2,253 PPL Electric Utilities Syndicated Credit Facility Dec-2014 $200 $13 $0 $187 Asset-backed Credit Facility Jul-2011 150 0 0 150 $350 $13 $0 $337 Louisville Gas & Electric Syndicated Credit Facility Dec-2014 $400 $0 $0 $400 Kentucky Utilities Syndicated Credit Facility Dec-2014 $400 $198 $0 $202 WPD5-year Syndicated Credit Facility Jan-2013 £150 £0 £113 £373-year Syndicated Credit Facility Jul-2012 210 0 0210 Uncommitted Credit Facilities 633060 £423£3£113£307 22
23
© PPL Corporation 2011
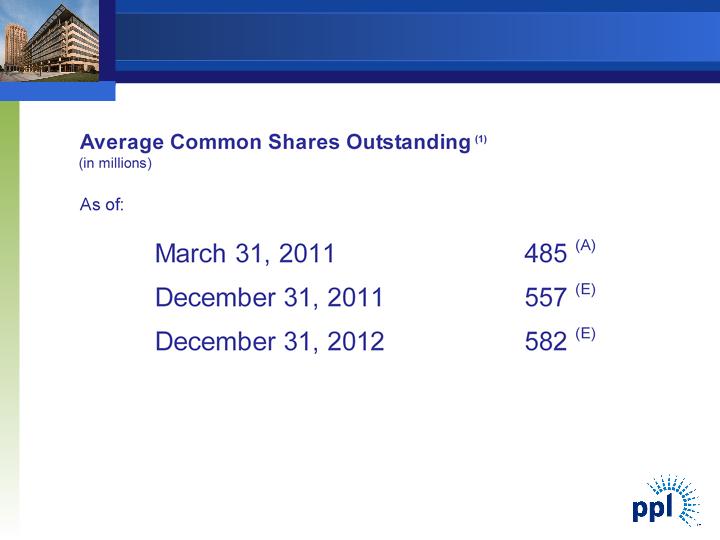
(1) Projected average common shares outstanding include common stock issued for the acquisition of WPD Midlands, projected shares
issued to satisfy DRIP and compensation-related stock requirements, and the issuance of common stock to satisfy the conversion of
the PPL Capital Funding equity units in 2013. These projections do not include common stock issued to fund future growth.
issued to satisfy DRIP and compensation-related stock requirements, and the issuance of common stock to satisfy the conversion of
the PPL Capital Funding equity units in 2013. These projections do not include common stock issued to fund future growth.
(A) Actual for quarter ended March 31, 2011.
(E) Estimate for average shares outstanding for the year indicated.
Shares Outstanding
Shares Outstanding (1) Projected average common shares outstanding include common stock issued for the acquisition of WPD Midlands, projected shares issued to satisfy DRIP and compensation-related stock requirements, and the issuance of common stock to satisfy the conversion of the PPL Capital Funding equity units in 2013. These projections do not include common stock issued to fund future growth. (A) Actual (E) Estimate Average Common Shares Outstanding (1) (in millions) As of: March 31, 2011 485(A) December 31, 2011 557(E) December 31, 2012 582(E) 23

24
© PPL Corporation 2011
Reconciliation of First Quarter Earnings from
Ongoing Operations to Reported Earnings
Ongoing Operations to Reported Earnings
Reconciliation of First Quarter Earnings from Ongoing Operations to Reported Earnings $75 $75 $52 $205 $407 17 17 (1) (1) (1) (1) (2) (2) Bridge Facility costs (5) (5) Other acquisition-related costs (10) (10) Foreign currency-related economic hedges (4) (4) (20) 14 (6) $75 $55 $52 $219 $401 $76 $37 $244 $357 (65) (65) (2) (2) Montana hydroelectric litigation (32) (32) Health Care Reform - tax impact (8) (8) (107) (107) $76 $37 $137 $250 * Represents net income attributable to PPL Corporation Total Earnings from Ongoing Operations Energy-related economic activity Reported Earnings* Quarter Ending March 31, 2010 Regulated Regulated Supply Other: Total Special Items International Pennsylvania Impairments Supply Total Earnings from Ongoing Operations Energy-related economic activity Quarter Ending March 31, 2011 Regulated Regulated Regulated Special Items: (Millions) Kentucky International Pennsylvania Foreign currency-related economic hedges Sales of assets Central Networks acquisition-related costs: Special Items: Impairments Total Special Items Reported Earnings*

25
© PPL Corporation 2011
Reconciliation of First Quarter Earnings from
Ongoing Operations to Reported Earnings
Ongoing Operations to Reported Earnings
Reconciliation of First Quarter Earnings from Ongoing Operations to Reported Earnings (Per Share) $0.15 $0.16 $0.11 $0.42 $0.84 0.03 0.03 Bridge Facility costs (0.02) (0.02) Other acquisition-related costs (0.02) (0.02) Foreign currency-related economic hedges (0.01) (0.01) (0.05) 0.03 (0.02) $0.15 $0.11 $0.11 $0.45 $0.82 $0.20 $0.10 $0.64 $0.94 (0.16) (0.16) (0.01) (0.01) Montana hydroelectric litigation (0.09) (0.09) Health Care Reform - tax impact (0.02) (0.02) (0.28) (0.28) $0.20 $0.10 $0.36 $0.66 Note: Per share amounts are based on diluted shares outstanding. Impairments Other: Total Special Items Reported Earnings Total Earnings from Ongoing Operations Special Items: Energy-related economic activity Quarter Ending March 31, 2010RegulatedRegulatedSupplyKentuckyInternationalPennsylvaniaSupplyTotalEarnings from Ongoing Operations Special Items: Quarter Ending March 31, 2011RegulatedRegulatedRegulatedEnergy-related economic activity Central Networks acquisition-related costs: Total Special Items Reported Earnings International Pennsylvania
26
© PPL Corporation 2011
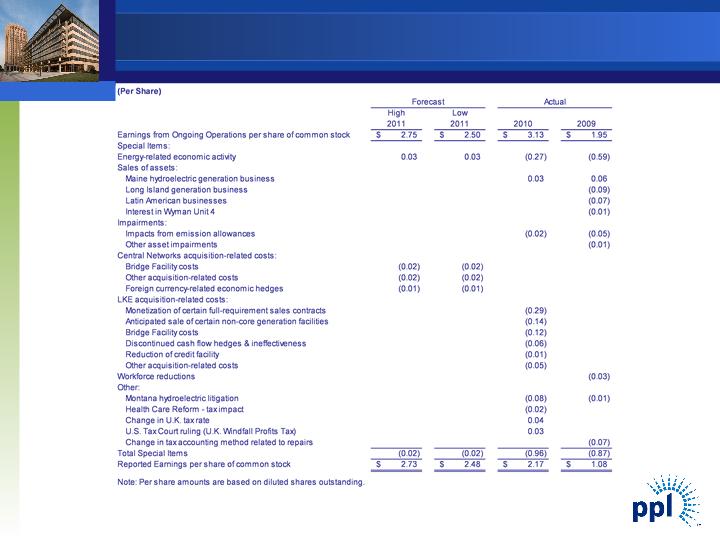
Reconciliation of PPL’s Earnings from Ongoing
Operations to Reported Earnings
Operations to Reported Earnings
Reconciliation of PPL’s Earnings from Ongoing Operations to Reported Earnings (Per Share) HighLow2011201120102009Earnings from Ongoing Operations per share of common stock2.75$ 2.50$ 3.13$ 1.95$ Special Items: Energy-related economic activity0.03 0.03 (0.27) (0.59) Sales of assets: Maine hydroelectric generation business0.03 0.06 Long Island generation business(0.09) Latin American businesses(0.07) Interest in Wyman Unit 4(0.01) Impairments: Impacts from emission allowances(0.02) (0.05) Other asset impairments(0.01) Central Networks acquisition-related costs: Bridge Facility costs(0.02) (0.02) Other acquisition-related costs(0.02) (0.02) Foreign currency-related economic hedges(0.01) (0.01) LKE acquisition-related costs: Monetization of certain full-requirement sales contracts(0.29) Anticipated sale of certain non-core generation facilities(0.14) Bridge Facility costs(0.12) Discontinued cash flow hedges & ineffectiveness(0.06) Reduction of credit facility(0.01) Other acquisition-related costs(0.05) Workforce reductions(0.03) Other: Montana hydroelectric litigation(0.08) (0.01) Health Care Reform - tax impact(0.02) Change in U.K. tax rate0.04 U.S. Tax Court ruling (U.K. Windfall Profits Tax)0.03 Change in tax accounting method related to repairs(0.07) Total Special Items(0.02) (0.02) (0.96) (0.87) Reported Earnings per share of common stock2.73$ 2.48$ 2.17$ 1.08$ Note: Per share amounts are based on diluted shares outstanding. Forecast Actual
27
© PPL Corporation 2011
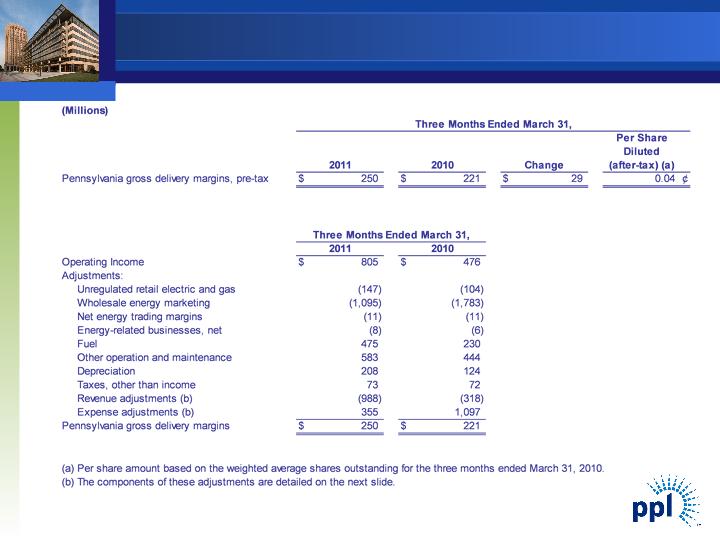
Reconciliation of First Quarter Operating Income to
Pennsylvania Gross Delivery Margins
Pennsylvania Gross Delivery Margins
Reconciliation of First Quarter Operating Income to Pennsylvania Gross Delivery Margins A-10 (Millions) Pennsylvania gross delivery margins, pre-tax$250 $221 $29 0.04 ¢ $805 $476 Unregulated retail electric and gas(147) (104) Wholesale energy marketing (1,095) (1,783) Net energy trading margins(11) (11) Energy-related businesses, net (8) (6) Fuel475 230 Other operation and maintenance583 444 Depreciation 208 124 Taxes, other than income73 72 Revenue adjustments (b)(988) (318) Expense adjustments (b)355 1,097 $250 $221 (a)Per share amount based on the weighted average shares outstanding for the three months ended March 31, 2010. (b)The components of these adjustments are detailed on the next slide. 2010 Change Three Months Ended March 31, Per Share Diluted (after-tax) (a) 2011Pennsylvania gross delivery margins Operating Income Adjustments: Three Months Ended March 31,2011 2010
28
© PPL Corporation 2011
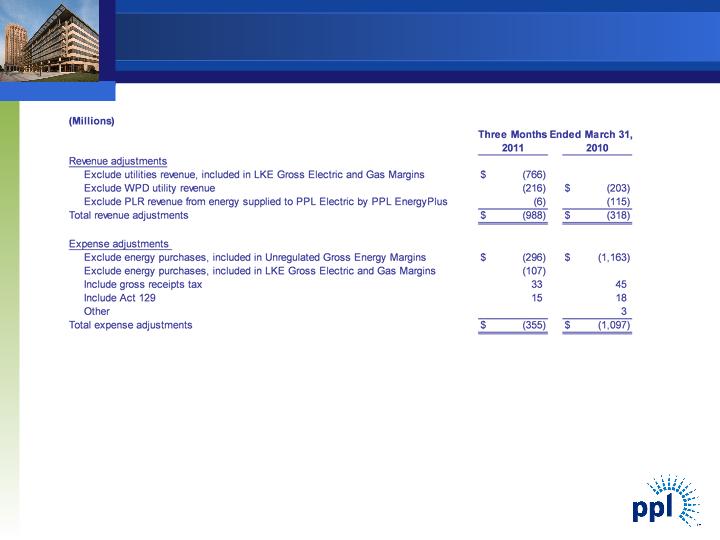
Reconciliation of First Quarter Operating Income to
Pennsylvania Gross Delivery Margins
Pennsylvania Gross Delivery Margins
Reconciliation of First Quarter Operating Income to Pennsylvania Gross Delivery Margins (Millions) Three Months Ended March 31, Revenue adjustments Exclude utilities revenue, included in LKE Gross Electric and Gas Margins$(766) Exclude WPD utility revenue(216) $(203) Exclude PLR revenue from energy supplied to PPL Electric by PPL EnergyPlus(6) (115) Total revenue adjustments$(988) $(318) Expense adjustments Exclude energy purchases, included in Unregulated Gross Energy Margins$(296) $(1,163) Exclude energy purchases, included in LKE Gross Electric and Gas Margins(107) Include gross receipts tax 33 45 Include Act 129 15 18 Other 3 Total expense adjustments$(355) $(1,097) 20112010
29
© PPL Corporation 2011
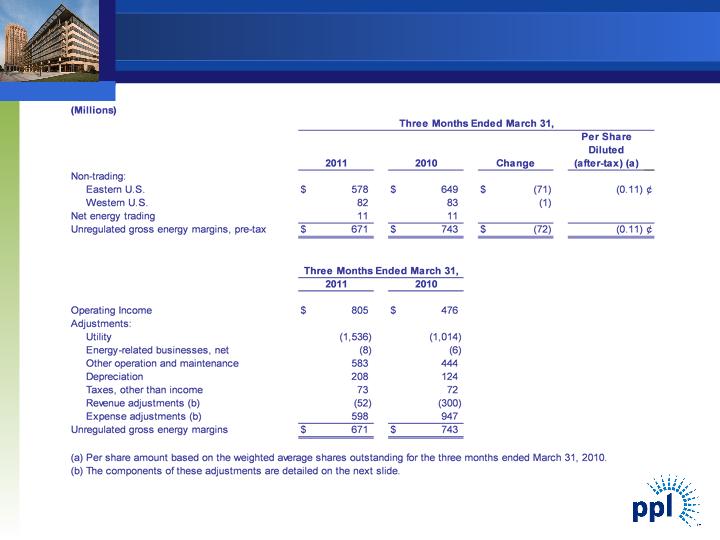
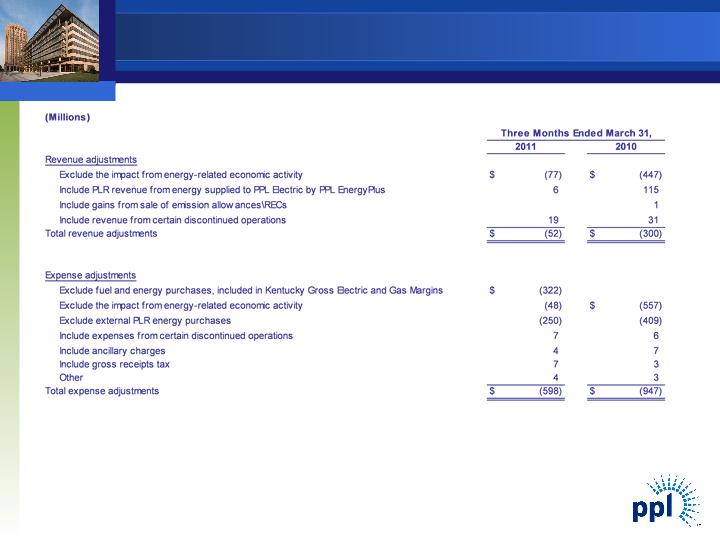
Reconciliation of First Quarter Operating Income to
Unregulated Gross Energy Margins
Unregulated Gross Energy Margins
30
© PPL Corporation 2011
Reconciliation of First Quarter Operating Income to
Unregulated Gross Energy Margins
Unregulated Gross Energy Margins
Reconciliation of First Quarter Operating Income to Unregulated Gross Energy Margins A-10 (Millions) Exclude the impact from energy-related economic activity $(77) $(447) Include PLR revenue from energy supplied to PPL Electric by PPL EnergyPlus6 115 Include gains from sale of emission allowances\RECs 1 Include revenue from certain discontinued operations 19 31 $(52) $(300) Exclude fuel and energy purchases, included in Kentucky Gross Electric and Gas Margins$(322) Exclude the impact from energy-related economic activity (48) $(557) Exclude external PLR energy purchases(250) (409) Include expenses from certain discontinued operations7 6 Include ancillary charges4 7 Include gross receipts tax7 3 Other4 3 $(598) $(947) Three Months Ended March 31,20112010Total expense adjustments Total revenue adjustments Expense adjustments Revenue adjustments

31
© PPL Corporation 2011
|
|
2009
|
|
2010
|
|
2011
|
|
Cash from Operations
|
$1,852
|
|
$2,034
|
|
$2,200
|
|
Increase (Decrease) in cash due to:
|
|
|
|
|
|
|
Capital Expenditures
|
(1,265)
|
|
(1,644)
|
|
(2,837)
|
|
Sale of Assets
|
84
|
|
161
|
|
382
|
|
Other Investing Activities - Net
|
(71)
|
|
(20)
|
|
152
|
|
Free Cash Flow before Dividends
|
$ 600
|
|
$ 531
|
|
$ (103)
|
(Millions of Dollars)
PPL Corporation Reconciliation of Cash from
Operations to Free Cash Flow before Dividends
Operations to Free Cash Flow before Dividends
Reconciliation of Cash from Operations to Free Cash Flow before Dividends 2009 2010 2011 Cash from Operations $1,852 $2,034 $2,200 Increase (Decrease) in cash due to: Capital Expenditures (1,265) (1,644) (2,837) Sale of Assets 84 161 382 Other Investing Activities – Net (71) (20) 152 Free Cash Flow before Dividends $ 600 $ 531 $ (103) (Millions of Dollars)

32
© PPL Corporation 2011
Statements contained in this presentation, including statements with respect to future earnings, cash flows, financing, regulation and
corporate strategy are "forward-looking statements" within the meaning of the federal securities laws. Although PPL Corporation
believes that the expectations and assumptions reflected in these forward-looking statements are reasonable, these statements are
subject to a number of risks and uncertainties, and actual results may differ materially from the results discussed in the statements.
The following are among the important factors that could cause actual results to differ materially from the forward-looking statements:
market demand and prices for energy, capacity and fuel; weather conditions affecting customer energy usage and operating costs;
competition in power markets; the effect of any business or industry restructuring; the profitability and liquidity of PPL Corporation and
its subsidiaries; new accounting requirements or new interpretations or applications of existing requirements; operating performance of
plants and other facilities; the length of scheduled and unscheduled outages at our plants, including the current outage at Unit 2 of our
Susquehanna nuclear plant to inspect and repair turbine blades, and the timing and outcome of any similar outage for inspections at
Unit 1 of the Susquehanna plant; environmental conditions and requirements and the related costs of compliance, including
environmental capital expenditures and emission allowance and other expenses; system conditions and operating costs; development
of new projects, markets and technologies; performance of new ventures; asset or business acquisitions and dispositions, and PPL
Corporation’s ability to realize the expected benefits from acquired businesses, including the 2010 acquisition of Louisville Gas and
Electric Company and Kentucky Utilities Company and the 2011 acquisition of the Central Networks electricity distribution businesses
in the U.K.; any impact of hurricanes or other severe weather on our business, including any impact on fuel prices; receipt of
necessary government permits, approvals, rate relief and regulatory cost recovery; capital market conditions and decisions regarding
capital structure; the impact of state, federal or foreign investigations applicable to PPL Corporation and its subsidiaries; the outcome
of litigation against PPL Corporation and its subsidiaries; stock price performance; the market prices of equity securities and the impact
on pension income and resultant cash funding requirements for defined benefit pension plans; the securities and credit ratings of PPL
Corporation and its subsidiaries; political, regulatory or economic conditions in states, regions or countries where PPL Corporation or
its subsidiaries conduct business, including any potential effects of threatened or actual terrorism or war or other hostilities; foreign
exchange rates; new state, federal or foreign legislation, including new tax legislation; and the commitments and liabilities of PPL
Corporation and its subsidiaries. Any such forward-looking statements should be considered in light of such important factors and in
conjunction with PPL Corporation's Form 10-K and other reports on file with the Securities and Exchange Commission.
Forward-Looking Information Statement

33
© PPL Corporation 2011
“Earnings from ongoing operations” should not be considered as an alternative to reported earnings, or net income attributable to PPL, which is an
indicator of operating performance determined in accordance with generally accepted accounting principles (GAAP). PPL believes that “earnings from
ongoing operations,” although a non-GAAP financial measure, is also useful and meaningful to investors because it provides management’s view of
PPL’s fundamental earnings performance as another criterion in making investment decisions. PPL’s management also uses “earnings from ongoing
operations” in measuring certain corporate performance goals. Other companies may use different measures to present financial performance.
“Earnings from ongoing operations” is adjusted for the impact of special items. Special items include:
• Energy-related economic activity (as discussed below).
• Foreign currency-related economic hedges.
• Gains and losses on sales of assets not in the ordinary course of business.
• Impairment charges (including impairments of securities in the company’s nuclear decommissioning trust funds).
• Workforce reduction and other restructuring impacts.
• Acquisition-related costs and charges.
• Other charges or credits that are, in management’s view, not reflective of the company’s ongoing operations.
Energy-related economic activity includes the changes in fair value of positions used economically to hedge a portion of the economic value of PPL’s
generation assets, full-requirement sales contracts and retail activities. This economic value is subject to changes in fair value due to market price
volatility of the input and output commodities (e.g., fuel and power) prior to the delivery period that was hedged. Also included in energy-related
economic activity is the ineffective portion of qualifying cash flow hedges, the monetization of certain full-requirement sales contracts and premium
amortization associated with options. This economic activity is deferred, with the exception of the full-requirement sales contracts that were
monetized, and included in earnings from ongoing operations over the delivery period of the item that was hedged or upon realization. Management
believes that adjusting for such amounts provides a better matching of earnings from ongoing operations to the actual amounts settled for PPL’s
underlying hedged assets. Please refer to the Notes to the Consolidated Financial Statements and MD&A in PPL Corporation’s periodic filings with
the Securities and Exchange Commission for additional information on energy-related economic activity.
“Free cash flow before dividends” is derived by deducting capital expenditures and other investing activities-net, from cash flow from operations. Free
cash flow before dividends should not be considered as an alternative to cash flow from operations, which is determined in accordance with GAAP.
PPL believes that free cash flow before dividends, although a non-GAAP measure, is an important measure to both management and investors, as it
is an indicator of the company’s ability to sustain operations and growth without additional outside financing beyond the requirement to fund maturing
debt obligations. Other companies may calculate free cash flow before dividends in a different manner.
Definitions of Non-GAAP Financial Measures