Attached files
 1Q 2011
Presentation May 2011
Exhibit 99.2 |
 Corporate Headquarters
Contacts
Plains Exploration & Production Company
700 Milam, Suite 3100
Houston, Texas 77002
Forward-Looking Statements
This presentation is not for reproduction or distribution to others without PXP’s
consent. Corporate Information
James C. Flores –
Chairman, President & CEO
Winston M. Talbert –
Exec. Vice President & CFO
Hance V. Myers –
Vice President Investor Relations
Joanna Pankey –
Manager, Investor
Relations
& Shareholder Services
Phone: 713-579-6000
Toll Free: 800-934-6083
Email:
investor@pxp.com
Web Site: www.pxp.com
Except for the historical information contained herein, the matters discussed in
this
presentation
are
“forward-looking
statements”
as
defined
by
the
Securities
and Exchange Commission. These statements involve certain assumptions PXP
made based on its experience and perception of historical trends, current
conditions, expected future developments and other factors it believes are
appropriate under the circumstances.
The forward-looking statements are subject to a number of known and
unknown risks, uncertainties and other factors that could cause our actual
results to differ materially. These risks and uncertainties include, among other
things, uncertainties inherent in the exploration for and development and
production
of
oil
and
gas
and
in
estimating
reserves,
the
timing
and
closing
of
acquisitions and divestments, unexpected future capital expenditures, general
economic conditions, oil and gas price volatility, the success of our risk
management
activities,
competition,
regulatory
changes
and
other
factors
discussed in PXP’s filings with the SEC.
References to quantities of oil or natural gas may include amounts that the
Company believes will ultimately be produced, but that are not yet classified as
"proved reserves" under SEC definitions.
2 |
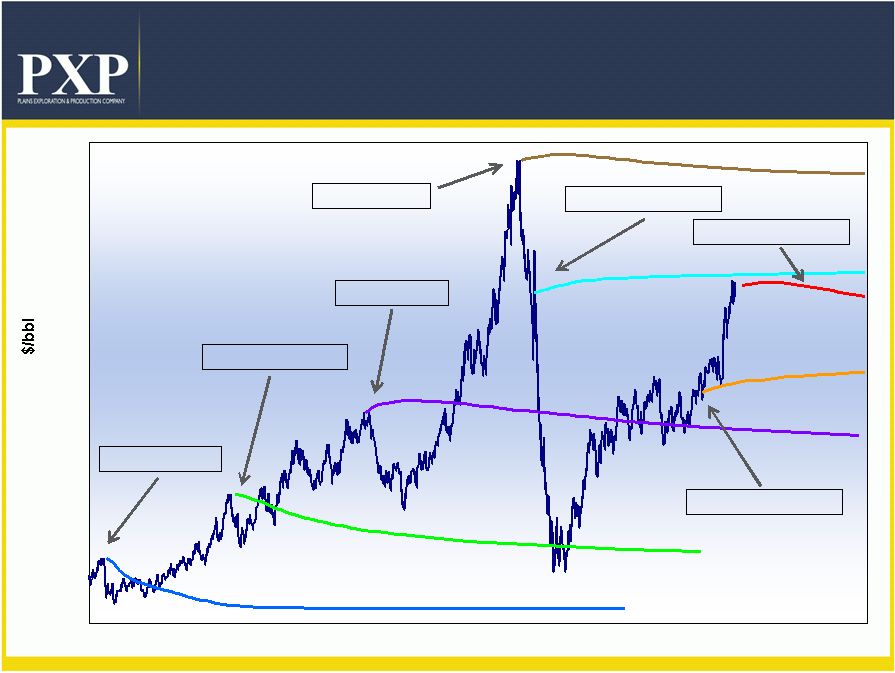 Source:
Goldman Sachs, NYMEX, ICE 3
WTI NYMEX Historical Prices and
Forward Curves
July 14, 2006
March 7, 2003
October 26, 2004
July 14, 2008
September 3, 2008
October 25, 2010
April 21, 2011
20
30
40
50
60
70
80
90
100
110
120
130
140
150
2003
2004
2005
2006
2007
2008
2009
2010
2011
2012 |
 4
PXP Today
•
$8.6
billion
enterprise
value
(1)
•
416 MMBOE proved reserves YE 2010
•
88.0 MBOE per day production for 1Q 2011
•
+1.6
billion
BOE
resource
potential
(2)
•
141.0 million shares outstanding
(3)
(1) Reflects stock price and total debt as of March 31, 2011.
(2) Excludes deepwater Gulf of Mexico assets.
(3) As of March 31, 2011. |
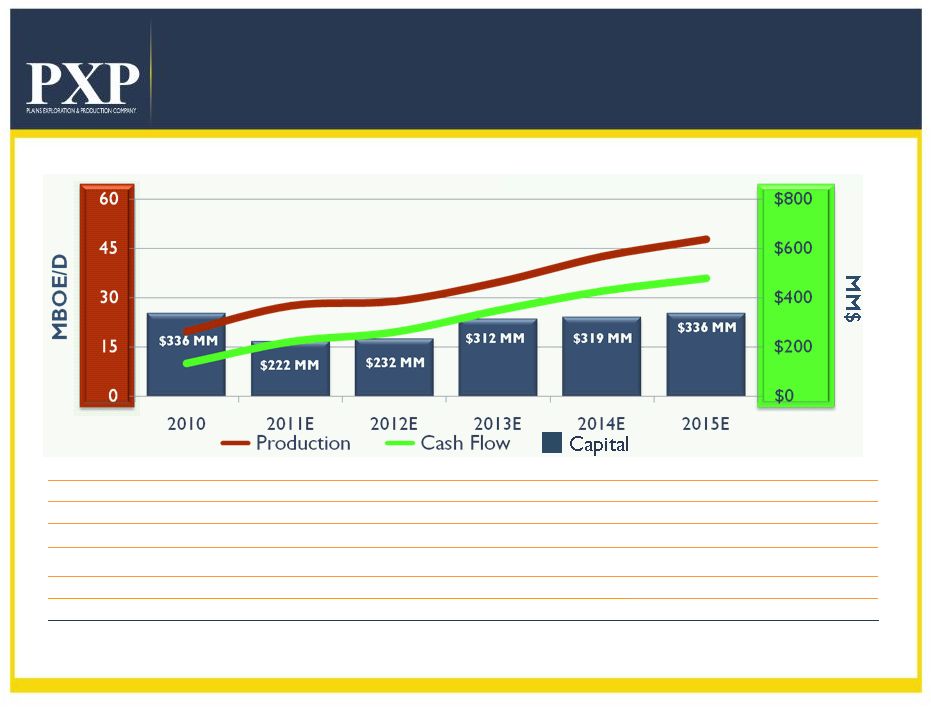
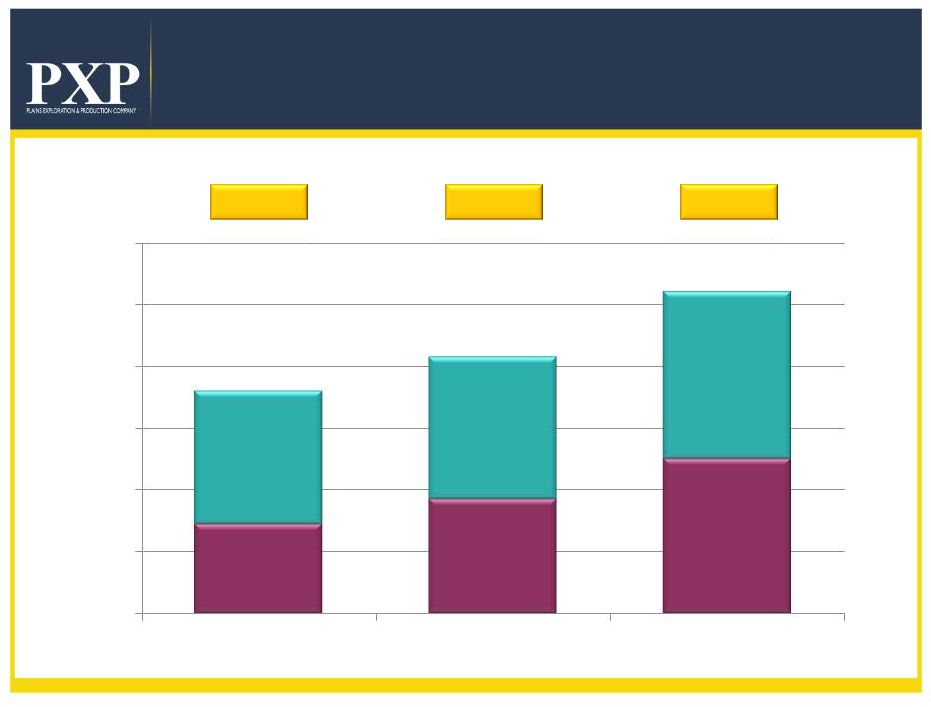
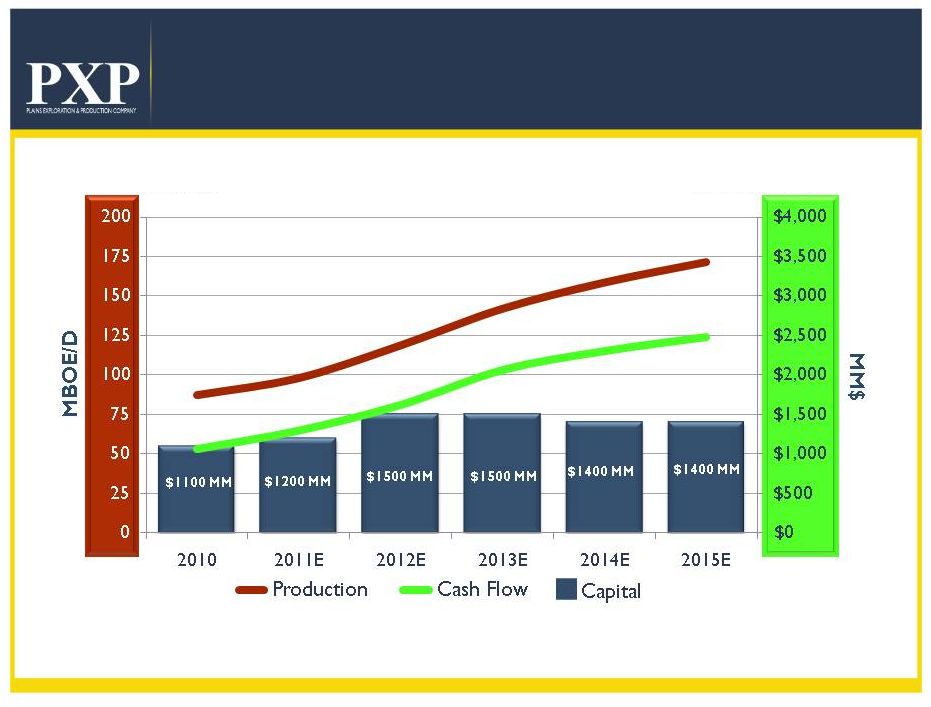 5
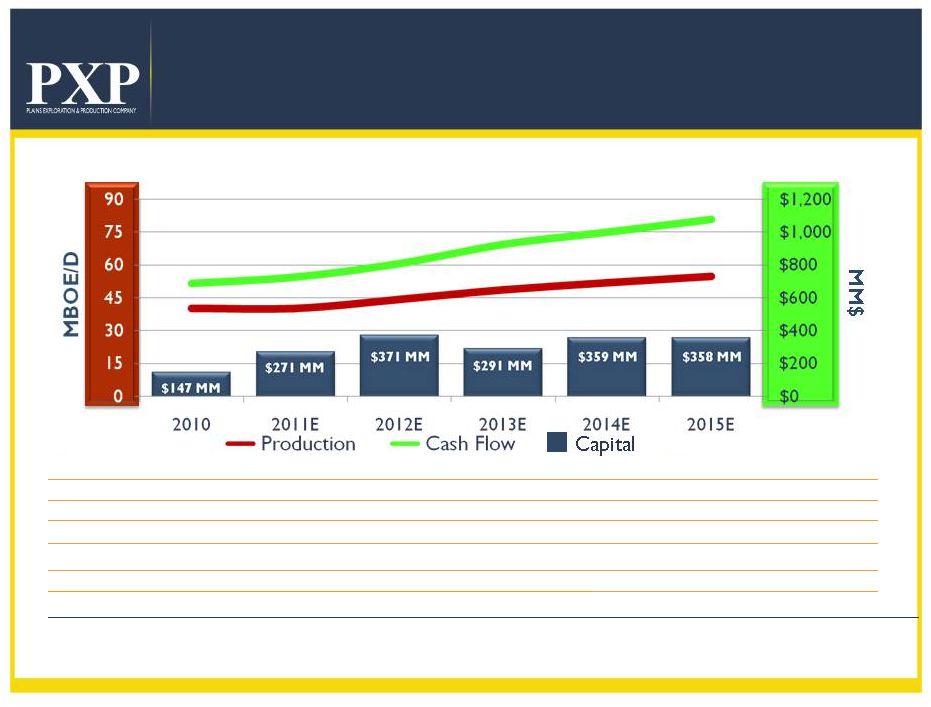
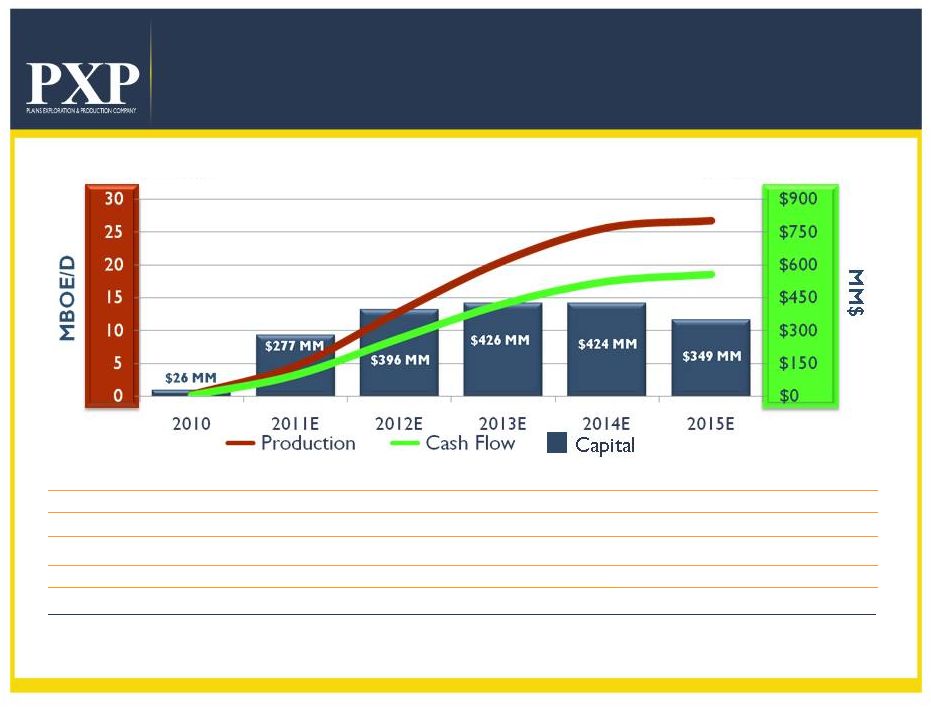
PXP
Operational Plan at $85 Oil
PXP Net Production
PXP Net Cash Flow
(1)(2)
(1) Net revenue minus net expenses.
(2) Assumes $85/Bbl of oil and natural gas pricing of $5.00/MMBtu in 2011, $85/Bbl of
oil and natural gas pricing of $5.50/MMBtu in 2012, and $86/Bbl of oil
and natural gas pricing of $6.00/MMBtu 2013 and beyond.
Excludes deepwater Gulf of Mexico. |
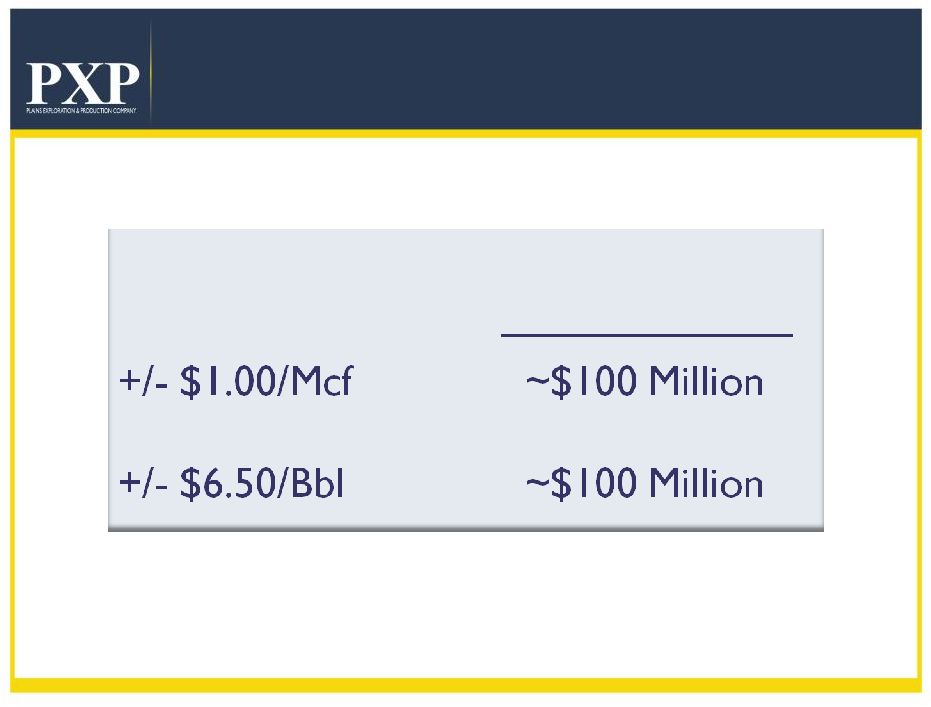 6
Cash Flow Sensitivities
(1)
Excludes impact of derivatives.
Impact on Est. 2011
Cash Flow From
Operating Activities
(1) |
 7
2011 Capital Allocation
Capital Program
Haynesville
California
Cap G&A, Interest
and Other
(1)
$1.5 Billion
Granite Wash
Eagle Ford
$1.2 Billion
Current Approved
Budget
$85 Oil Price
Expansion
Potential
$100+ Oil Price
(1)
Includes development, exploitation, real estate, capitalized interest and G&A costs
but does not include additional capital for exploratory successes.
Excludes deepwater Gulf of Mexico capital.
|
 8
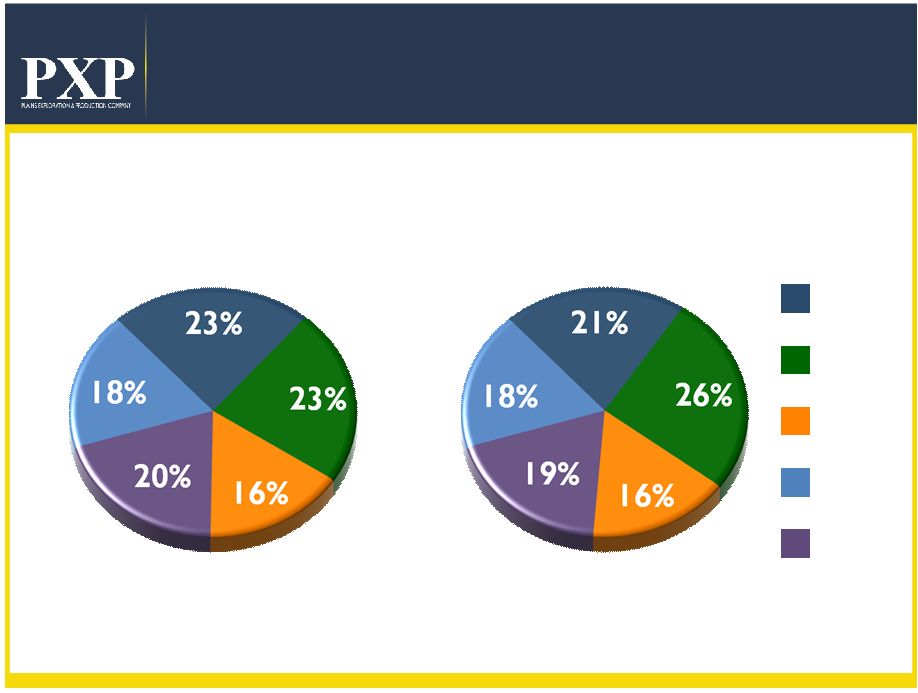
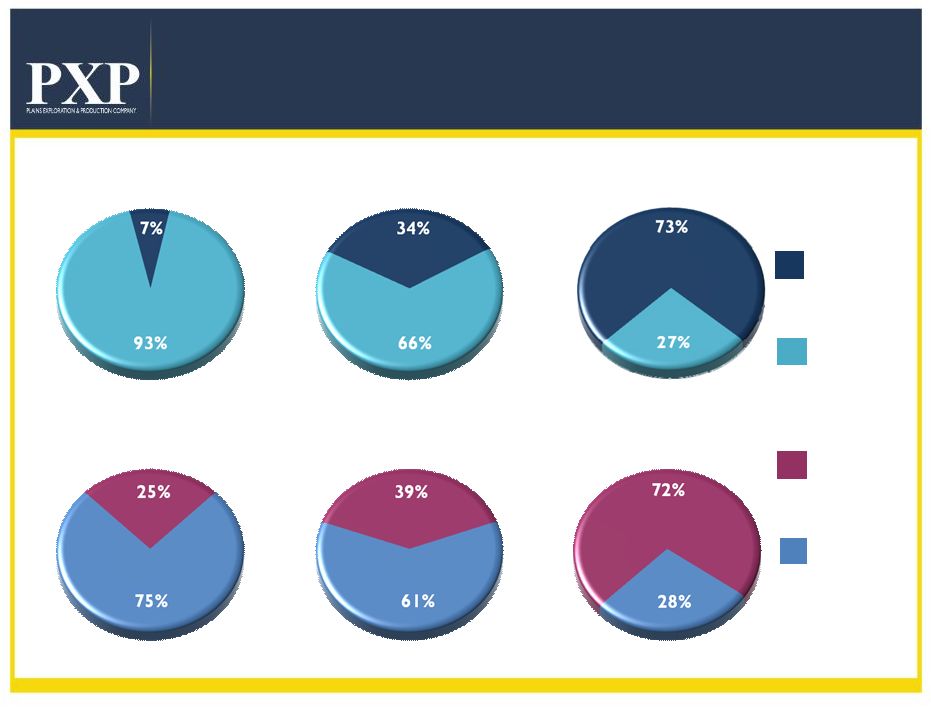
Capex Profile
Includes Eagle Ford acquisition and excludes Gulf of Mexico assets, shallow water as of
12/30/2010 and deepwater as of 1/1/2011. 2009
2011E
2010
Oil vs. Gas
Operated vs. Non-Operated
2009
2011E
2010
Oil + Liquids
Gas + Exploration
Operated
Non-operated |
 9
Operational Strategy
Focused Oil Growth Strategy
•
Operate substantially all oil assets
•
Maintain total company liquids volumes between 50% and 60% of total
production
•
Hedging
strategy
protects
high
oil
margins
that
preserve
excellent
returns
Targeted High Liquids/Natural Gas Strategy
•
Granite Wash development focusing on high liquids and highest rate of
return wells
•
Haynesville Shale development drilling continues for our Held By
Production (HBP) program |
 10
$% of
NYMEX Oil
Est. % of
2011 Capital
Operator
Oil Assets
Asset
California
PXP
23%
88%
Eagle Ford
PXP/EOG
23%
98%
Mowry Shale
PXP
1%
75%
Monterey Shale
PXP
1%
88% |
 11
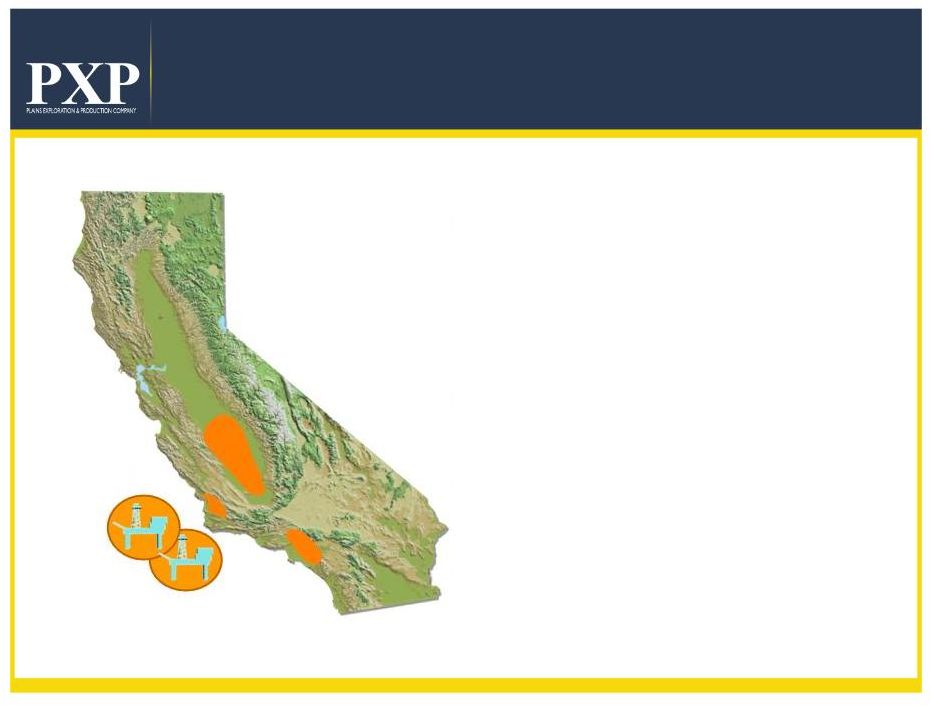
California
Onshore/Offshore
Los
Angeles
Basin
San Joaquin
Valley
Arroyo
Grande
Pt Pedernales
Pt Arguello
•
211 MMBOE Net Proved Reserves
•
272 MMBOE Net Development
Resource Potential
•
70% Proved Developed
•
2009 Capex $92 MM; 2010 Capex
$147 MM; 2011E Capex $271 MM
•
14 yr R/P
•
2,000+ future well locations
•
Price differentials protected by
contract
The shaded areas are for illustrative purposes only and do not reflect actual leasehold
acreage. |
 12
California
Operational Plan
January 1, 2010 Project Cost Forward F&D:
$9.87/BOE
(2)
PXP
Interest:
98% WI / 86%
NRI Potential Net Locations:
2,000+
Proved Net
Reserves:
211 MMBOE
Net Development Resource
Potential:
272 MMBOE
Average Gross Well Cost:
$1.2 MM
Average Gross EUR per Well:
135 MBOE
PXP Net Production
PXP Net Cash Flow
(1)(2)
(1) Net revenue minus net operating expenses.
(2) Assumes $85/Bbl of oil and natural gas pricing of $5.00/MMBtu in
2011, $85/Bbl of oil and natural gas pricing of $5.50/MMBtu in 2012, and $86/Bbl of oil
and natural gas pricing of $6.00/MMBtu 2013 and beyond.
|
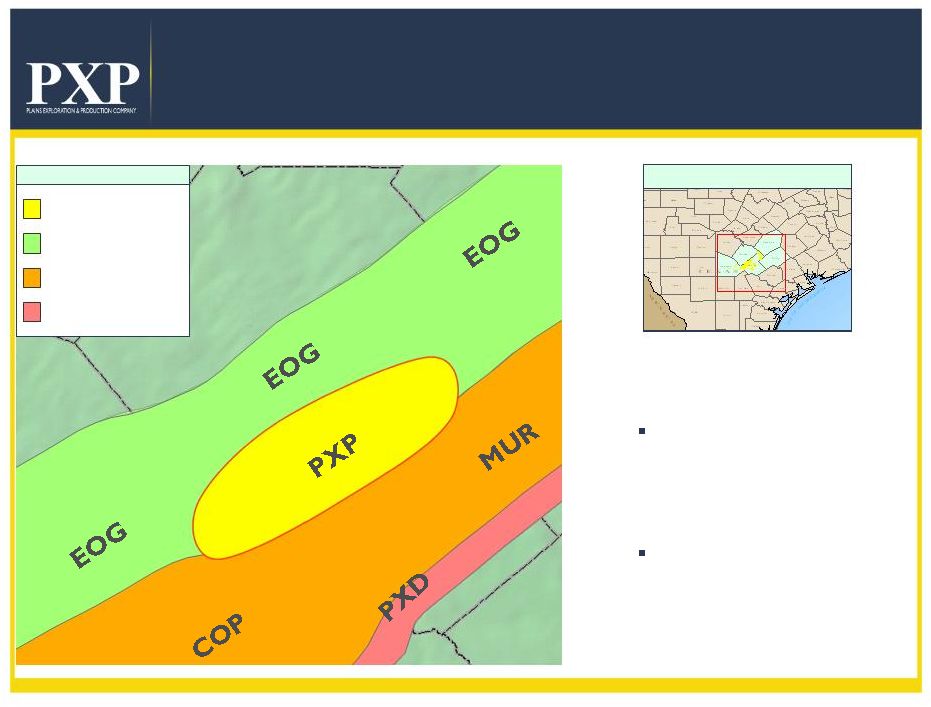 Eagle
Ford Horizontal Oil Play •
PXP acreage position
~58,400 net acres
•
4 to 6 rigs running in 2011
•
Depth to Eagle Ford Top
~9,500'
-
11,500'
TVD
Location Map
WILSON
ATASCOSA
Legend
PXP ACREAGE
OIL WINDOW
GAS CONDENSATE
WINDOW
DRY GAS WINDOW
The shaded area is for illustrative purposes only and does not reflect actual leasehold
acreage. 13 |
 14
Eagle Ford
Operational Plan
September 1, 2010 Project Cost Forward F&D:
$18.81/BOE
(2)
PXP
Interest:
73% WI/ 56%
NRI Potential Net Locations:
487
Net Development Resource
Potential:
170 MMBOE
Average Gross Well Cost:
$7.0 MM
Average Gross Resource Potential per Well:
483 MBOE
PXP Net Production
PXP Net Cash Flow
(1)(2)
(1) Net revenue minus net expenses.
(2) Assumes $85/Bbl of oil and natural gas pricing of $5.00/MMBtu in 2011, $85/Bbl of
oil and natural gas pricing of $5.50/MMBtu in 2012, and $86/Bbl of oil
and natural gas pricing of $6.00/MMBtu 2013 and beyond.
|
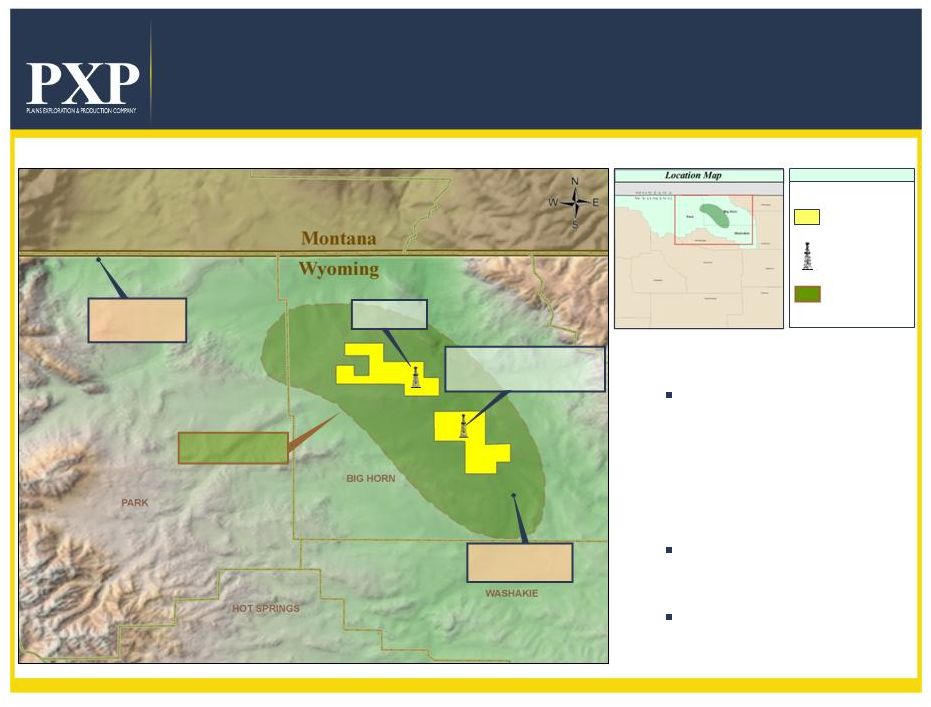 15
Mowry Shale Horizontal Oil Play
Big Horn Basin, Wyoming
•
PXP acreage position
93,600 net acres
•
Proven Source Rock
•
Petrophysical characteristics of
successful oil shale plays
•
Depth Range
~6,000' to 10,000'
•
Shale Thickness Range
~250' to 400'
•
Currently drilling second well
Legend
PXP LEASES
PXP DRILLING
OIL FAIRWAY
Oil Fairway
Mowry Oil
Production
Mowry Gas
Production
Drilled
but not completed
Drilling |
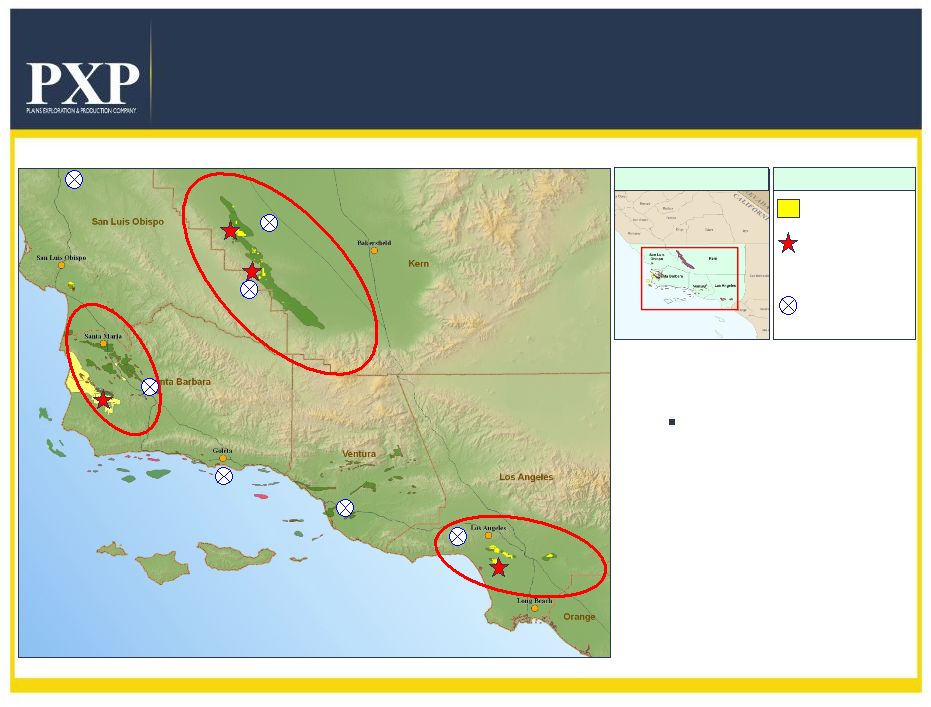 16
Legend
PXP ACREAGE
PXP
MONTEREY
PRODUCTION
OXY DISCOVERY
VENOCO ACTIVITY
*
•
PXP acreage position
86,000 net acres
•
Acquiring 3D seismic data
over key assets
•
Potential exploratory wells
planned in 2011
Monterey Shale Oil Play
Location Map
Los Angeles Basin
Los Angeles Basin
Point Pedernales
Point Arguello
Rocky Point
Arroyo Grande
Lompoc
Cymric
Belridge
McKittrick
Midway Sunset
Urban Area
Las Cienegas
Inglewood
Montebello
Pescado
Hondo
San Joaquin Basin
San Joaquin Basin
Santa Maria Basin
Santa Maria Basin
*
Jesus Maria |
 17
Natural Gas Assets
Assets
Operator
Est. % of
2011 Capital
Production
Characteristics
Haynesville
CHK
18%
Dry Gas
Granite Wash
PXP
16%
High Liquids
South Texas
PXP
1%
Dry Gas
Madden
COP
1%
Dry Gas |
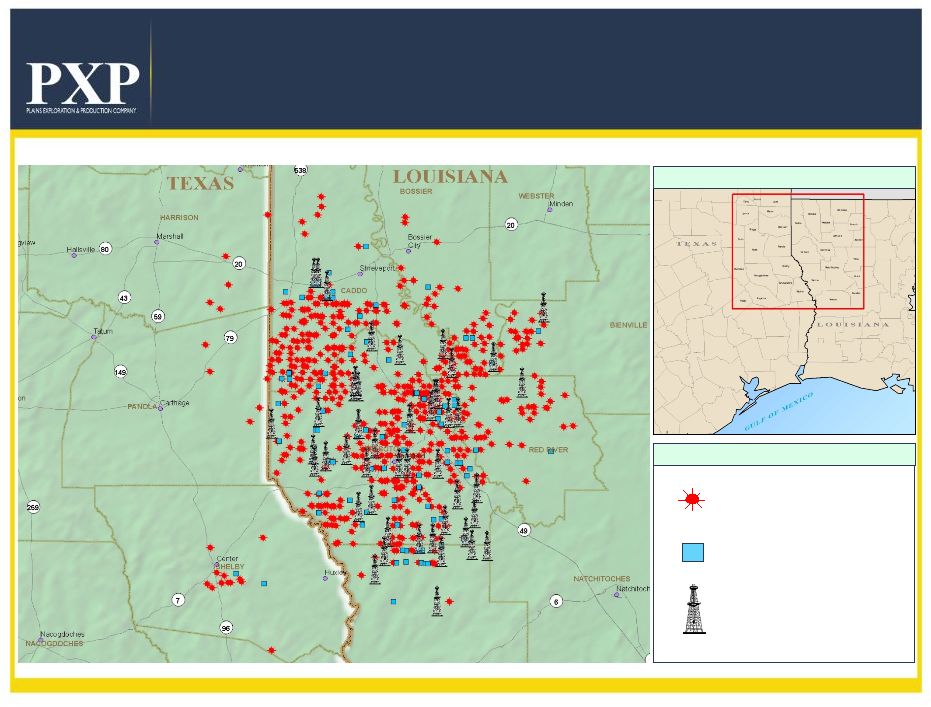 18
Producing
Waiting on Completion
Active Drilling
Haynesville Shale
Activity Map
Location Map
Legend |
 19
Haynesville Shale
Operational Plan
January 1, 2010 Project Cost Forward F&D:
$8.24/BOE
or
$1.37/Mcfe
(3)
PXP
Interest:
20% WI / 15%
NRI Net Acreage:
97,000
Potential Net
Locations:
1,136
Net Resource
Potential:
5.5 Tcfe
Average Gross Well Cost:
$7.5 MM
(2)
Average Gross EUR per Well:
6.5 Bcfe
(1) Net revenue minus net expenses.
(2) Assumes D&C costs for first 4 years = $7.5 MM per well, after 4 years = $6 MM
per well. (3) Assumes $85/Bbl of oil and natural gas pricing of $5.00/MMBtu in
2011, $85/Bbl of oil and natural gas pricing of $5.50/MMBtu in 2012, and $86/Bbl of oil
and natural gas pricing of $6.00/MMBtu 2013 and beyond.
PXP Net Production
PXP Net Cash Flow
(1)(2) |
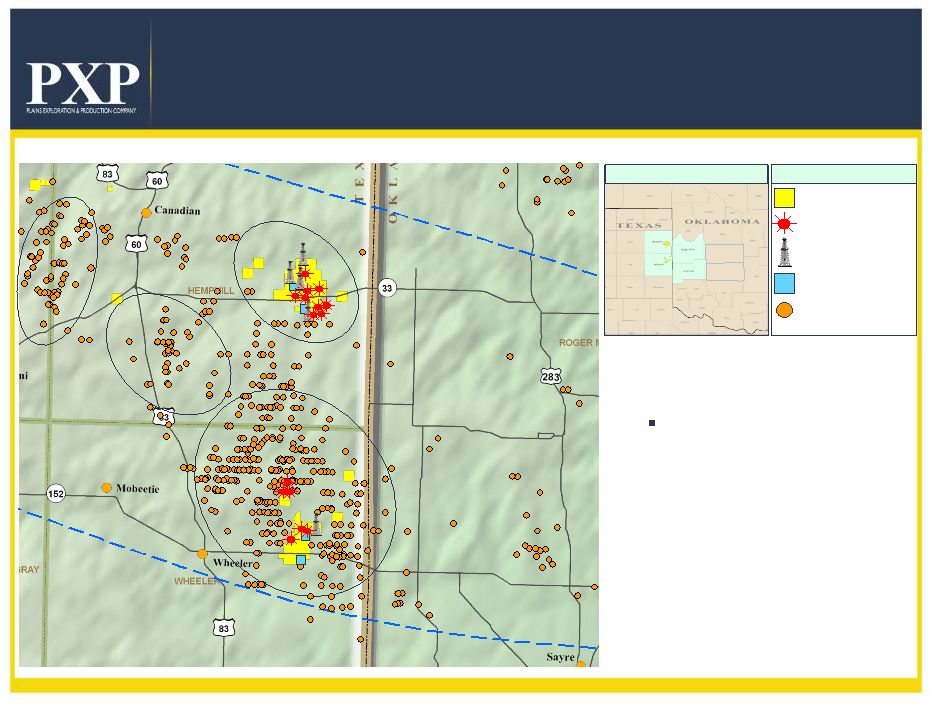 20
Granite Wash Horizontal Play
Activity Map
PXP Leases
PXP Producing Wells
Active Drilling
Waiting on Completion
Non PXP
Horizontal Wells
Custer
Washita
•
PXP acreage position
20,800 net acres
•
Five rigs currently operating
•
150 Granite Wash Locations
(PXP WI 93%)
•
Industry ROI 39% @
$5.00/MMBtu & $75/bbl
Legend
Location Map
Buffalo
Wallow Area
Marvin
Lake
Area
Wheeler
Area
NW. Mendota
Area |
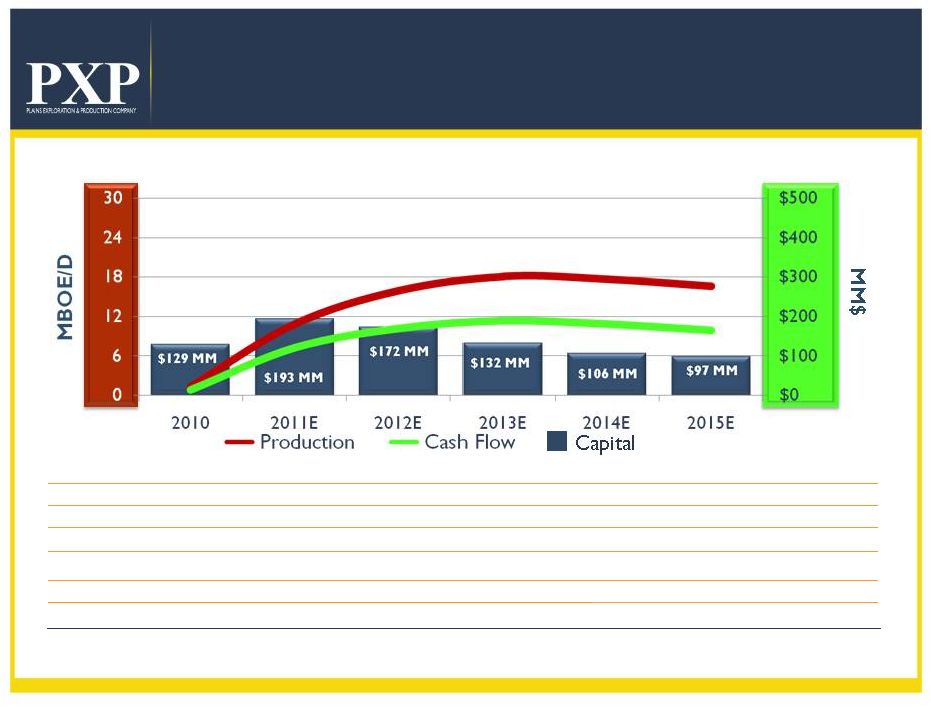 21
Granite Wash Horizontal Potential
Operational Plan
January 1, 2010 Project Cost Forward F&D:
$9.79/BOE or $1.62/Mcfe
(2)
PXP
Interest:
93% WI / 74%
NRI Net Acreage:
20,800
Potential
Locations:
152
Net Resource
Potential:
119.5 MMBOE
Average Gross Well Cost:
$8.2 MM
Average Gross EUR per Well:
1.1 MMBOE
PXP Net Production
PXP Net Cash Flow
(1)(2)
(1) Net revenue minus net expenses.
(2) Assumes $85/Bbl of oil and natural gas pricing of $5.00/MMBtu in 2011, $85/Bbl of
oil and natural gas pricing of $5.50/MMBtu in 2012, and $86/Bbl of oil
and natural gas pricing of $6.00/MMBtu 2013 and beyond.
|
 22
+1.6 Billion BOE Resource Potential
Potential Reserves
924 MMBOE
272 MMBOE
170 MMBOE
120 MMBOE
10 MMBOE
Region
Haynesville/Bossier
California
Eagle Ford
Granite Wash
Rockies
Potential Reserves
156 MMBOE
30 MMBOE
Region
Mowry Shale
Monterey Shale
1.5 Billion BOE
Development Resource Potential
+100 Million BOE
Exploration Resource Potential |
 23
Other Significant
Assets
1.
51MM
shares
of
MMR
representing
32.2%
(1)
of
their
common stock outstanding
As per MMR, “Unrisked potential for Ultra-Deep focus area: 30+ Tcfe
gross, 14+ Tcfe net
(2)
gross potential could exceed 100 Tcfe
.”
2. Deepwater GOM assets
As
per
APC,
“Gross
resource
potential
in
the
Lucius
field
is
approximately
300+
MMBOE”
+
1,000+
MMBOE
net
resource
potential
from
Phobos
and
additional
Pliocene,
Miocene
and
Tertiary
project
and
prospects.
(1)
As of March 31, 2011.
(2)
Assumes
MMR
has
rights
to
48%
NRI;
actual
WI
&
NRI
are
pending
unitization
and
parties’
participation
on
a
per
prospect
basis. |
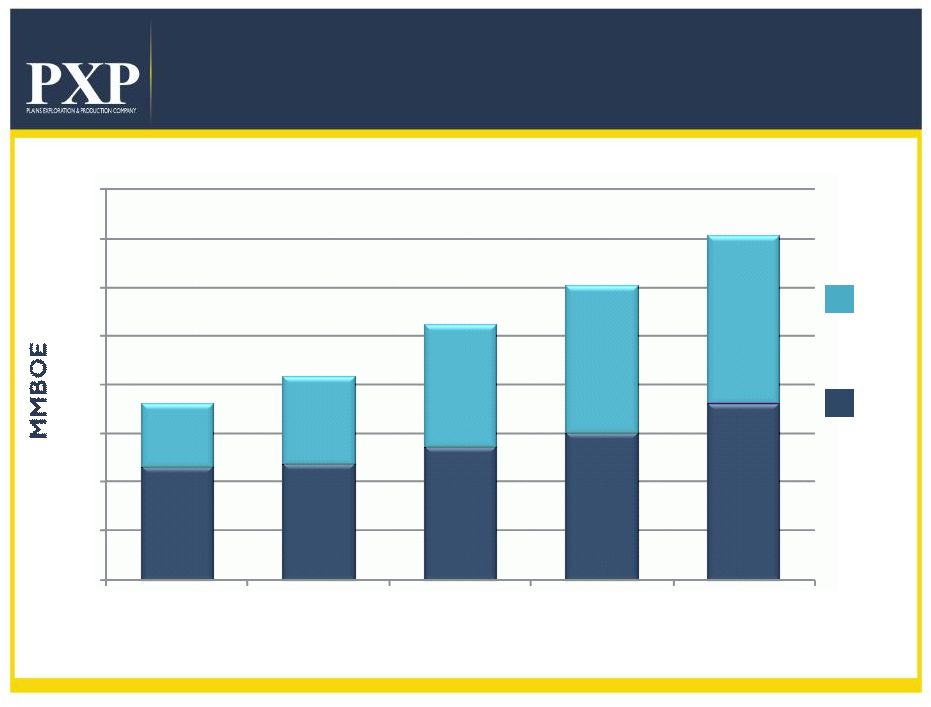 24
Proved
Reserves Target Growth
64%
64%
53%
53%
57%
57%
Proved
Developed
Proved
Undeveloped
50%
50%
51%
51%
(1)
Illustrates estimated reserves using NYMEX pricing.
Excludes deepwater Gulf of Mexico.
360
416
520
(1)
602
(1)
705
(1)
230
237
273
301
360
130
179
247
301
345
0
100
200
300
400
500
600
700
800
2009
2010
2011E
2012E
2013E |
 25
2009
2010
2011E
Proved Reserves Oil / Gas Split
360
416
520
(1)
60%
Oil
54%
Oil
53%
Oil
(1)
Illustrates estimated reserves using NYMEX pricing.
40%
Gas
46%
Gas
47%
Gas
0
100
200
300
400
500
600 |
 26
Stronger Financial Position
12/31/2008
12/31/2009
12/31/2010
3/31/2011
BALANCE SHEET ($ millions)
Cash
Investment -
MMR Common Stock
(1)
Secured
Debt
-
Senior
Revolving
Credit
Facility
Unsecured
Debt
-
Senior
Notes
Total
Debt
Net
Debt
(2)
Net
Debt to Proved Reserves ($/BOE)
Debt to Capital
Net Debt to Capital
$ 312
$ 2
$ 6
$ 4
-
664
732
1,305
230
620
125
1,500
2,420
2,725
3,326
$ 2,805
$ 2,650
$ 3,345
$ 3,451
$ 2,493
$ 2,648
$ 2,675
$ 2,715
$ 8.53
$ 7.37
$ 6.43
$ 6.53
(3)
54%
51%
45%
45%
50%
50%
44%
44%
(1)
At December 31, 2010 and March 31, 2011 the McMoRan ("MMR") shares were valued at
approximately $664.3 million, and $731.6 million respectively based on MMR's closing stock
price of $17.14 on December 31, 2010 and $17.71 on March 31, 2011 discounted to reflect certain restrictions on the marketability of the MMR
shares. Under the terms of the stockholder agreement with MMR, we are generally prohibited from
transferring any of our shares of MMR until December 30, 2011. In addition, the market price
of MMR common stock may decline substantially before we sell them.
(2)
Net of Cash and Investment in MMR common stock.
(3)
Calculated utilizing December 31, 2010 proved reserves. |
 27
PXP Targets Over Next 3 Years
•
Grow reserves 15% to 20% per year over the next 3
years
•
Grow production 10% to 15% per year over the next
3 years
•
Efficiently manage business focusing on cost reduction
and profitability
•
Maintain conservative balance sheet with active
hedging program
•
Focus drilling on high liquid development projects to
increase total percentage of oil production
•
Opportunistically monetize significant other assets |
 28
Addendum |
 29
(Millions, except for share data)
Quarter
Ended
3/31/2011
Quarter
Ended
3/31/2010
Revenues
$ 430.3
$ 384.1
Production Costs
(122.0)
(110.1)
General & Administrative
(36.0)
(37.4)
DD&A & Accretion Expense
(138.8)
(126.8)
Legal Recovery
–
8.4
Other Operating Income
0.3
0.6
Income From Operations
$ 133.8
$ 118.8
Income Before Income Taxes
$ 118.2
$ 106.2
Net Income
$ 71.0
$ 58.5
Earnings Per Share –
Diluted
$ 0.49
$ 0.41
Income Statement Summary |
 “People
building
value
together
to
find
and
produce
energy resources safely, reliably and efficiently”
|