Attached files
| file | filename |
|---|---|
| 8-K - FORM 8-K - KEMPER Corp | d8k.htm |
 1
Shareholder Meeting
May 4, 2011
EXHIBIT 99.1 |
 CEO’s Remarks
Donald G. Southwell
Chairman, President & Chief Executive Officer |
| Explanatory Note:
This presentation may contain or incorporate by reference information that includes
or is based on forward-looking statements within the meaning of Section
27A of the Securities Act of 1933 and Section 21E of the Securities Exchange Act
of 1934. Forward-looking statements give expectations or forecasts of future
events. These statements can be indentified by the
fact
that
they
do
not
relate
strictly
to
historical
or
current
facts.
They
use
words
such
as
“believe(s),”
“goal(s),”
“target(s),”
“estimate(s),”
“anticipate(s),”
“forecast(s),”
“project(s),”
“plan(s),”
“intend(s),”
“expect(s),”
“might,”
“may”
and other words and
terms of similar meaning in connection with a discussion of future operating
financial performance or financial condition. Forward-looking
statements, in particular, include statements relating to future actions, prospective services or products,
future performance or results of current and anticipated services or products,
sales efforts, expenses, the outcome of contingencies such as legal
proceedings, trends in operations and financial results. These statements are
based on current expectations and the current economic environment. They involve a number of risks
and uncertainties that are difficult to predict. These statements are not
guarantees of future performance; actual results could differ materially from
those expressed or implied in the forward-looking statements. Forward-looking statements can be
affected by inaccurate assumptions or by known or unknown risks and
uncertainties. No assurances can be given that the results
contemplated in any forward-looking statements will be achieved or will be achieved in any particular timetable. The
Company assumes no obligation to publicly correct or update any forward-looking
statements as a result of events or developments subsequent to the date of
this presentation. The reader is advised, however, to consult any further disclosures
Unitrin makes on related subjects in its filings with the SEC.
Non-GAAP Measures:
This presentation contains non-GAAP financial measures to analyze the
company’s operating performance for the periods presented in this
presentation. Because Unitrin’s calculation of these measures may differ from similar
measures used by other companies, investors should be careful when comparing
Unitrin’s non-GAAP financial measures to those of other
companies. For detailed disclosures on non-GAAP financial measures included in this
presentation and their GAAP reconciliations, where warranted, please refer to the
discussion at the end of this presentation, which is also posted on the
Unitrin website at www.unitrin.com. |
 Unitrin Overview
2010 Performance
-
Financial Highlights
-
Investments
-
Capital
Segment Operating Results
Fireside Bank Update
1st Quarter Performance
Priorities
Today’s Agenda |
 Unitrin Overview
A multi-line insurer with a national footprint
–
22
nd
largest
personal
lines
writer
and
20
th
largest
auto
insurer
in
the
United
States
(1)
–
Auto, home and basic protection products
–
Multi-channel distribution network
Conservative balance sheet with strong liquidity
–
$8.4billion
assets,
$2.1billion
shareholders’
equity,
22%
debt
to
capital
ratio
–
94% of fixed maturity portfolio rated investment grade
History of opportunistic acquisitions and successful integration
Experienced management team with long-term association with the Company
|
 2010
Performance |
 2010
Financial Highlights Net Income: $184
$95
$70
$19
Life &
Health
P&C
Other
Revenues:
Earned Premium:
Solid earnings performance in 2010
–
A focus on maintaining margins amidst soft P&C
pricing environment and slow, general recovery
–
Revenues declined modestly with tighter
underwriting and pricing actions
–
Unusual Q4 winter storms ~($15 million) impact
Fireside exceeded expectations
Reduced selective concentrations in
investment portfolio to lower risk and
volatility; yields maintained
Re-financed senior debt
($ Millions)
$2,289
$2,743 |
 Investment Portfolio
Well diversified across asset classes
–
Low single-name exposure limits
–
Partnerships / LLC’s spread across multiple
funds and managers
–
~50 real estate properties, Essentially debt free
Solid liquidity and strong new cash flows
Equities (3)
$550
Real
Estate
$250
Other (2)
$245
LP
LLC
$328
Short
Term
$403
Fixed Maturities
$4,475
72%
34%
6%
9%
5%
4%
4%
$6,251
Pre-tax Equiv. Book
Yield
6.2%
Gross Unrealized G / (L)
$335
Average Duration (4)
~7 years
Corporate
Bonds
$2,145
States &
Political
Subdivisions
$1,344
US Gov’t
Bonds
$537
Pre-refunded -
backed by US
Gov’t Securities
$449
22%
9%
7%
Reported $328 million of Net Investment
Income
($ Millions) |
 Capital & Liquidity
2008
2009
2010
$2.2
$2.5
$2.7
Total Capital
Senior Debt
Shareholders Equity
Debt to Total Capital
25%
23%
22%
Interest Coverage (5)
4x
7x
7x
Hold Co. Facility ($ Millions)
$312
$245
$245
Balance sheet flexibility continues to improve
–
Portfolio shifts since the economic crisis reduced overall sensitivity to market
fluctuations
–
Liquidity remains high and interest coverage ratios have improved
significantly –
Well positioned to fund growth AND manage risks
($ Billions) |
 Focused on Shareholder Value
Book Value
Per Share
Dividends Paid
2009
2010
$30.75
$1.07
UTR Share Price
Earnings Per Share
$2.64
$2.98
$0.89
$34.61
$35.01
3/31/11
$0.88
$0.24
2009
2010
3/31/11
2009
2010
Q1 ‘11
$22.05
$24.54
$30.88
Price to Book
0.72x
0.71x
0.88x
Payout Ratio (6)
41%
30%
27%
Book value has recovered well since
crisis through both earnings and asset
valuations
Share price has increased closer to
book value
Adjusted dividend to $0.20 during the
economic crisis & subsequently
increased twice
Repurchased $22 million of common
stock in the first quarter of 2011 |
 Capital Deployment Priorities
1.
Fund Organic Growth
Maintain or improve margins in all lines
Build growth capital while pricing environment recovers
2.
Acquisitions
Bolt-on Standard & Preferred opportunities
Geographic expansion in Non-standard
Leverage scale in Life operations
$300 million program approved February 2011
Maintain a flexible, measured approach
3.
Dividends
Remain competitive
4.
Share Repurchase |
 Operating Results |
 Kemper Segment
Auto
2009
2010
2009
2010
585
545
56
81
8
(30)
Catastrophes &
Reserve Development
Underlying Net Income
*
Earned Premiums
347
343
$932
$888
Homeowners
& Other
Underlying
Combined Ratio
*
96.7% 93.6%
Net Income
$64
$51
Focused on improving profit margins
–
Disciplined underwriting approach
–
Mix shift towards packaged offerings
–
Underlying combined ratio improved 300bps
Ongoing assessment of catastrophe risk;
no shift in strategy identified
–
Overall frequency increasing, particularly
tornados, hail and wind
Underlying Net Income up >40%
Net Income
as Reported
* Non-GAAP
measure discussed at the end of this presentation. ($ million)
|
 * Non-GAAP measure discussed at the end of this presentation.
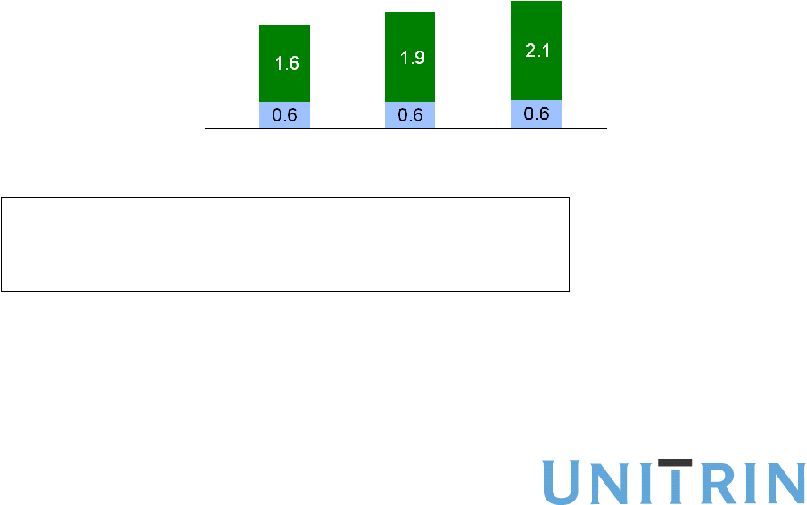
Unitrin Specialty Segment
Personal
2009
2010
2009
2010
472
431
21
25
3
(5)
Earned Premiums
56
44
$528
$475
Commercial
Underlying
Combined Ratio
*
98.9%
98.7% Net Income
$24
$20
Specialty non-standard market remains
highly competitive
–
Significant downward pricing pressure in
commercial lines
–
Business remains focused on maintaining
margins; top line declined ~10%
Selectively re-pricing as needed, while
launching auto product with improved risk
and pricing segmentation
Net Income
as Reported
Underlying Net Income
*
Catastrophes &
Reserve Development
($ million) |
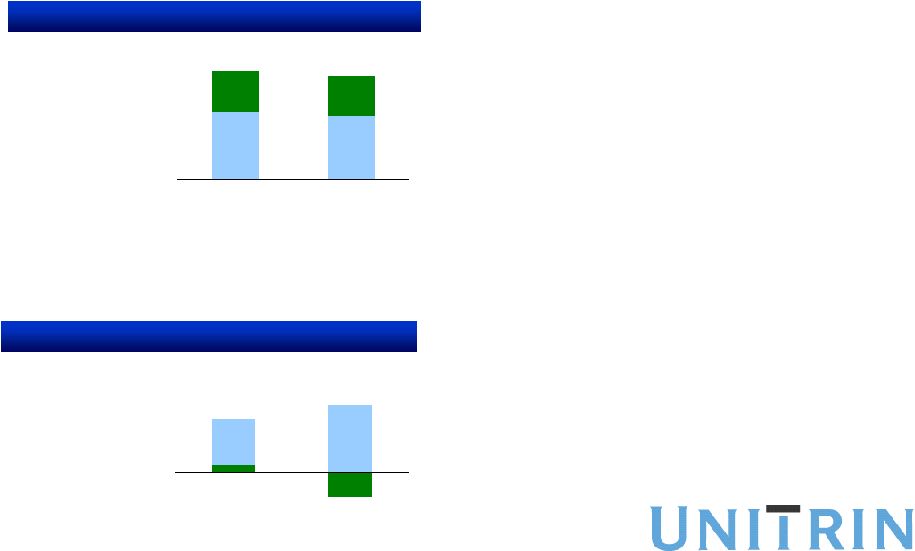
 Unitrin Direct Segment
2009
2010
6
3
(11)
(4)
Earned Premiums
Underlying
Combined Ratio
*
111.9%
111.9% Net Loss
($5)
($1)
All Lines
2009
2010
$346
$282
Transition continues on several fronts…
Product & distribution
–
New product launched late 2010; in 13 states
–
Offering both auto & home
–
Redesigned customer online experience
Platform integration
–
Consolidating acquisition infrastructure
–
Leveraging broader P&C shared services
Focused on Profitability Improvement
Net Loss
as Reported
Underlying Net Loss
*
Catastrophes &
Reserve Development
* Non-GAAP
measure discussed at the end of this presentation. ($ million)
|
 Life & Health Insurance Segment
Life
2009
2010
2009
2010
400
110
(15)
$112
$95
Goodwill Write-off
Net Income
Ex-GW Write-off
*
Earned Premiums
159
92
$651
397
162
85
$644
Accident & Health
Property
Net Income
Life and Health continued to perform well
Top line steady amidst tough economic
cycle
Retention of Career Agents improved; well
positioned for 2011
Reserve National reported strong results
despite the uncertainties of national
healthcare reform
Earnings stable excluding unusual non-cash
goodwill charge
112
* Non-GAAP
measure discussed at the end of this presentation. ($ million)
|
 Fireside Bank Update |
 Wind-down plan ahead of schedule
Receivables down ~75% since 3/09
All deposits paid off in April 2011…have
initiated actions to turn in bank charter by
end of 2011
Begin returning $250+ million of capital
without FDIC restriction by year-end …
strong cash flows forecasted
Fireside Bank
Certificates of Deposits
$321
$1,054
$0
3/31/09
12/31/10
4/30/11
Net Automobile Loan Receivables
$381
$1,125
$290
3/31/09
12/31/10
4/30/11E
Tier One Capital Ratio (7)
16%
37%
53%
3/31/09
12/31/10
4/30/11E
Now in final phase of wind-down
($ million) |
 1
Quarter
Performance
st |
 1
st
Quarter 2011 Performance
Net Income: $54
$33
$12
$9
Life &
Health
P&C
Other
Revenues:
$657 Earned Premium: $546
Solid earnings growth of 12%
–
Life & Health performed ahead of expectations +
favorable unusual adjustment
–
Fireside contributed $8 million in Net Income
–
P&C earnings decreased; less favorable
development and higher auto losses
Evaluating impact of Q2 Catastrophes
Teams focused on meeting customer needs
($ million) |
| Priorities
Surrender bank charter and begin repatriation of Fireside capital
Position A&H product suite to adapt to healthcare reform evolution
Remain disciplined in a competitive P&C environment
Transition Direct business to sustainable profitability
Enhance risk management framework and tools
Deploy
excess
capital
to
opportunities
accretive
to
earnings
and
ROE
–
Organic top line growth where target margins can be achieved
–
Acquisitions with a special focus on standard and preferred personal lines
–
Flexible buy-back program |
 22 |
 Non-GAAP Measures
Underlying Combined Ratio
The Life & Health Net Income excluding a Goodwill Write-off
Underlying Net Income and Underlying Net Loss
is a non-GAAP measure, which is computed by adding the Current Year
Non-catastrophe Losses and LAE Ratio with the Incurred Expense Ratio.
The most directly comparable GAAP financial measure is the combined ratio,
which uses total incurred losses and LAE, including the impact of catastrophe losses, and loss
and LAE reserve development. We believe the Underlying Combined Ratio is useful to
investors and is used by management to reveal the trends in our Property
and Casualty businesses that may be obscured by catastrophe losses
and
prior
prior-year
reserve
development.
These
catastrophe
losses
may
cause
our
loss
trends
to
vary
significantly between periods as a result of their incidence of occurrence and
magnitude, and can have a significant impact on incurred losses and LAE and
the Combined Ratio. Prior Prior-year reserve developments are caused by
unexpected loss development on historical reserves. Because reserve development
relates to the re-estimation of losses from earlier periods, it has no
bearing on the performance of our insurance products in the current period.
We believe it is useful for investors to evaluate these components separately and
in the aggregate when reviewing our underwriting performance. The
Underlying Combined Ratio should not be considered a substitute for the
Combined Ratio and does not reflect the overall underwriting profitability of our
business. is a non-GAAP measure, which is computed as reported
Life and Health Insurance segment Net Income, excluding a 2010 Reserve National
Goodwill write-off. The most directly comparable GAAP measure is the
Total Life and Health Insurance segment Net Income. We believe the P&C
and Life net income excluding a Goodwill write-off is useful to investors and
is used by management to reveal the trends in business.
are non-GAAP measures, which are computed as net income or loss
reported by the segment, excluding the effect of catastrophes and reserve
development. The most directly comparable GAAP measure is the respective
segment’s net income or loss. We believe that underlying Net Income and
Underlying Net Loss are useful to investors and are used by management to
reveal the trends in our Property and Casualty business that may be
obscured by catastrophe losses and prior year reserve development. |
 Reconciliation of Non-GAAP Measure
UNDERLYING COMBINED RATIOS:
Kemper:
2009
2010
Underlying Combined Ratio
96.7%
93.6%
Catastrophe Losses (excluding reserve development)
5.1%
7.9%
Loss Reserve Development (Favorable) Unfavorable
(6.5)%
(2.7)%
GAAP Reported Combined Ratios
95.3%
98.8%
Unitrin Specialty:
2009
2010
Underlying Combined Ratio
98.9%
98.7%
Catastrophe Losses (excluding reserve development)
0.8%
0.6%
Loss Reserve Development (Favorable) Unfavorable
(1.5)%
0.8%
GAAP Reported Combined Ratios
98.2%
100.1%
Unitrin Direct:
2009
2010
Underlying Combined Ratio
111.9%
111.9%
Catastrophe Losses (excluding reserve development)
0.9%
0.6%
Loss Reserve Development (Favorable) Unfavorable
(3.5)%
(2.4)%
GAAP Reported Combined Ratios
109.3%
110.1% |
 Footnotes
(1)
Source: SNL Financial based on 2010 Direct Premium Written
(2)
Primarily loans to policyholders
(3)
Includes $125 million of Preferred Stock
(4)
Average Duration is the average option adjusted duration weighted by market value
at the measurement date for Unitrin’s Life Insurance and Property and
Casualty Insurance assets under management consisting of the following
asset classes: Cash and Short Term, Fixed Income Securities, and
Preferred Stocks treated as Equity securities on our GAAP financials.
(5)
Interest Coverage is calculated as (Unencumbered Parent Company Cash + Maximum
Ordinary Dividend) / Interest on Senior Debt.
(6)
Payout
Ratio
is
the
dividends
paid
by
Unitrin
as
a
percentage
of
Unitrin’s
Net
Income.
(7)
Ratio of Tier 1 Capital to total average assets |