Attached files
| file | filename |
|---|---|
| 8-K - FORM 8-K - QCR HOLDINGS INC | f8k_050411.htm |

WELCOME
2011 Annual Meeting of Stockholders
May 4, 2011
James J. Brownson, Chairman

QCR Holdings, Inc.
Brief Financial Review
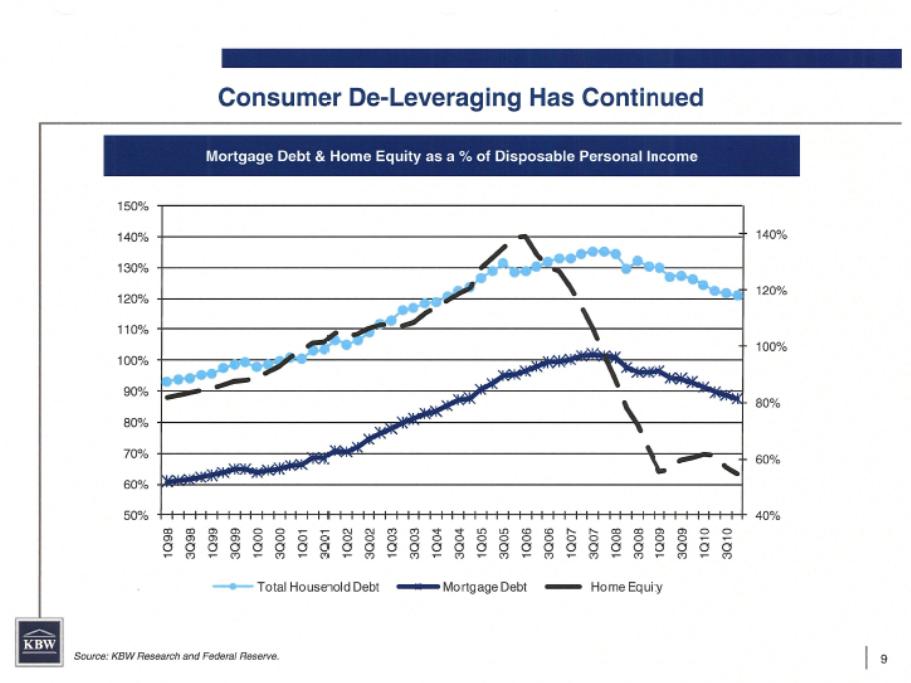
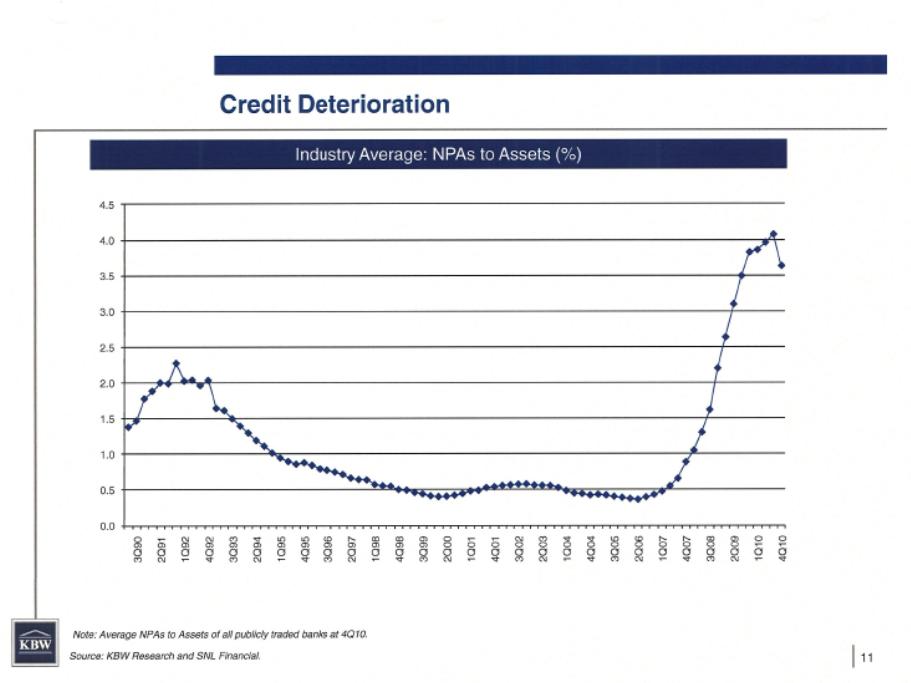
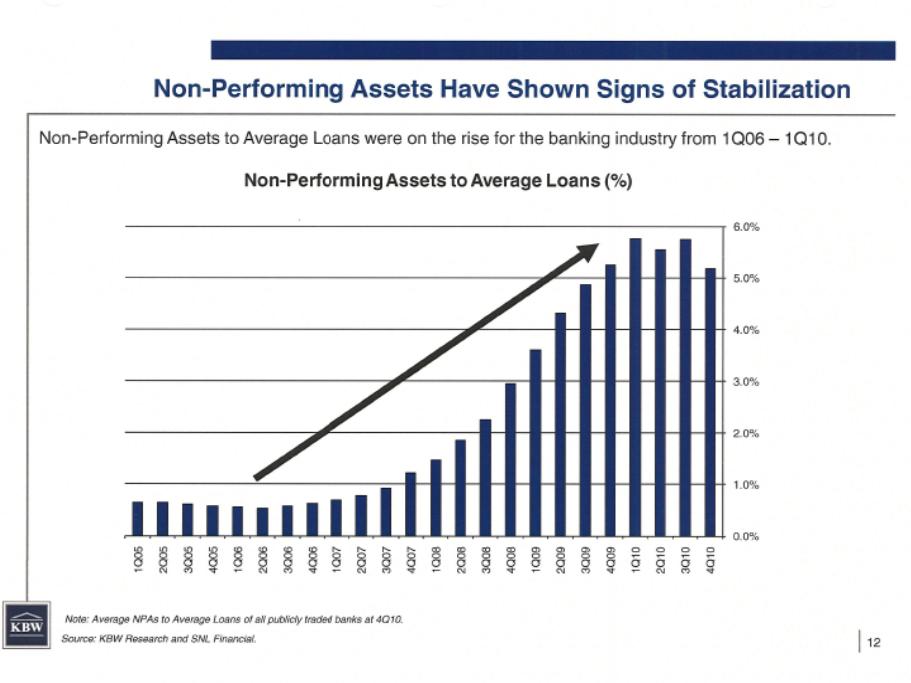
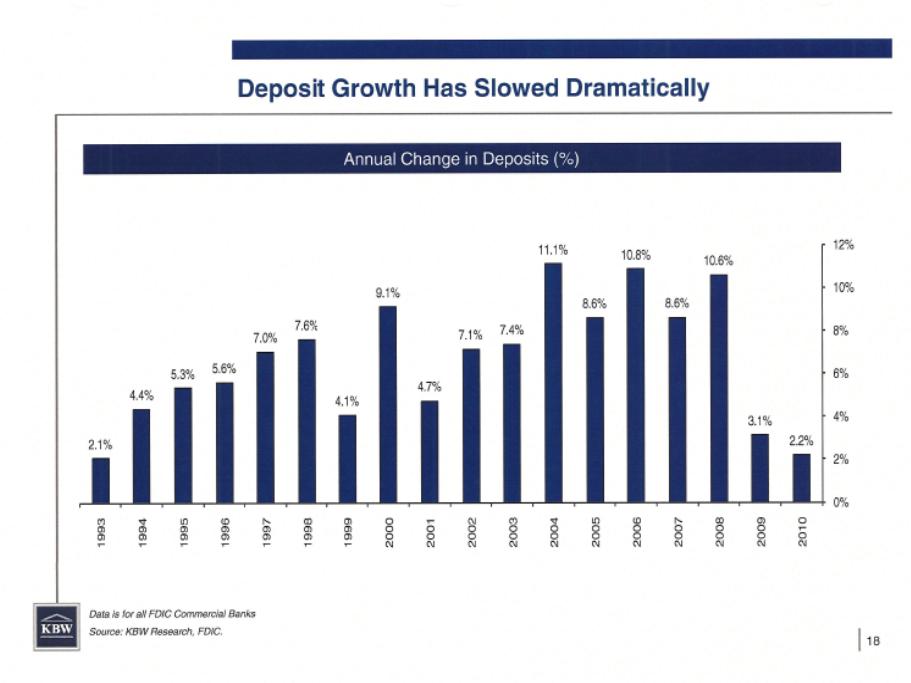
Key Industry Issues
QCR Holdings, Inc. Strategic Direction

SEC Disclosure
Some of the information we will be providing today falls
under the guidelines for forward-looking statements as
defined by the SEC.
under the guidelines for forward-looking statements as
defined by the SEC.
As part of these guidelines, we must point out that any
statements made during this meeting that discuss our
hopes, beliefs, expectations or predictions of the future
are forward-looking statements, and our actual results
could differ materially from those projected. Additional
information on these factors is included from time to time in
our 10-K and 10-Q filings which can be obtained
by contacting the Company or the SEC.
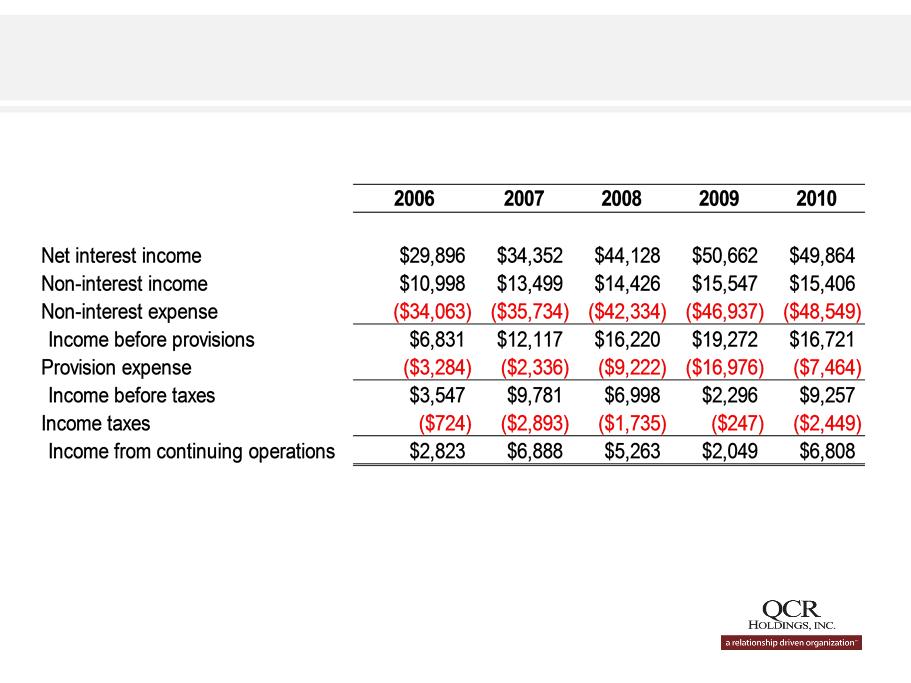
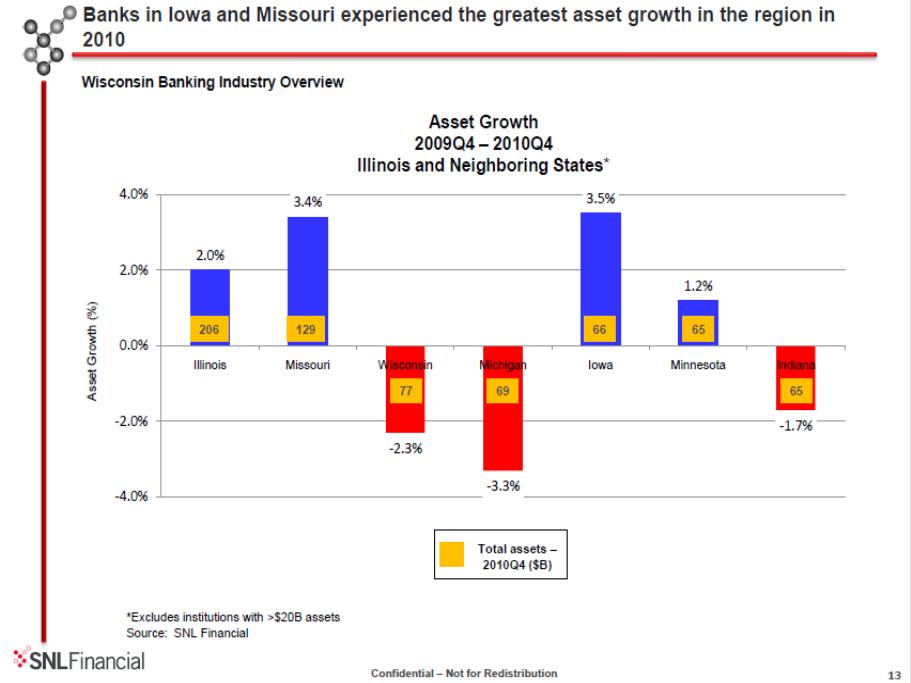
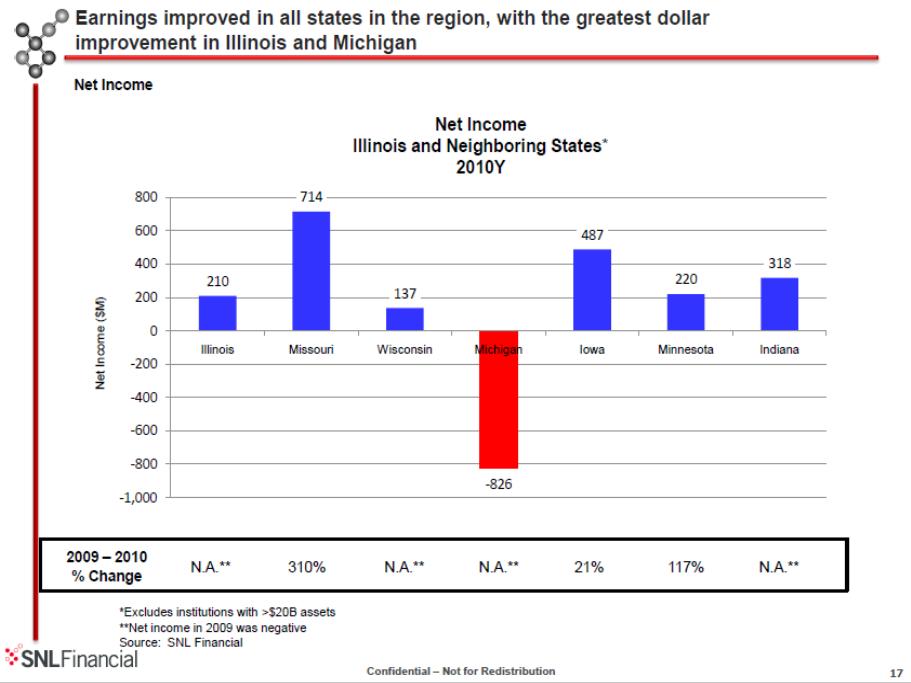
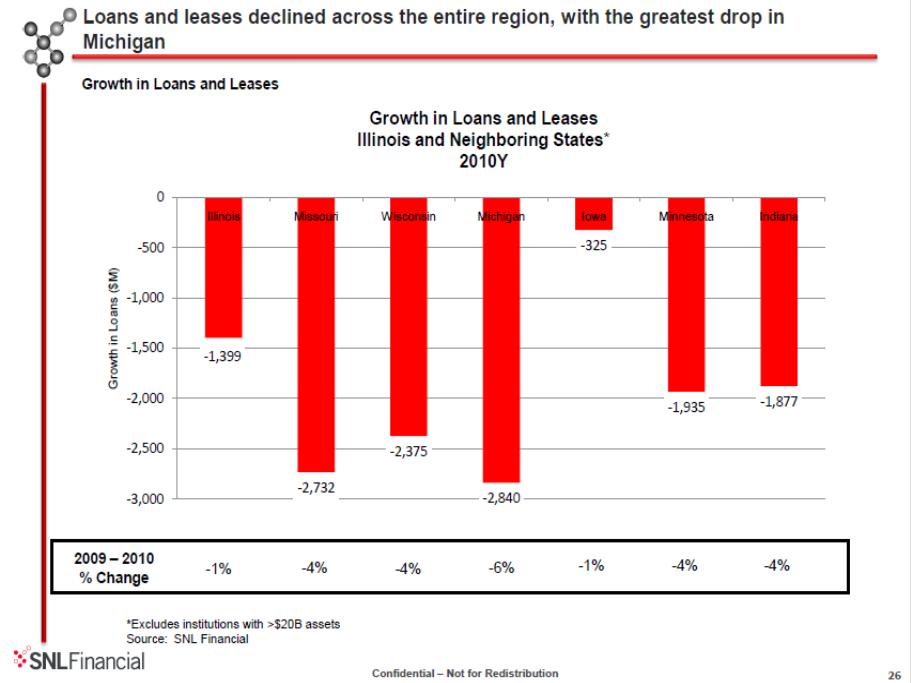
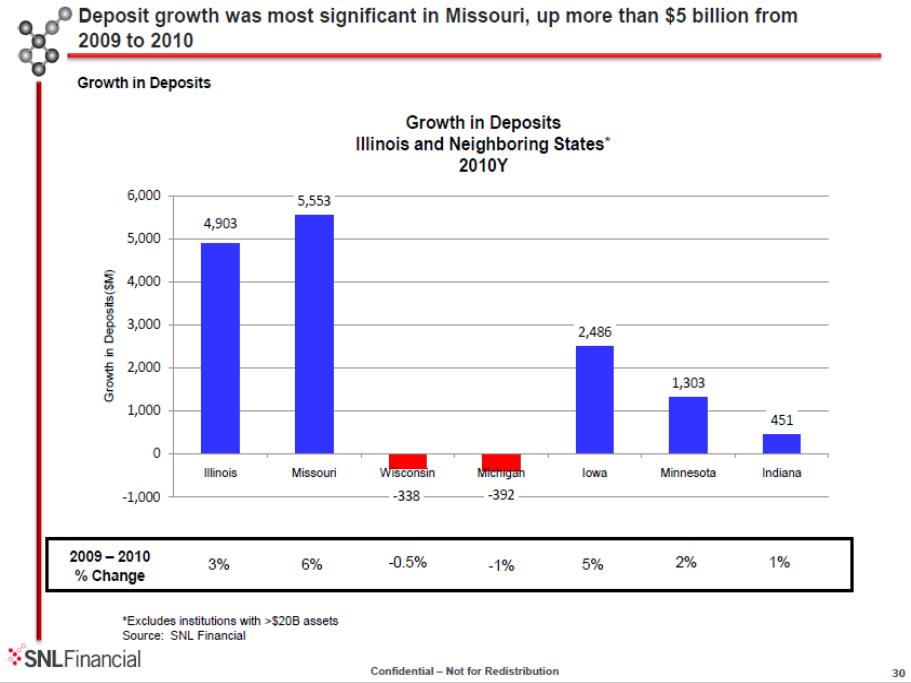
Summary of Financial Results 2006 - 2010
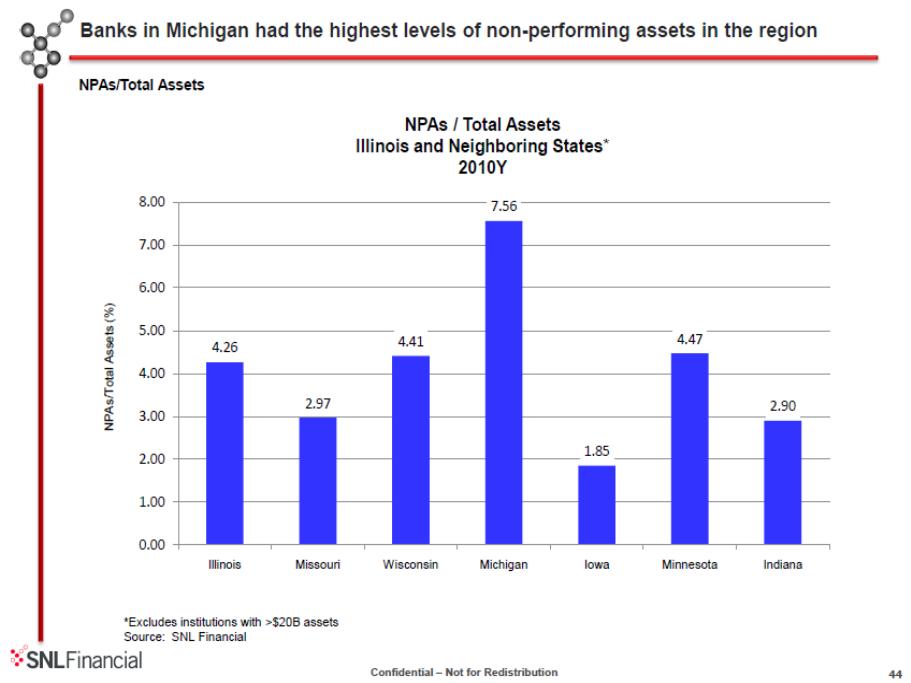
Source: SNL Financial
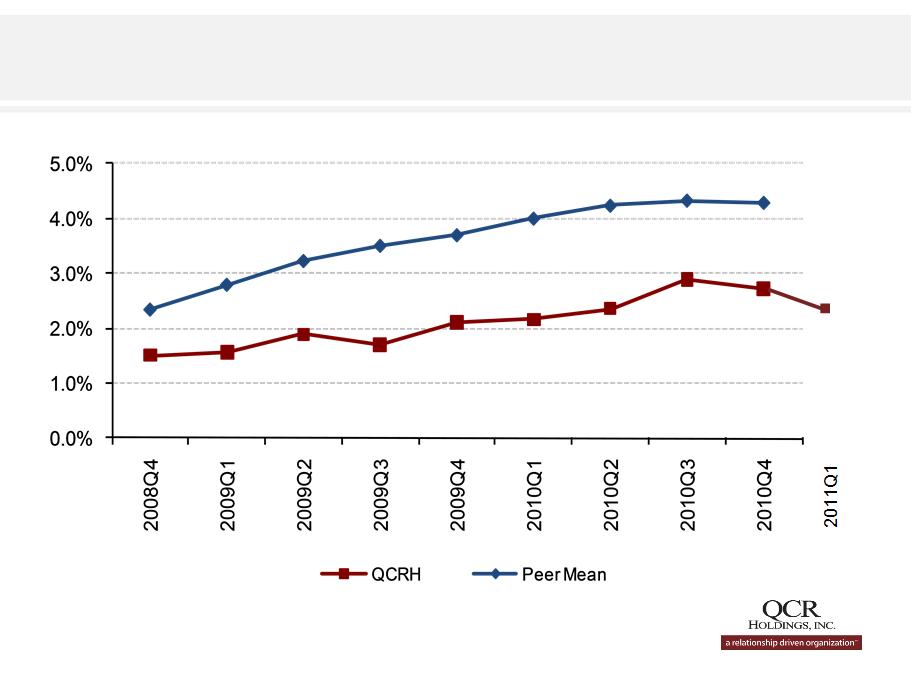
NPAs / Total Assets
4.34%
2.73%
2.36%
Source: SNL Financial
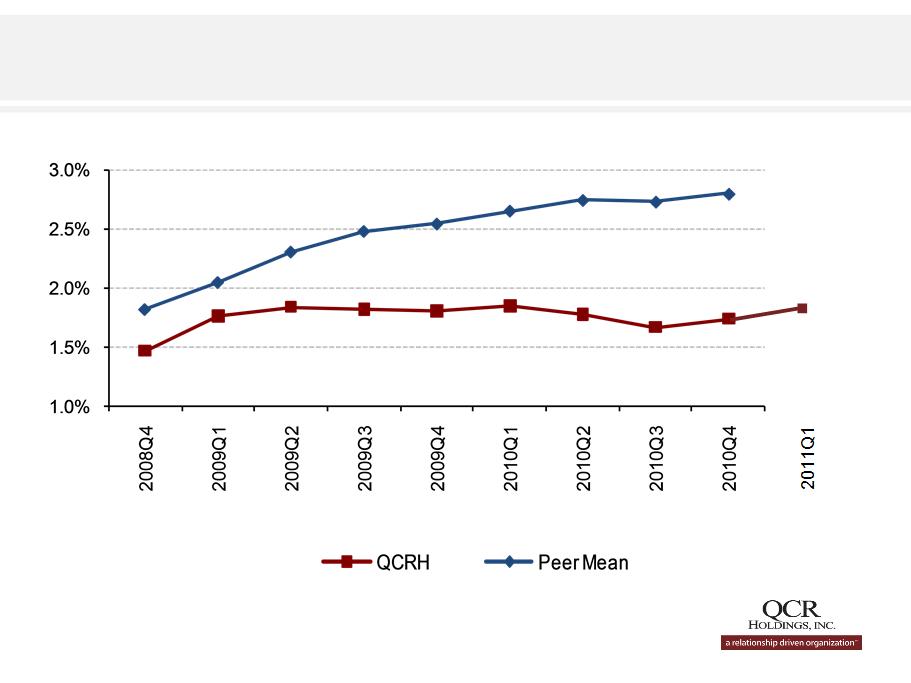
Reserves / Loans
2.79%
1.74%
1.79%
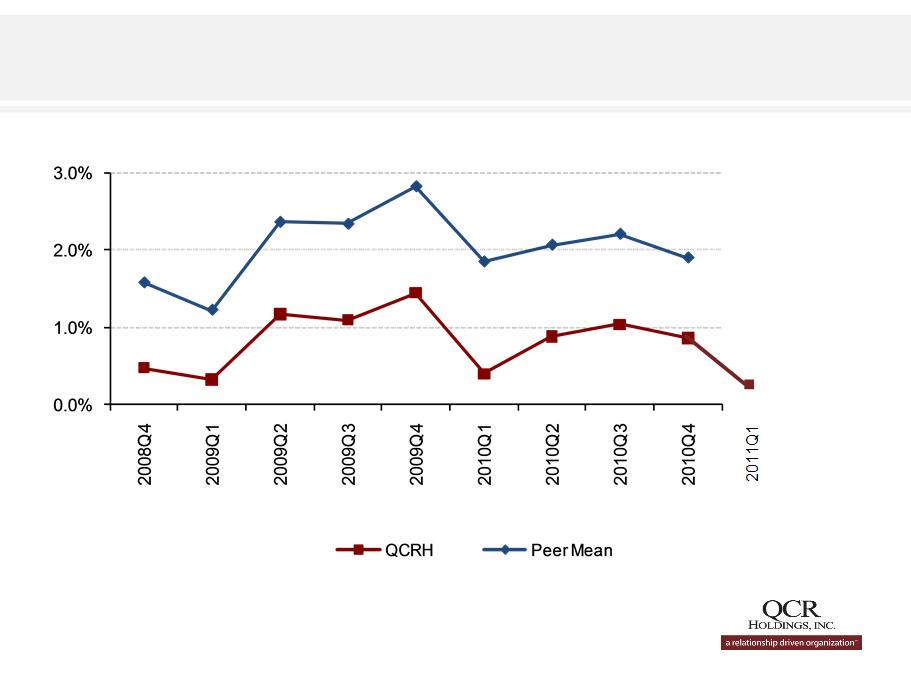
Source: SNL Financial
NCOs / Average Loans
.87%
1.90%
.24%
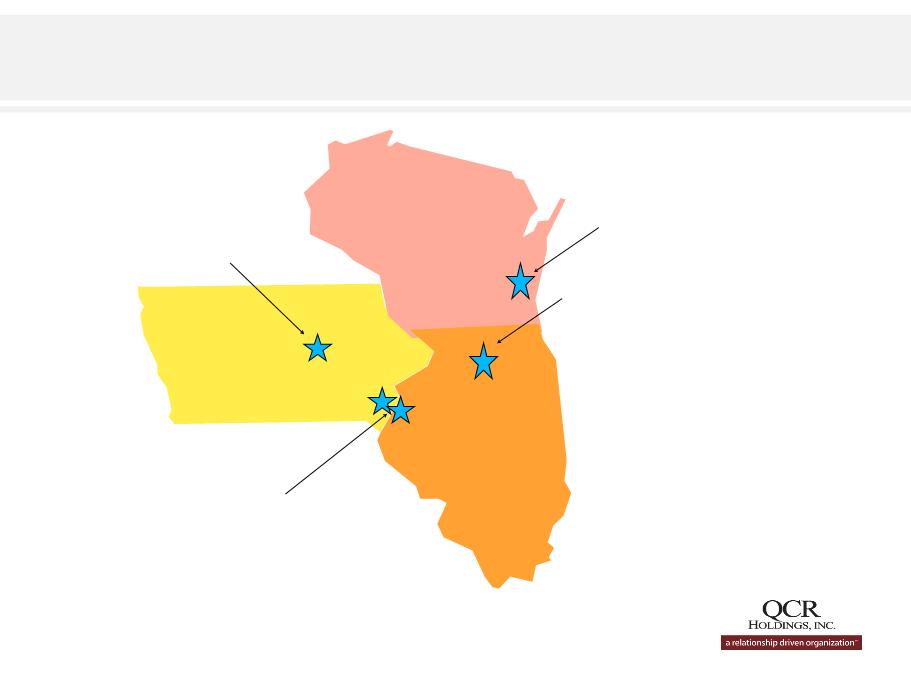
Rockford, IL
Quad Cities, IA & IL
Cedar Rapids, IA
Brookfield, WI
QCR Holdings, Inc. Subsidiary Locations

First Quarter 2011 Market Composites*
Total Return
Quarter One Year
Stocks
Dow Jones Industrial Average 7.07% 16.49%
Standard & Poor 500 5.92% 15.65%
Large-Cap Core 5.41% 13.47%
Multi-Cap Core 6.07% 16.69%
U.S. Diversified Equity Fund Average 6.04% 17.65%
Bonds
Short-Intermediate U.S. Government 0.10% 2.59%
Intermediate U.S. Government 0.03% 3.68%
Short-Intermediate Municipal Debt 0.39% 1.86%
Intermediate Municipal Debt 0.62% 2.08%
* Source: Barrons - Lipper Mutual Funds Quarterly - 4/9/11
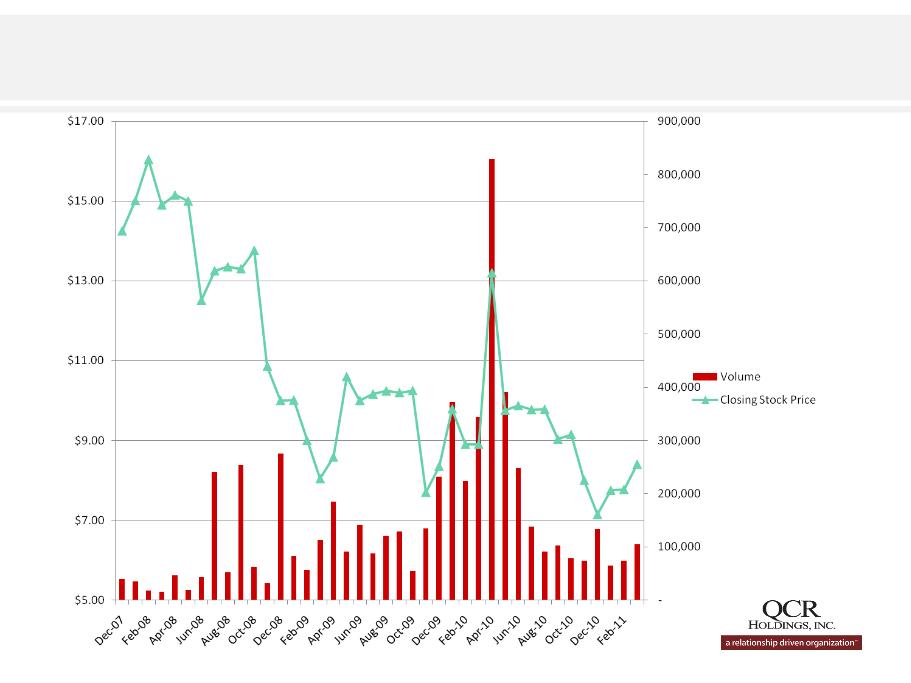
QCR Holdings, Inc. Closing Stock Price and Volume Last 3
years
years
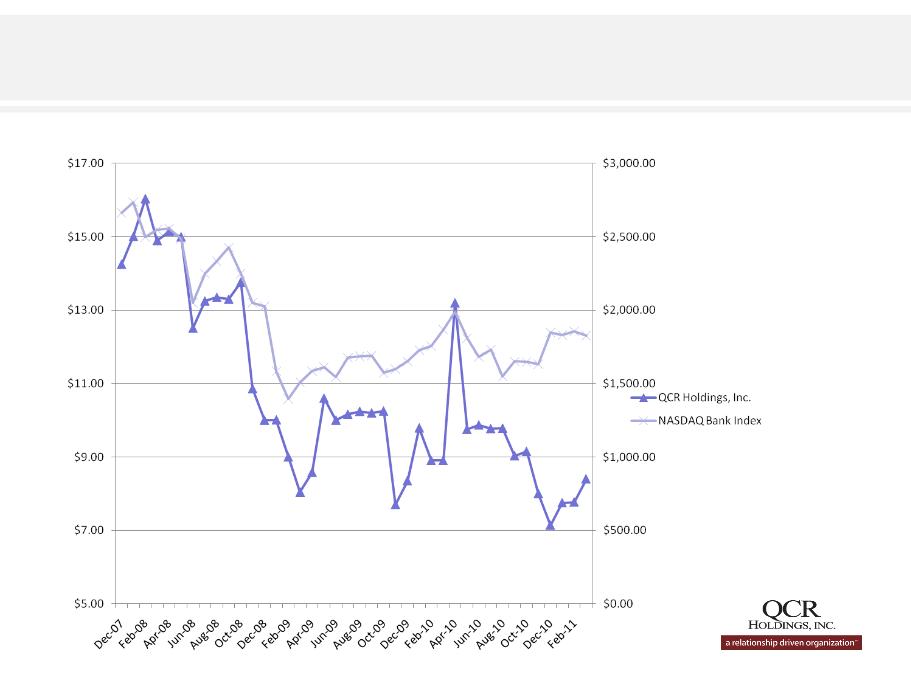
Closing Price - QCR Holdings, Inc. and NASDAQ Bank
Index Last 3 years
Index Last 3 years
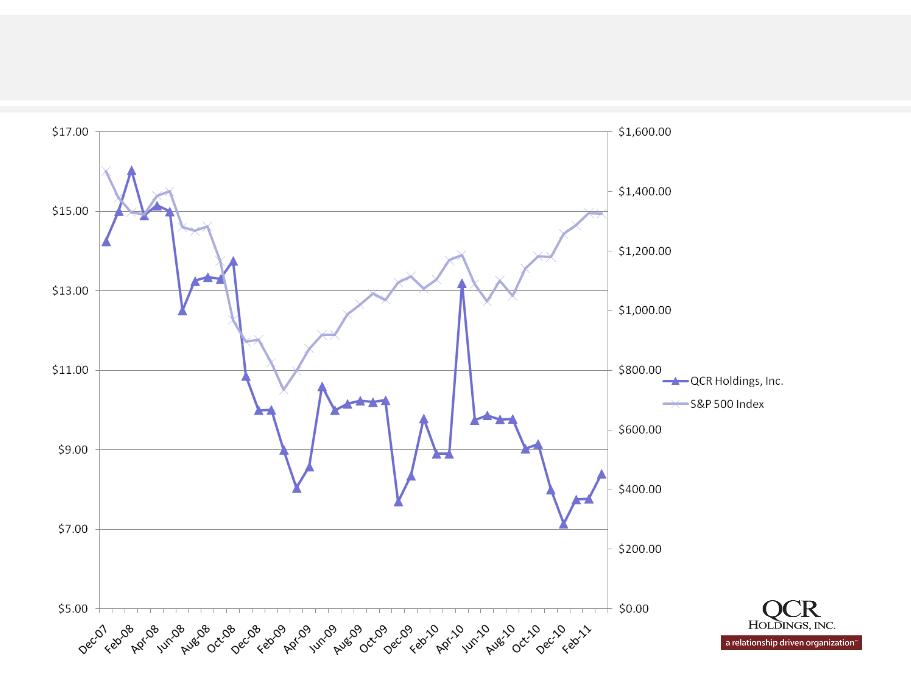
Closing Price - QCR Holdings, Inc. and S&P 500 Index
Last 3 years
Last 3 years
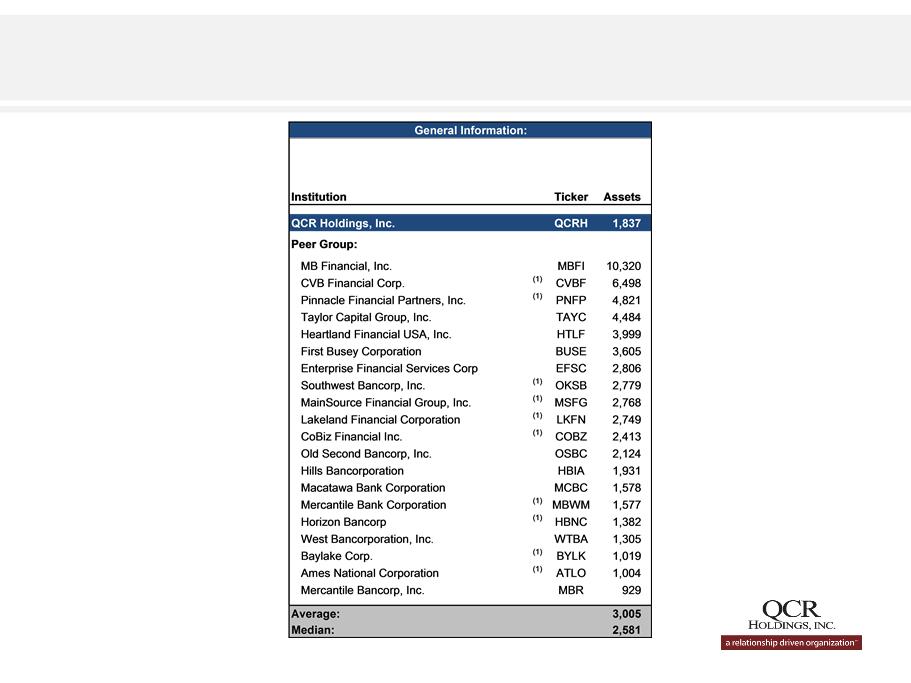
Source: SNL Financial. Data for the quarter ended 12/31/2010
(1) Data as of 3/31/2011
Proxy Peer Group
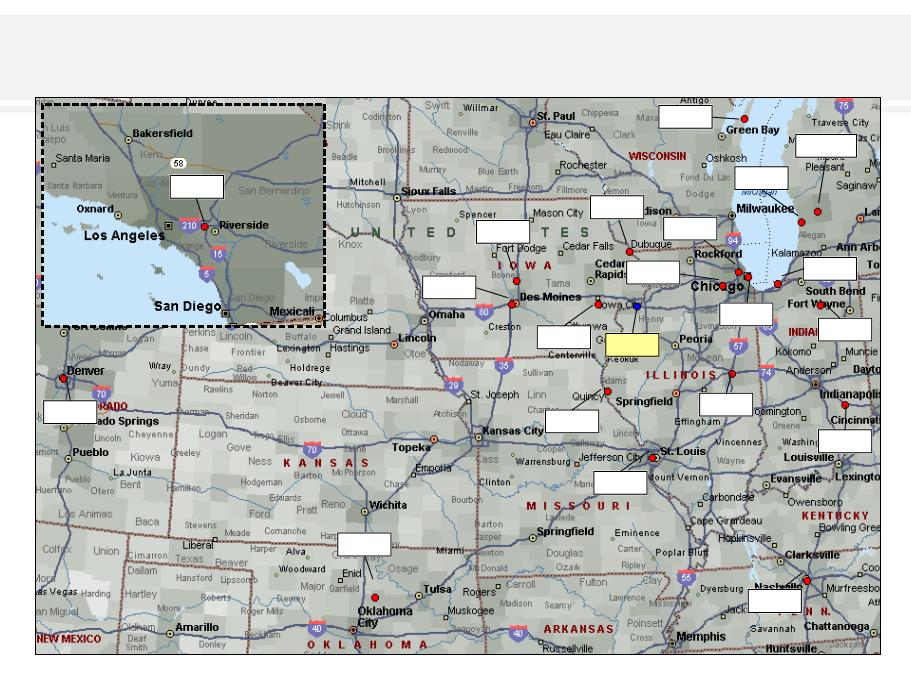
Source: SNL Financial, MapPoint
COBZ
CVBF
OKSB
ATLO
WTBA
HBIA
QCRH
MBR
EFSC
PNFP
HTLF
BUSE
BYLK
MSFG
LKFN
HBNC
OSBC
TAYC
MBFI
MCBC
MBWM
Proxy Peer Group - Headquarters Map

Peer Comparisons
|
|
QCRH
|
Average
|
Median
|
|
Assets
|
$1.8 Billion
|
$ 3 Billion
|
$2.6 Billion
|
|
Total Capital
|
13.7%
|
14.3%
|
15.2%
|
|
TCE
|
3.56
|
6.38
|
6.87
|
|
Texas Ratio
|
33.6
|
58.8
|
35.3
|
|
NPAs/Assets
|
2.7
|
4.3
|
3
|
|
ROE
|
5
|
(7)
|
6
|
|
Efficiency
|
68
|
64
|
64
|
|
Price/Tangible Book
|
0.6
|
1.4
|
1.4
|
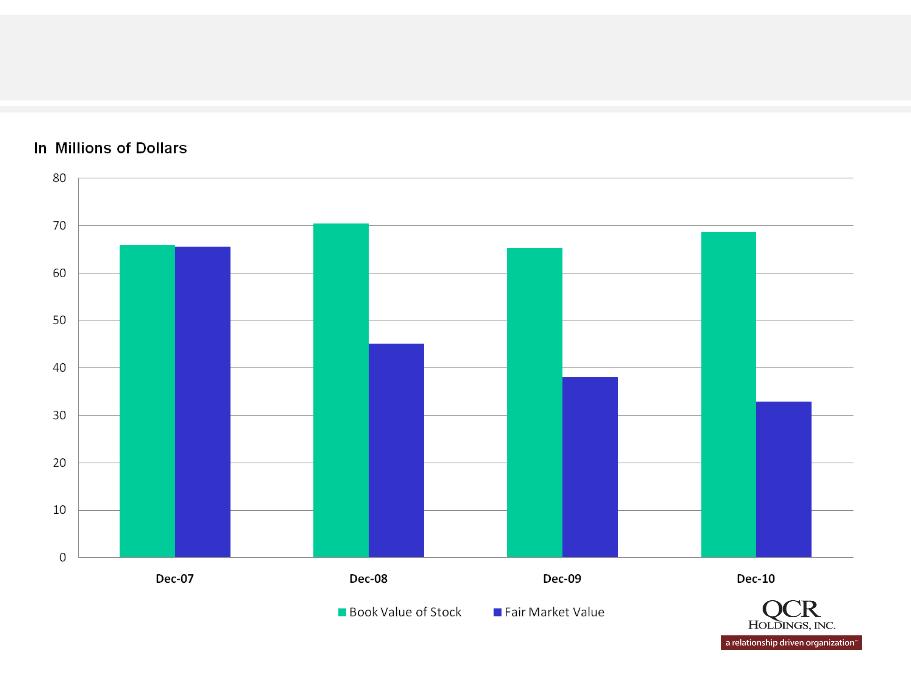
Book Value Per Share vs. Market Value Per Share
46.80%

Issues Impacting Market Value Per Share
• Low Tangible Common Equity Ratio - More Common
Shares?
Shares?
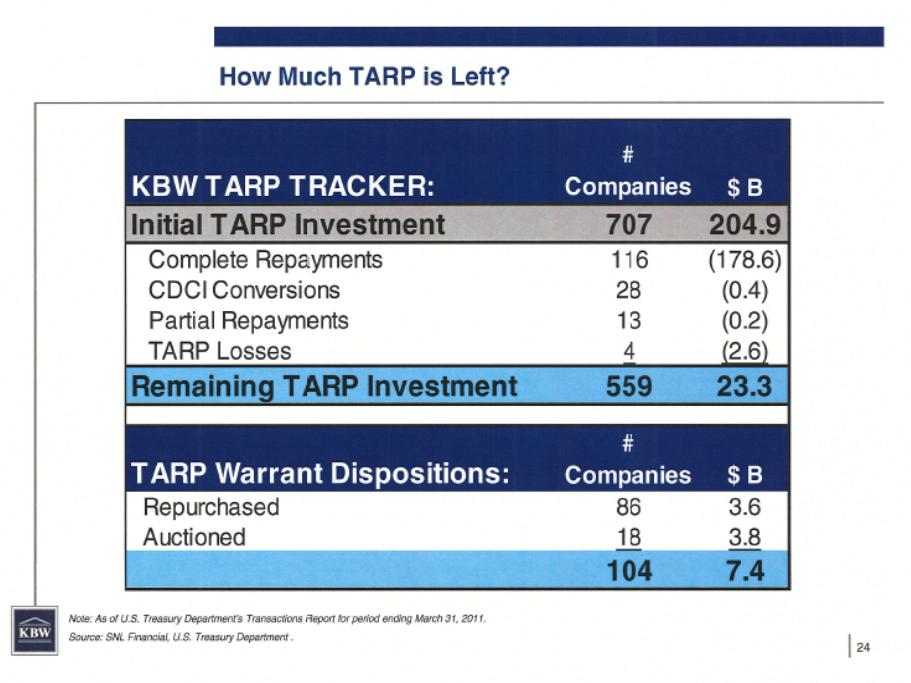
• Treasury Capital of $38.2 Million - How will it be
Redeemed?
Redeemed?
• Asset Quality Questions - Have NPA’s Peaked?
• “Normalized” Earnings - When and What?
• Low Trading Volume - Difficult for New Shareholders to
“Buy-In”.
“Buy-In”.

QCR Holdings’ Strategic Direction
• Tell the Story:
– Very Positive Asset Quality Results
– Grow TCE and Fund Treasury Capital without Common
Equity Raise.
Equity Raise.
– Focus on Growing EPS Faster than we Grow Assets
– Expanded Investor Relations Program to Attract New
Shareholders
Shareholders
• Execute on what is Possible in the Quad Cities, Cedar
Rapids, and Rockford Communities and with our Leasing
Subsidiary - m2 Lease Funds
Rapids, and Rockford Communities and with our Leasing
Subsidiary - m2 Lease Funds
• Repeat!
Thank You.
Thank you for your continued support.