Attached files
| file | filename |
|---|---|
| 8-K - FORM 8-K - AVIENT CORP | l42594e8vk.htm |
Exhibit 99.1

NEWS RELEASE
FOR IMMEDIATE RELEASE
FOR IMMEDIATE RELEASE
PolyOne Announces First Quarter 2011 Results
| • | Revenues increase 14% versus first quarter 2010 | ||
| • | Earnings per share of $1.14 versus $0.22 in first quarter 2010 | ||
| • | Excluding special items and tax adjustments in both periods, earnings per share improve 67% to $0.30 from $0.18 in prior year first quarter | ||
| • | All platforms delivered double-digit revenue and operating income growth |
CLEVELAND — May 4, 2011 — PolyOne Corporation (NYSE: POL) today reported revenues of $718.5
million for the first quarter of 2011, a 14% increase compared to revenues of $630.4 million in the
first quarter of 2010. Consolidated revenue growth was driven by an increase in volume, improved
mix and higher selling prices principally associated with raw material cost increases.
Diluted earnings per share totaled $1.14 in the first quarter of 2011, compared to $0.22 per
diluted share in the first quarter of 2010. Excluding special items and one-time tax adjustments
in both periods, earnings per share increased 67% to $0.30 per diluted share for the first quarter
of 2011, compared with $0.18 per diluted share recorded in the first quarter of 2010.
“I am pleased with our first quarter results as each of our three strategic platforms delivered
double-digit revenue and operating income expansion,” said Stephen D. Newlin, chairman, president
and chief executive officer. “This marks the sixth consecutive quarter of increased year-over-year
earnings per share, excluding special items and tax adjustments.”
Newlin added, “During the quarter, we continued to reposition our portfolio of assets by selling
our equity investment in SunBelt and completing the acquisition of Uniplen, a specialty engineered
materials company in Brazil. Our mix of earnings has never been stronger, and we are energized by
the continued success of our strategy. After a record-breaking year in 2010, we are off to an even
better start in 2011.”
Excluding the results of the now divested SunBelt and OxyVinyls joint ventures, earnings per share
before special items and tax adjustments reached a new record during the first quarter of 2011.
Operating margin also reached an all-time high as shown below:
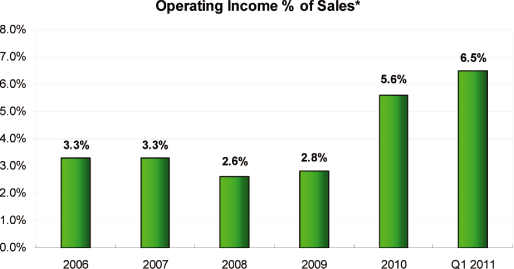
*Amounts exclude special items and equity income from SunBelt and OxyVinyls
“We ended the quarter with $412 million of cash and net debt of $21 million,” added Robert M.
Patterson, executive vice president and chief financial officer. “While our primary expected
future uses of cash remain funding acquisitions and supporting our operating needs, during the
quarter we also initiated a quarterly dividend for the first time since 2002 and repurchased one
million shares under our existing share buyback program.”
Included in the results for the first quarter of 2011 are pre-tax special items of $127.7 million
($79.8 million after tax), primarily related to the Company’s $128.2 million gain on the sale of
its SunBelt joint venture investment.
The chart below provides a comparison of first quarter 2011 results with the first quarter of 2010,
showing the impact of special items and one-time tax adjustments:
In millions (except per share amounts)
| Q1 2011 | EPS | Q1 2010 | EPS | ||||||||||||||
Net Income |
$ | 110.2 | $ | 1.14 | $ | 21.0 | $ | 0.22 | |||||||||
Special items and non-recurring items, after tax |
(79.8 | ) | (0.83 | ) | (0.3 | ) | (0.00 | ) | |||||||||
Tax adjustments |
(1.5 | ) | (0.01 | ) | (3.5 | ) | (0.04 | ) | |||||||||
| $ | 28.9 | $ | 0.30 | $ | 17.2 | $ | 0.18 | ||||||||||
# # #
2
First Quarter 2011 Conference Call
PolyOne will host a conference call at 9 a.m. Eastern Time on Wednesday, May 4, 2011. The
conference dial-in number is 866-543-6403 (domestic) or 617-213-8896 (international), pass code
71581217, conference topic: First Quarter 2011 PolyOne Earnings Conference Call. The replay will be
available for two weeks, beginning at 12:00 p.m. ET, May 4, 2011 on the Company’s Web site at
www.polyone.com/investor or by phone at 888-286-8010 (domestic) or 617-801-6888 (international).
The pass code for the replay is 96431669.
About PolyOne
PolyOne Corporation, with 2010 revenues of $2.6 billion, is a premier provider of specialized
polymer materials, services and solutions. Headquartered outside Cleveland, Ohio USA, PolyOne has
operations around the world. For additional information on PolyOne, visit our Web site at
www.polyone.com.
To access PolyOne’s news library online, please visit www.polyone.com/news
Investor Relations Contact:
Joseph P. Kelley
Vice President Planning & Investor Relations
PolyOne Corporation
+1 440-930-3502
joseph.kelley@polyone.com
Vice President Planning & Investor Relations
PolyOne Corporation
+1 440-930-3502
joseph.kelley@polyone.com
Media Contact:
Amanda Marko
Director, Corporate Communications
PolyOne Corporation
+1 440-930-3162
amanda.marko@polyone.com
Director, Corporate Communications
PolyOne Corporation
+1 440-930-3162
amanda.marko@polyone.com
3
Forward-looking Statements
In this press release, statements that are not reported financial results or other historical
information are “forward-looking statements” within the meaning of the Private Securities
Litigation Reform Act of 1995. Forward-looking statements give current expectations or forecasts
of future events and are not guarantees of future performance. They are based on management’s
expectations that involve a number of business risks and uncertainties, any of which could cause
actual results to differ materially from those expressed in or implied by the forward-looking
statements. They use words such as “will,” “anticipate,” “estimate,” “expect,” “project,”
“intend,” “plan,” “believe,” and other words and terms of similar meaning in connection with any
discussion of future operating or financial condition, performance and/or sales. Factors that
could cause actual results to differ materially from those implied by these forward-looking
statements include, but are not limited to: disruptions, uncertainty or volatility in the credit
markets that could adversely impact the availability of credit already arranged and the
availability and cost of credit in the future; the financial condition of our customers, including
the ability of customers (especially those that may be highly leveraged and those with inadequate
liquidity) to maintain their credit availability; the speed and extent of an economic recovery,
including the recovery of the housing and chlor-alkali markets; our ability to achieve new business
gains; the effect on foreign operations of currency fluctuations, tariffs, and other political,
economic and regulatory risks; changes in polymer consumption growth rates where we conduct
business; changes in global industry capacity or in the rate at which anticipated changes in
industry capacity come online; fluctuations in raw material prices, quality and supply and in
energy prices and supply; production outages or material costs associated with scheduled or
unscheduled maintenance programs; unanticipated developments that could occur with respect to
contingencies such as litigation and environmental matters; an inability to achieve or delays in
achieving or achievement of less than the anticipated financial benefit from initiatives related to
working capital reductions, cost reductions, employee productivity goals and our new global
organization structure; an inability to raise or sustain prices for products or services; an
inability to maintain appropriate relations with unions and employees; the inability to achieve
expected results from our acquisition activities; and other factors affecting our business beyond
our control, including, without limitation, changes in the general economy, changes in interest
rates and changes in the rate of inflation. The above list of factors is not exhaustive.
We undertake no obligation to publicly update forward-looking statements, whether as a result of
new information, future events or otherwise. You are advised to consult any further disclosures we
make on related subjects in our reports on Form 10-Q, 8-K and 10-K that we provide to the
Securities and Exchange Commission.
4
Attachment 1
Supplemental Information
Summary of Consolidated Operating Results (Unaudited)
First Quarter 2011
(In millions, except per share data)
First Quarter 2011
(In millions, except per share data)
| Three Months Ended | ||||||||
| March 31, | ||||||||
| Operating results: | 2011 | Adjusted 2010 | ||||||
Sales |
$ | 718.5 | $ | 630.4 | ||||
Operating income |
179.8 | 33.7 | ||||||
Net income |
110.2 | 21.0 | ||||||
Basic earnings per share |
$ | 1.17 | $ | 0.23 | ||||
Diluted earnings per share |
$ | 1.14 | $ | 0.22 | ||||
Total basic per share impact of special items (1) |
$ | 0.85 | $ | (0.02 | ) | |||
Total diluted per share impact of special items (1) |
$ | 0.83 | $ | (0.02 | ) | |||
| Three Months Ended | ||||||||
| March 31, | ||||||||
| Special items (1): | 2011 | 2010 | ||||||
Cost of sales |
||||||||
Employee separation and plant phaseout costs |
$ | (0.2 | ) | $ | — | |||
Reimbursement of previously incurred environmental costs |
1.9 | — | ||||||
Environmental remediation costs |
(1.5 | ) | (3.0 | ) | ||||
Acquisition related adjustments |
(0.1 | ) | — | |||||
Impact on cost of sales |
0.1 | (3.0 | ) | |||||
Selling and administrative |
||||||||
Employee separation and plant phaseout costs |
(0.1 | ) | — | |||||
Acquisition related costs |
(1.0 | ) | (0.2 | ) | ||||
Impact on selling and administrative |
(1.1 | ) | (0.2 | ) | ||||
Gain on sale of investment in SunBelt |
128.2 | — | ||||||
Impact on operating income |
127.2 | (3.2 | ) | |||||
Gain on sale of investment in O’Sullivan |
0.5 | 0.4 | ||||||
Impact on income before income taxes |
127.7 | (2.8 | ) | |||||
Income tax benefit (expense) on special items |
(47.9 | ) | 1.1 | |||||
Impact of special items on net income |
$ | 79.8 | $ | (1.7 | ) | |||
Basic impact per common share |
$ | 0.85 | $ | (0.02 | ) | |||
Diluted impact per common share |
$ | 0.83 | $ | (0.02 | ) | |||
Weighted average shares used to compute earnings per share: |
||||||||
Basic |
93.9 | 92.5 | ||||||
Diluted |
96.4 | 95.3 | ||||||
| (1) | Special items is a non-GAAP financial measure. Special items include charges related to specific strategic initiatives or financial restructurings such as: consolidation of operations; debt extinguishment costs; employee separation costs resulting from personnel reduction programs, plant phaseout costs, executive separation agreements; asset impairments; environmental remediation costs, fines or penalties for facilities no longer owned or closed in prior years; gains and losses on the divestiture of operating businesses, joint ventures and equity investments; gains and losses on facility or property sales or disposals; results of litigation, fines or penalties, where such litigation (or action relating to the fines or penalties) arose prior to the commencement of the performance period; and the effect of changes in tax law, accounting principles or other such laws or provisions affecting reported results or the effect of adverse determinations by regulatory agencies relating to accounting principles or treatment. |
Attachment 2
PolyOne Corporation and Subsidiaries
Consolidated Statements of Operations (Unaudited)
(In millions, except per share data)
Consolidated Statements of Operations (Unaudited)
(In millions, except per share data)
| Three Months Ended | ||||||||
| March 31, | ||||||||
| Adjusted | ||||||||
| 2011 | 2010 | |||||||
Sales |
$ | 718.5 | $ | 630.4 | ||||
Cost of sales |
595.8 | 526.7 | ||||||
Gross margin |
122.7 | 103.7 | ||||||
Selling and administrative |
76.8 | 71.5 | ||||||
Income related to equity affiliates |
133.9 | 1.5 | ||||||
Operating income |
179.8 | 33.7 | ||||||
Interest expense, net |
(8.5 | ) | (8.0 | ) | ||||
Other expense, net |
(0.2 | ) | (0.7 | ) | ||||
Income before income taxes |
171.1 | 25.0 | ||||||
Income tax expense |
(60.9 | ) | (4.0 | ) | ||||
Net income |
$ | 110.2 | $ | 21.0 | ||||
Earnings per common share: |
||||||||
Basic earnings |
$ | 1.17 | $ | 0.23 | ||||
Diluted earnings |
$ | 1.14 | $ | 0.22 | ||||
Cash dividends per common share |
$ | 0.04 | $ | — | ||||
Weighted-average shares used to compute earnings per share: |
||||||||
Basic |
93.9 | 92.5 | ||||||
Diluted |
96.4 | 95.3 | ||||||
Equity affiliates earnings recorded by PolyOne: |
||||||||
SunBelt |
$ | 133.9 | $ | 0.8 | ||||
Other equity affiliates |
— | 0.7 | ||||||
Income related to equity affiliates |
$ | 133.9 | $ | 1.5 | ||||
6
Attachment 3
PolyOne Corporation and Subsidiaries
Condensed Consolidated Balance Sheets
(In millions)
Condensed Consolidated Balance Sheets
(In millions)
| (Unaudited) | ||||||||
| March 31, | December 31, | |||||||
| 2011 | 2010 | |||||||
Assets |
||||||||
Current assets: |
||||||||
Cash and cash equivalents |
$ | 412.4 | $ | 378.1 | ||||
Accounts receivable, net |
382.5 | 294.5 | ||||||
Inventories |
237.9 | 211.3 | ||||||
Other current assets |
58.3 | 55.1 | ||||||
Total current assets |
1,091.1 | 939.0 | ||||||
Property, net |
379.6 | 374.4 | ||||||
Investment in equity affiliates and nonconsolidated subsidiary |
— | 2.7 | ||||||
Goodwill |
170.6 | 164.1 | ||||||
Other intangible assets, net |
69.8 | 67.8 | ||||||
Deferred income tax assets |
42.2 | 59.7 | ||||||
Other non-current assets |
75.2 | 64.2 | ||||||
Total assets |
$ | 1,828.5 | $ | 1,671.9 | ||||
Liabilities and Shareholders’ Equity
Current liabilities: |
||||||||
Current portion of long-term debt |
$ | — | $ | 20.0 | ||||
Accounts payable |
342.2 | 269.0 | ||||||
Accrued expenses and other liabilities |
153.1 | 145.8 | ||||||
Total current liabilities |
495.3 | 434.8 | ||||||
Long-term debt |
432.9 | 432.9 | ||||||
Postretirement benefits other than pensions |
19.3 | 19.4 | ||||||
Pension benefits |
154.0 | 154.5 | ||||||
Other non-current liabilities |
111.8 | 114.3 | ||||||
Shareholders’ equity |
615.2 | 516.0 | ||||||
Total liabilities and shareholders’ equity |
$ | 1,828.5 | $ | 1,671.9 | ||||
7
Attachment 4
PolyOne Corporation and Subsidiaries
Consolidated Statements of Cash Flows (Unaudited)
(In millions)
Consolidated Statements of Cash Flows (Unaudited)
(In millions)
| Three Months Ended | ||||||||
| March 31, | ||||||||
| 2011 | Adjusted 2010 | |||||||
Operating Activities |
||||||||
Net income |
$ | 110.2 | $ | 21.0 | ||||
Adjustments to reconcile net income to net cash (used) provided by
operating activities: |
||||||||
Depreciation and amortization |
14.1 | 14.0 | ||||||
Deferred income tax provision |
26.7 | — | ||||||
Provision for doubtful accounts |
0.9 | 1.2 | ||||||
Stock compensation expense |
1.2 | 0.9 | ||||||
Companies carried at equity: |
||||||||
Income related to equity affiliates |
(133.9 | ) | (1.5 | ) | ||||
Dividends and distributions received |
— | 0.6 | ||||||
Change in assets and liabilities, net of acquisition: |
||||||||
Increase in accounts receivable |
(78.1 | ) | (71.3 | ) | ||||
Increase in inventories |
(17.4 | ) | (24.3 | ) | ||||
Increase in accounts payable |
66.8 | 75.2 | ||||||
Decrease in accrued expenses and other |
(29.9 | ) | (13.0 | ) | ||||
Net cash (used) provided by operating activities |
(39.4 | ) | 2.8 | |||||
Investing Activities |
||||||||
Capital expenditures |
(7.7 | ) | (4.3 | ) | ||||
Business acquisitions and related deposits, net of cash acquired |
(20.0 | ) | — | |||||
Proceeds from sale of equity affiliate and other assets |
132.8 | 7.8 | ||||||
Net cash provided by investing activities |
105.1 | 3.5 | ||||||
Financing Activities |
||||||||
Change in short-term debt |
— | 0.2 | ||||||
Repayment of long-term debt |
(20.0 | ) | (20.0 | ) | ||||
Purchase of common shares for treasury |
(13.6 | ) | — | |||||
Proceeds from exercise of stock options |
1.1 | 0.7 | ||||||
Net cash used by financing activities |
(32.5 | ) | (19.1 | ) | ||||
Effect of exchange rate changes on cash |
1.1 | (0.4 | ) | |||||
Increase (decrease) in cash and cash equivalents |
34.3 | (13.2 | ) | |||||
Cash and cash equivalents at beginning of period |
378.1 | 222.7 | ||||||
Cash and cash equivalents at end of period |
$ | 412.4 | $ | 209.5 | ||||
8
Attachment 5
Business Segment and Platform Operations (Unaudited)
(In millions)
(In millions)
Operating income at the segment level does not include: special items as defined on attachment
1; corporate general and administration costs that are not allocated to segments; intersegment
sales and profit eliminations; share-based compensation costs; and certain other items that are not
included in the measure of segment profit and loss that is reported to and reviewed by the chief
operating decision maker. These costs are included in Corporate and eliminations.
| Three Months Ended | ||||||||
| March 31, | ||||||||
| Adjusted | ||||||||
| 2011 | 2010 | |||||||
Sales: |
||||||||
Global Specialty Engineered Materials |
$ | 151.9 | $ | 126.3 | ||||
Global Color, Additives and Inks |
140.4 | 130.9 | ||||||
Specialty Platform |
292.3 | 257.2 | ||||||
Performance Products and Solutions |
208.7 | 183.7 | ||||||
PolyOne Distribution |
247.0 | 215.9 | ||||||
Corporate and eliminations |
(29.5 | ) | (26.4 | ) | ||||
Sales |
$ | 718.5 | $ | 630.4 | ||||
Gross margin: |
||||||||
Global Specialty Engineered Materials |
$ | 34.7 | $ | 30.2 | ||||
Global Color, Additives and Inks |
35.4 | 30.9 | ||||||
Specialty Platform |
70.1 | 61.1 | ||||||
Performance Products and Solutions |
27.2 | 24.8 | ||||||
PolyOne Distribution |
26.2 | 20.5 | ||||||
Corporate and eliminations |
(0.8 | ) | (2.7 | ) | ||||
Gross margin |
$ | 122.7 | $ | 103.7 | ||||
Selling and administrative: |
||||||||
Global Specialty Engineered Materials |
$ | (20.3 | ) | $ | (18.1 | ) | ||
Global Color, Additives and Inks |
(24.1 | ) | (22.7 | ) | ||||
Specialty Platform |
(44.4 | ) | (40.8 | ) | ||||
Performance Products and Solutions |
(12.9 | ) | (12.7 | ) | ||||
PolyOne Distribution |
(11.5 | ) | (11.9 | ) | ||||
SunBelt Joint Venture |
(0.7 | ) | (1.1 | ) | ||||
Corporate and eliminations |
(7.3 | ) | (5.0 | ) | ||||
Selling and administrative |
$ | (76.8 | ) | $ | (71.5 | ) | ||
Operating income: |
||||||||
Global Specialty Engineered Materials |
$ | 14.4 | $ | 12.1 | ||||
Global Color, Additives and Inks |
11.3 | 8.9 | ||||||
Specialty Platform |
25.7 | 21.0 | ||||||
Performance Products and Solutions |
14.3 | 12.1 | ||||||
PolyOne Distribution |
14.7 | 8.6 | ||||||
SunBelt Joint Venture |
5.0 | (0.3 | ) | |||||
Corporate and eliminations |
120.1 | (7.7 | ) | |||||
Operating income |
$ | 179.8 | $ | 33.7 | ||||
Specialty Platform consists of our two specialty businesses: Global Specialty Engineered
Materials; and Global Color, Additives and Inks. We present Specialty Platform sales, gross
margin, selling and administration, and operating income because management believes that this is
useful information to investors in highlighting our collective progress in advancing our
specialization strategy.
9
Attachment 6
Reconciliation of Non-GAAP Financial Measures (Unaudited)
(In millions, except per share data)
(In millions, except per share data)
Senior management uses gross margin before special items and operating income before special
items to assess performance and allocate resources because senior management believes that these
measures are useful in understanding current profitability levels and that current levels may serve
as a base for future performance. In addition, operating income before the effect of special items
is a component of various PolyOne annual and long-term employee incentive plans and is used in debt
covenant computations. Senior management uses free cash flow to assess our ability to service our
debt. Below is a reconciliation of non-GAAP financial measures to the most directly comparable
measures calculated and presented in accordance with GAAP. See attachment 1 for a definition of
special items.
| Three Months Ended | ||||||||
| March 31, | ||||||||
| Adjusted | ||||||||
| Reconciliation to Consolidated Statements of Operations | 2011 | 2010 | ||||||
Sales |
$ | 718.5 | $ | 630.4 | ||||
Gross margin before special items |
$ | 122.6 | $ | 106.7 | ||||
Special items in gross margin |
0.1 | (3.0 | ) | |||||
Gross margin |
$ | 122.7 | $ | 103.7 | ||||
Gross margin before special items as a percent of sales |
17.1 | % | 16.9 | % | ||||
Operating income before special items and non-recurring items |
$ | 52.6 | $ | 33.7 | ||||
Special items and non-recurring items in operating income |
127.2 | — | ||||||
Operating income |
$ | 179.8 | $ | 33.7 | ||||
Senior management uses comparisons of net income (loss) and diluted earnings (loss) per share
(EPS) before special items, non-recurring items, tax gain and tax valuation allowance to assess
performance and facilitate comparability of results with prior periods. Below is a reconciliation
of these non-GAAP financial measures to their most directly comparable measure calculated and
presented in accordance with GAAP.
| Three Months Ended | Adjusted Three Months Ended | |||||||||||||||
| March 31, 2011 | March 31, 2010 | |||||||||||||||
| Reconciliation to Consolidated Statements of Operations | $ | EPS | $ | EPS | ||||||||||||
Net income |
$ | 110.2 | $ | 1.14 | $ | 21.0 | $ | 0.22 | ||||||||
Special items and non-recurring items, after-tax (attachment 1) |
(79.8 | ) | (0.83 | ) | (0.3 | ) | — | |||||||||
Tax (a) |
(1.5 | ) | (0.01 | ) | (3.5 | ) | (0.04 | ) | ||||||||
| $ | 28.9 | $ | 0.30 | $ | 17.2 | $ | 0.18 | |||||||||
| (a) | Net tax (benefit) loss from one-time foreign and domestic income tax items and deferred income tax valuation allowance adjustments on deferred tax assets |
Senior management uses free cash flow to assess our ability to service our debt. Below is a
reconciliation of this non-GAAP financial measure to the most directly comparable measure
calculated and presented in accordance with GAAP.
| Three Months Ended | ||||||||
| March 31, | ||||||||
| Reconciliation to Consolidated Statements of Cash Flows | 2011 | 2010 | ||||||
Net cash (used) provided by operating activities |
$ | (39.4 | ) | $ | 2.8 | |||
Net cash provided by investing activities |
105.1 | 3.5 | ||||||
Free cash flow |
$ | 65.7 | $ | 6.3 | ||||
10
Senior management uses net debt as a measure of our financial position. Below is a
reconciliation of this non-GAAP financial measure to the most directly comparable measure
calculated and presented in accordance with GAAP.
| (Unaudited) | ||||||||
| March 31, | December 31, | |||||||
| Reconciliation to Condensed Consolidated Balance Sheets | 2011 | 2010 | ||||||
Current portion of long-term debt |
$ | — | $ | 20.0 | ||||
Long-term debt |
432.9 | 432.9 | ||||||
SunBelt guarantee |
— | 42.7 | ||||||
Less cash and cash equivalents |
(412.4 | ) | (378.1 | ) | ||||
Net debt |
$ | 20.5 | $ | 117.5 | ||||
| Reconciliation to operating income % | ||||||||||||||||||||||||
| of sales excluding equity income and | ||||||||||||||||||||||||
| special items | 2006 | 2007 | 2008 | 2009 | 2010 | 1Q11 | ||||||||||||||||||
Sales |
$ | 2,622.4 | $ | 2,642.7 | $ | 2,738.7 | $ | 2,060.7 | $ | 2,621.9 | $ | 718.5 | ||||||||||||
Operating income (loss) |
$ | 233.6 | $ | 80.0 | $ | (291.4 | ) | $ | 137.1 | $ | 174.6 | $ | 179.8 | |||||||||||
Equity income from SunBelt and OxyVinyls |
(107.0 | ) | (40.8 | ) | (32.5 | ) | (29.7 | ) | (23.1 | ) | (5.7 | ) | ||||||||||||
Special items and non-recurring items
in operating income |
(39.1 | ) | 47.8 | 396.2 | (48.7 | ) | (4.8 | ) | (127.2 | ) | ||||||||||||||
Operating income before special items and
equity income |
$ | 87.5 | $ | 87.0 | $ | 72.3 | $ | 58.7 | $ | 146.7 | $ | 46.9 | ||||||||||||
Operating income before special items and
equity income as a percent of sales |
3.3 | % | 3.3 | % | 2.6 | % | 2.8 | % | 5.6 | % | 6.5 | % | ||||||||||||
11