Attached files
| file | filename |
|---|---|
| 8-K - FORM 8-K - GARDNER DENVER INC | c64453e8vk.htm |
| EX-99.1 - EX-99.1 - GARDNER DENVER INC | c64453exv99w1.htm |
Exhibit
99.2

| Investor Presentation May 2011 |

| 2 All of the statements made by Gardner Denver in this presentation or made orally in connection with it, other than historical facts, are forward-looking statements. As a general matter, forward-looking statements are those focused upon anticipated events or trends, expectations, and beliefs relating to matters that are not historical in nature. The Private Securities Litigation Reform Act of 1995 provides a "safe harbor" for these forward-looking statements. In order to comply with the terms of the safe harbor, the Company notes that forward-looking statements are subject to known and unknown risks, uncertainties, and other factors relating to the Company's operations and business environment, all of which are difficult to predict and many of which are beyond the control of the Company. These known and unknown risks, uncertainties, and other factors could cause actual results to differ materially from those matters expressed in, anticipated by or implied by such forward-looking statements. Factors that could cause or contribute to such differences include, but are not limited to: changing economic conditions; pricing of the Company's products and other competitive market pressures; the costs and availability of raw materials; fluctuations in foreign currency rates and energy prices; risks associated with the Company's current and future litigation; and the other risks detailed from time to time in the Company's SEC filings, including but not limited to, its annual report on Form 10-K for the fiscal year ending December 31, 2010, and its quarterly reports on Form 10-Q. These statements reflect the current views and assumptions of management with respect to future events. The Company does not undertake, and hereby disclaims, any duty to update these forward- looking statements, although its situation and circumstances may change in the future. The inclusion of any statement in this presentation does not constitute admission by the Company or any other person that the events or circumstances described in such statement are material. Safe Harbor Disclosure |

| 3 Agenda Preface Position Progress Potential |

| 4 Today: Profit Expansion Despite Economic Headwinds Upside from broad industry, product, geographic exposure Execution of multi-year margin expansion Benefit of improving aftermarket mix Culture of innovation driving share gains Key drivers Momentum is Building |

| 5 Today: Profit Expansion Despite Economic Headwinds: The Evidence 2009 1Q11 TTM East 1.778145 2.004793 Despite Stable Revenues... Adjusted Operating Margins(1) are Expanding... Driving Growth in Adjusted DEPS(1) (1) See note on slide 30 $4.60-$4.70 |

| 6 Tomorrow: Exceptional Potential as Strategy Execution Builds Organic growth Faster growth in attractive end markets and regions like Asia Selective acquisitions Access faster growing end markets and generate synergies Strategy Potential Aftermarket growth Higher margins, less cyclical Margin improvement Reduce costs and drive operational excellence $ Innovative products Expand share with proprietary products |

| 7 Agenda Preface Position Progress Potential |

| 8 Leading Market Presence Global leader in major products Industrial Products Group 54% of revenues* Compressors (>50psi) Blowers (<50psi) Engineered Products Group 46% of revenues* Petroleum pumps Liquid ring pump packages Loading arms OEM compressors and pumps * Revenues for first quarter ending March 31, 2011 |

| 9 Gardner Denver: A Truly Global Presence Revenues by Geography Canada 4% United States 35% Latin America 3% Europe 35% Other 7% Asia 16% 1st Qtr East 3 97 1st Qtr East 7 93 9 (2010 Revenues) |

| 10 Exposure to a Wide Range of Global Industries and Applications Industrial Products Group (2) Engineered Products Group (2) (2010 Revenues) (2) See note on slide 30 |

| 11 Well Established Sales Channels Industrial Products Group (2) Engineered Products Group (2) Primarily standard configuration products Primarily products designed for specific customer applications (2010 Revenues) (2) See note on slide 30 |

| 12 Businesses to Capitalize on all Stages of the Economic Cycle Early Cycle (1-18 months) Late Cycle (36+ months) Mid Cycle (18-36 months) Engineered packages Industrial air compressors OEM Aftermarket |

| Economic Indicator Outlook Today Market Outlook Snapshot U.S. Industrial Production E.U. Industrial Production Oil and Gas China growth OEM applications Stable to positive; aftermarket products and services driven Well servicing and drilling pump demand strong Positive Positive Six months ago 13 |

| 14 Agenda Preface Position Progress Potential |

| 15 Five Point Growth Strategy for the Future 2. Aftermarket growth 3. Innovative products 4. Selective acquisitions 5. Margin improvements 1. Organic growth CUSTOMERS SHAREHOLDERS EMPLOYEES Innovation High Velocity VALUE COMMITMENT RESOURCES Employee development - a key enabler |

| 16 Strategy #1: Organic Growth Progress Order rates ? gaining ground Channel leverage CompAir and Gardner Denver compressors Expanding in faster growing markets Asia Pacific, Brazil, India Future Focus New higher-growth markets Medical Life sciences Environment New innovative products Aftermarket |
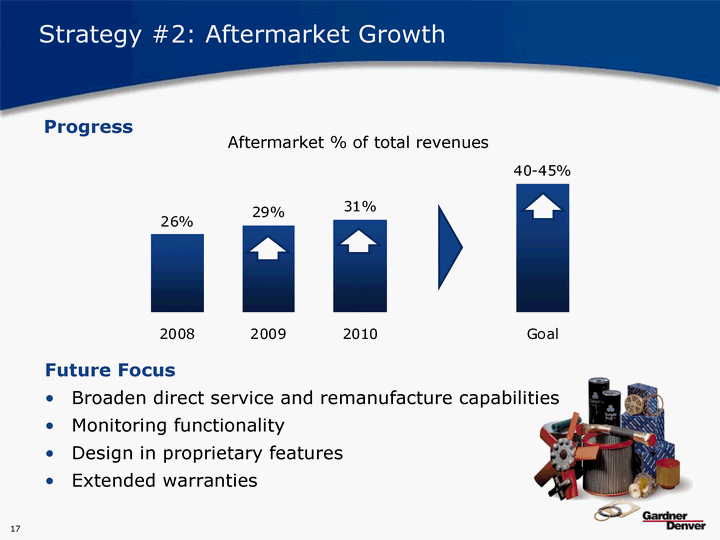
| 17 Strategy #2: Aftermarket Growth Progress Future Focus Broaden direct service and remanufacture capabilities Monitoring functionality Design in proprietary features Extended warranties Aftermarket % of total revenues |

| 18 Strategy #3: Innovative Products Progress Voice of customer ? differentiates products from competition Value proposition based on customer needs Product launches across multiple divisions demonstrate success Example: Revolutionary Offshore PZ-2400 Drilling Pump |

| 19 Strategy #3: Innovative Products Future Focus Continue to incorporate voice of the customer to drive innovation Global input from customer Establish appropriate company priorities Test concepts Assess feasibility and commercial viability Engage customer commitment Rigorous customer- driven process |

| 20 Strategy #4: Selective Acquisitions Progress Environment improving Acquired ILMVAC in 3Q10 Strengthened balance sheet to enable future financing Proven track record Future Building pipeline of opportunities in large global markets Adding portfolios of product technologies serving growth industries |

| 21 Strategy #5: Margin Improvement Progress Reduced manpower by 2,300 or 27% since October 2008 CompAir integrated 8 facility rationalizations 28 SAP R/3 or Business One implementations Cumulative Annual Savings from Facility Rationalizations (invested $70M to realize savings) |

| 22 Strategy #5: Margin Improvement - Industrial Products Group Adjusted Operating Margin(1) Goal "14 x 14" Adding 150 BPS annually going forward $0.21 DEPS per year (based on 2009 revenues) Three key elements Restructuring Productivity Sourcing (1) See note on slide 30 |

| 23 Strategy #5: Margin Improvement - Engineered Products Group Increasing Adjusted Operating Margins(1) (1) See note on slide 30 Adding 50 BPS per year 2011-2014 Three key elements Restructuring Productivity Sourcing |

| 24 Agenda Preface Position Progress Potential |
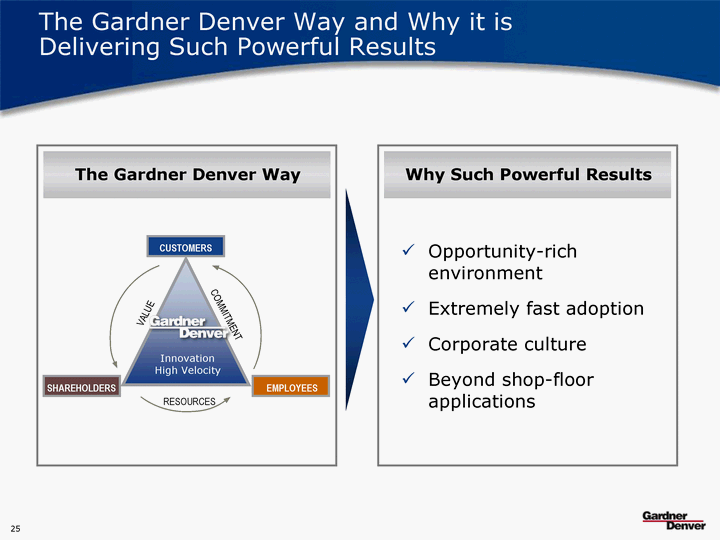
| 25 The Gardner Denver Way and Why it is Delivering Such Powerful Results Why Such Powerful Results CUSTOMERS SHAREHOLDERS EMPLOYEES Innovation High Velocity VALUE COMMITMENT RESOURCES The Gardner Denver Way Opportunity-rich environment Extremely fast adoption Corporate culture Beyond shop-floor applications |
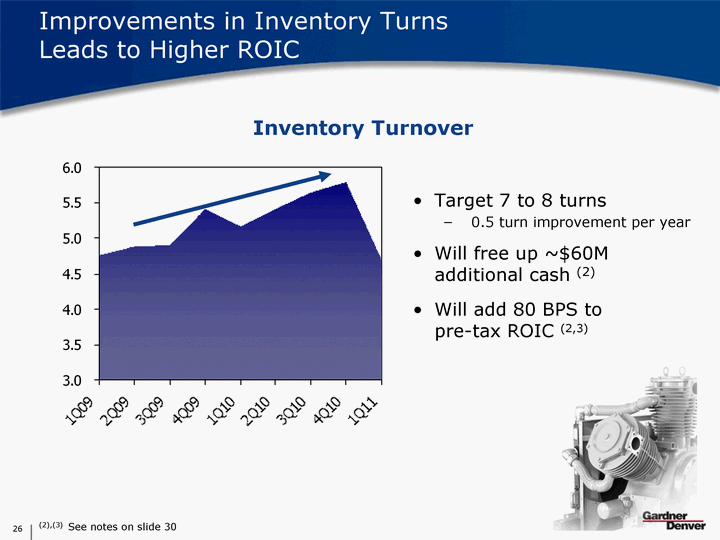
| Improvements in Inventory Turns Leads to Higher ROIC Inventory Turnover Target 7 to 8 turns 0.5 turn improvement per year Will free up ~$60M additional cash (2) Will add 80 BPS to pre-tax ROIC (2,3) (2),(3) See notes on slide 30 26 |
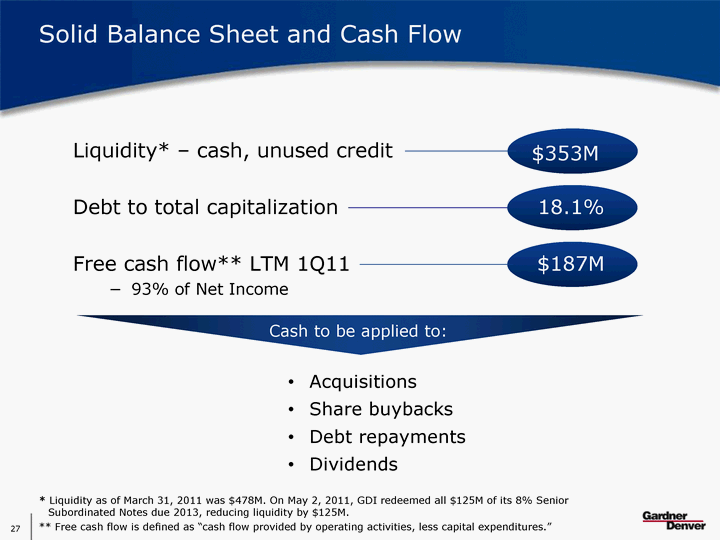
| 27 Solid Balance Sheet and Cash Flow Liquidity* - cash, unused credit $353M Debt to total capitalization Free cash flow** LTM 1Q11 93% of Net Income $187M Cash to be applied to: Acquisitions Share buybacks Debt repayments Dividends * Liquidity as of March 31, 2011 was $478M. On May 2, 2011, GDI redeemed all $125M of its 8% Senior Subordinated Notes due 2013, reducing liquidity by $125M. ** Free cash flow is defined as "cash flow provided by operating activities, less capital expenditures." 18.1% |

| 28 WHY INVEST IN GARDNER DENVER Delivering Growth Today for the Future Today: Profit Expansion Despite Economic Headwinds Upside from faster growing markets Early stages of margin expansion initiative Growing aftermarket Innovation contributions Strong cash flow Future: Exceptional Potential as Strategy is Executed Multi-year margin expansion Higher organic growth Less-cyclical revenue profile Selective acquisitions Improved ROIC |

| 29 Investor Presentation May 2011 |
| Presentation Notes Note 1: Adjusted Operating Income, Adjusted Operating Margins, Adjusted Net Income and Adjusted DEPS are financial measures that are not in accordance with US GAAP. Adjusted Operating Income, Adjusted Operating Margins and Adjusted DEPS excludes the net impact of expenses incurred for profit improvement initiatives, non- recurring items and impairment charges. Adjusted net income is net income excluding non-cash impairment charges, net of related changes in deferred tax assets and liabilities. Gardner Denver believes the non-GAAP financial measure of Adjusted Operating Income, Adjusted Operating Margins, Adjusted Net Income and Adjusted DEPS provide important supplemental information to both management and investors regarding financial and business trends used in assessing its results of operations. Gardner Denver believes excluding the specified items from the aforementioned financial measures provides a more meaningful comparison to the corresponding prior year periods and internal budgets and forecasts, assists investors in performing analysis that is consistent with financial models developed by investors and research analysts, provides management with a more relevant measurement of operating performance, and is more useful in assessing management performance. Note 2: Company estimates Note 3: Pre-tax ROIC is defined as earnings before interest and taxes divided by average capital. 30 |