Attached files
| file | filename |
|---|---|
| 8-K - FORM 8-K - NATIONAL FINANCIAL PARTNERS CORP | d8k.htm |
 FIRST
QUARTER 2011 EARNINGS CALL PRESENTATION MAY 3, 2011
Exhibit 99.1 |
 2
Related to Forward-Looking Statements |
 3
Related to Non-GAAP Financial Information |
 4
Reconciliation: Net Income to Cash Earnings
(1)
Cash earnings is a non-GAAP financial measure, which the Company defines as net
income excluding amortization of intangibles, depreciation, the after-tax impact of the impairment of
goodwill and intangible assets, the after-tax impact of non-cash interest
expense and the after-tax impact of certain non-recurring items. (2)
The
sum
of
the
per-share
components
of
cash
earnings
per
share
-
diluted
may
not
agree
to
cash
earnings
per
share
-
diluted
due
to
rounding.
Q1 2011
Q1 2010
GAAP net income
$ 6,876
$ 6,990
Amortization of intangibles
7,962
8,338
Depreciation
3,077
3,006
Impairment of goodwill and intangible assets
-
2,901
Tax benefit of impairment of goodwill and intangible assets
-
(1,118)
Non-cash interest, net of tax
631
1,866
Cash earnings
(1)
$ 18,546
$ 21,983
GAAP
net
income
per
share
-
diluted
$ 0.15
$ 0.16
Amortization of intangibles
0.18
0.19
Depreciation
0.07
0.07
Impairment of goodwill and intangible assets
-
0.07
Tax benefit of impairment of goodwill and intangible assets
-
(0.03)
Non-cash
interest,
net
of
tax
(1)
0.01
0.04
Cash
earnings
per
share
-
diluted
(2)
$ 0.41
$ 0.50
($ in thousands, except per share data) |
 5
Reconciliation: Net Income to
Adjusted EBITDA
The reconciliation of Adjusted EBITDA per reportable segment does not include the
following items, which are not allocated to any of the Company’s reportable
segments:
income
tax
expense,
interest
income,
interest
expense,
gain
on
early
extinguishment
of
debt
and
other,
net.
These
items
are
included
in
the
reconciliation
of Adjusted EBITDA to net income on a consolidated basis.
For a reconciliation of Adjusted EBITDA per reportable segment for the three
months ended March 31, 2010, June 30, 2010, September 30, 2010, December 31, 2010
and March 31, 2011, please see the Company’s quarterly financial supplement
for the period ended March 31, 2011 which is available on the Investor Relations
section of
the
Company’s
Web
site
at
www.nfp.com.
Corporate
Individual
Advisor
(in thousands)
Client Group
Client Group
Services Group
Consolidated
For the three months ended March 31, 2011
GAAP net income (loss)
6,876
$
Income tax expense (benefit)
6,508
Interest income
(974)
Interest expense
3,771
Gain on early extinguishment of debt
-
Other, net
(3,187)
Income (loss) from operations
11,216
$
(685)
$
2,463
$
12,994
$
Amortization of intangibles
5,151
2,811
-
7,962
Depreciation
1,624
1,155
298
3,077
Impairment of goodwill and intangible assets
-
-
-
-
(Gain) loss on sale of businesses
-
-
-
-
Accelerated vesting of RSUs
-
-
-
-
Adjusted EBITDA
(1)
17,991
$
3,281
$
2,761
$
24,033
$
For the three months ended March 31, 2010
GAAP net income (loss)
6,990
$
Income tax expense (benefit)
5,563
Interest income
(888)
Interest expense
4,579
Other, net
(658)
Income (loss) from operations
11,949
$
1,926
$
1,711
$
15,586
$
Amortization of intangibles
5,348
2,990
-
8,338
Depreciation
1,559
1,125
322
3,006
Impairment of goodwill and intangible assets
1,931
970
-
2,901
(Gain) loss on sale of businesses
(1,321)
(910)
-
(2,231)
Adjusted EBITDA
(1)
19,466
$
6,101
$
2,033
$
27,600
$
Adjusted EBITDA is a non-GAAP financial measure, which the Company defines as net income
excluding income tax expense, interest income, interest expense, gain on early extinguishment
of debt, other, net, amortization of intangibles, depreciation, impairment of goodwill and intangible assets, (gain) loss on sale of businesses,
the pre-tax impact of the accelerated vesting of certain RSUs and any change in estimated
contingent consideration amounts recorded in accordance with purchase accounting that have
been subsequently adjusted and recorded in the consolidated statement of operations.
(1) |
 JESSICA BIBLIOWICZ
Chairman, President & Chief Executive Officer |
 7
1Q11 Highlights
Balanced capital allocation strategy
Strategic acquisitions
Reinvestment in existing businesses
$50 million stock repurchase plan
Revenue $233.3 million, grew 3.5%
Organic revenue grew 5.1%
Positive contributions from all three business
segments, especially Corporate
Client Group and Advisor Services Group Adjusted EBITDA $24.0 million
|
 8
Business Segments
Advisor Services Group
Organic revenue growth +16.8%
Individual Client Group
Organic revenue growth +0.6%
Corporate Client Group
Organic revenue growth +2.4%
1Q11 Revenue $233.3 million
$95.5
41%
$77.8
33%
$60.0
26% |
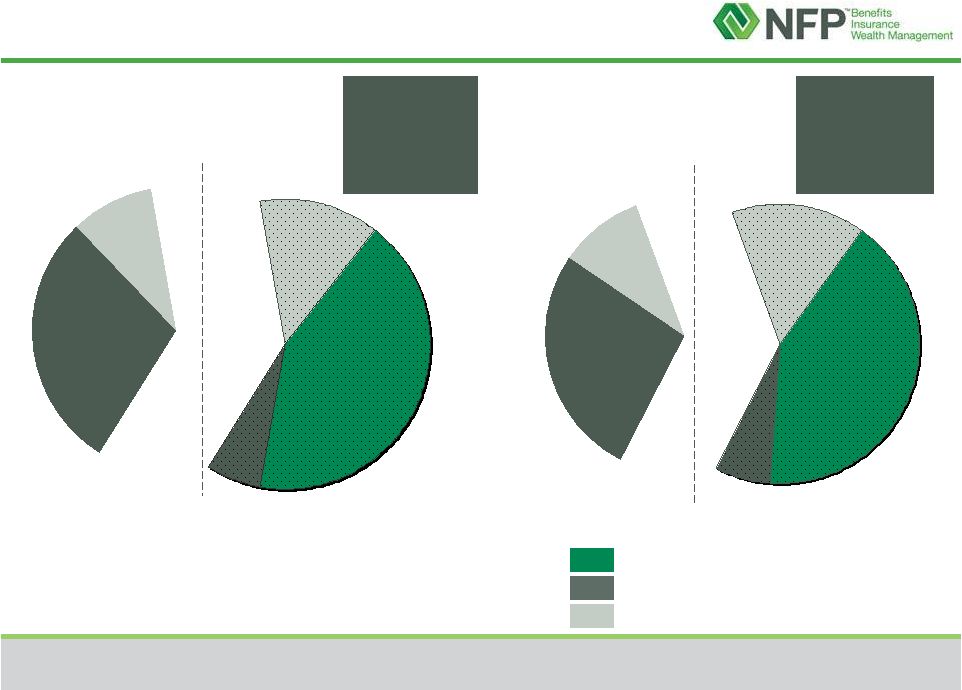
 9
Business Segment
1Q11 Overview & Components of Revenue
Steady performance
Expectations for CCG in 2011 (not
including acquisitions)
3% -
4% organic growth
Adjusted EBITDA margins
generally steady
Quarterly variability; 2Q
seasonally lowest margins
% of CCG
Revenue
Solid performance in wealth
management
Expectations for HNW life insurance in
2011
Increased activity; longer sales
cycle
Volatility and uncertainty remains
Continued strong growth
AUM $9.9 billion, up 16.3% YOY
Expectations for ASG in 2011
13% –
15% organic growth
Ongoing investments in
recruiting and marketing
Adjusted EBITDA margins
generally steady
% of ICG
Revenue
% of ASG
Revenue
11%
89%
41%
Corporate Benefits
Executive Benefits
19%
25%
56%
33%
Marketing Organization & Wholesale Life
Brokerage
Retail Life
Wealth Management
39%
61%
26%
Asset Based Fees & Trails
Commissions & Non-Recurring
Fees
Corporate Client Group
Individual Client Group
Advisor Services Group
|
 10
$95.5
41%
$36.5
16%
$14.8
6%
$63.0
27%
$23.4
10%
Recurring Revenue
1
by Business Segment
1Q11
Recurring
revenue
63%
1Q10
Recurring
revenue
61%
1
Recurring revenue refers to revenue that is generally recurring in nature and
includes revenue from corporate and executive benefits, investment advisory
and asset based fees and trails. 2
The sum of the components may not agree to total due to rounding
1Q10 Revenue $225.3 million
Individual Client Group
Corporate Client Group
Advisor Services Group
$65.0
29%
$21.4
10%
$13.7
6%
$30.0
13%
$95.2
42%
($ in millions)
1Q11 Revenue $233.3 million
2 |
 DOUG HAMMOND
Chief Operating Officer |
 12
Steady and recurring business
Navigating challenging
economic and regulatory
environment
1Q11 pressure from specialty
business
Core Initiatives
Common brand and regional
focus
Diversification of products and
services
–
Health & Welfare
–
401(k)
–
P&C
–
Executive Benefits
–
Ancillary lines
High net worth life insurance
Challenges and
uncertainty remain
Large cases with longer
sale cycles in pipeline
Strong recruiting to
membership
organizations
Wealth management
Solid performance
continues
Growth drivers
New assets
Advisor recruitment
Asset-based fees (due to
broader financial market
performance)
Leading technology platform
Flexible offering serves multiple
advisor profiles
NFP B/D and NFP RIA
Hybrids –
NFP B/D and
independent RIA
Independent RIAs
Business Segment Performance
Corporate Client Group
Individual Client Group
Advisor Services Group
|
 DONNA BLANK
Chief Financial Officer |
 14
1Q11 Consolidated Financial Highlights
$19.5
$18.0
$6.1
$3.3
$2.0
$2.8
1Q10
1Q11
$27.6
$24.0
Individual Client Group
Corporate Client Group
Advisor Services Group
$51.4
$60.0
$95.2
$95.5
$78.7
$77.8
1Q10
1Q11
$225.3
$233.3
($ in millions)
Adjusted EBITDA Margin
1Q10
1Q11
Corporate Client Group
20.4%
18.8%
Individual Client Group
7.8%
4.2%
Advisor Services Group
4.0%
4.6%
Consolidated
12.3%
10.3%
61%
63%
Recurring
Revenue
1
The sum of the components may not agree to total due to rounding.
1
Revenue
Adjusted EBITDA & Margin
Revenue growth of 3.5% driven by CCG and ASG |
 15
Management Fees (excl. accelerated vesting of RSUs)
as % of Adjusted Income Before Management Fees
Corporate Client Group
Individual Client Group
NFP’s priority interest in CCG was 60.6% as of 3/31/11
NFP’s priority interest in ICG was 46.3% as of 3/31/11
41.1%
48.0%
35.7%
42.6%
1.6%
0.9%
2.0%
1.7%
-1.2%
4.0%
43.7%
38.0%
58.7%
57.1%
57.9%
53.0%
56.3%
3.7%
0.2%
6.5%
5.3%
14.3%
56.6%
4Q09
Cumulative
47.7%
36.8%
42.8%
50.0%
36.6%
44.2%
70.9%
44.9%
63.6%
63.2%
53.2%
60.0%
1Q10
Includes Prior PIP
Includes Current PIP
4Q10
Cumulative
1Q11
Includes Prior PIP
Includes Current PIP
4Q09
Cumulative
1Q10
4Q10
Cumulative
1Q11
Principal Incentive Plan Management Fees (PIP)
All Other Management Fees
-13.8%
Higher targets and quarterly business seasonality reflected in
year-over-year PIP % |
 16
-$44
$47
$36
$32
$71
-$2
$41
$124
$5
$37
$43
$119
-$6
$34
$34
In Q1, larger payments to Principals typically occur as management
fee bonuses for prior year performance are paid
Operating Cash Flow
(1)
Q1 2008 and 12/31/08 YTD acquisitions include $14.4 mm paid in connection with an
acquisition which was treated as prepaid management fees. (2)
Sum of the quarters may not agree to the full year total due to rounding.
(1)
(1)
(2)
$50
($ in millions)
Q1’08 Q2’08 Q3’08 Q4’08 FY’
08 Q1’09 Q2’09 Q3’09 Q4’09 FY’09
Q1’10 Q2’10 Q3’10 Q4’10 FY’10 Q1’11
Quarterly/Annual Operating Cash Flow |
 17
Credit agreement amendment
Consolidated fixed charges to exclude up to $50 million in share
repurchases during any four consecutive fiscal quarters
Lowered consolidated fixed charge coverage ratio covenant level from
2.0x to 1.5x
Authorization to repurchase up to $50 million of NFP stock
Balanced approach to capital allocation; maintain financial flexibility
Strategic acquisitions
Reinvestment in existing businesses
Direct
capital
return
to
shareholders
–
stock
buyback
Balanced Capital Allocation Strategy |