Attached files
 Ally Financial Inc.
1Q Earnings Review
May 3, 2011
Contact Ally Investor Relations at (866) 710-4623 or
investor.relations@ally.com Exhibit 99.2 |
 2
1Q 2011 Preliminary Results
Forward-Looking Statements and Additional Information
The following should be read in conjunction with the financial statements, notes and other information
contained in the Company’s 2010 Annual Report on Form 10-K, Quarterly Reports on Form
10-Q, and Current Reports on Form 8-K. This information is preliminary and based on
company data available at the time of the presentation In the presentation that follows and
related comments by Ally Financial Inc. (“Ally”) management, the use of the words “expect,” “anticipate,”
“estimate,” “forecast,” “initiative,” “objective,”
“plan,” “goal,” “project,” “outlook,” “priorities,” “target,” “intend,” “evaluate,” “pursue,” “seek,” “may,”
“would,” “could,” “should,” “believe,” “potential,”
“continue,” or similar expressions is intended to identify forward-looking statements. All statements
herein and in related management comments, other than statements of historical fact, including without
limitation, statements about future events and financial performance, are forward-looking
statements that involve certain risks and uncertainties. While these statements represent our
current judgment on what the future may hold, and we believe these judgments are reasonable, these
statements are not guarantees of any events or financial results, and Ally’s actual
results may differ materially due to numerous important factors that are described in the most recent
reports on SEC Forms 10-K and 10-Q for Ally, each of which may be revised or supplemented in
subsequent reports on SEC Forms 10-Q and 8-K. Such factors
include, among others, the following: maintaining the mutually beneficial relationship between Ally and General Motors (“GM”),
and Ally and Chrysler; the profitability and financial condition of GM and Chrysler; securing low cost
funding for us and Residential Capital, LLC (“ResCap”); our ability to realize the
anticipated benefits associated with being a bank holding company, and the increased regulation and
restrictions that we are now subject to; any impact resulting from delayed foreclosure sales or
related matters; the potential for legal liability resulting from claims related to the sale of
private-label mortgage-backed securities; risks related to potential repurchase obligations due to
alleged breaches of representations and warranties in mortgage securitization transactions; changes in
U.S. government-sponsored mortgage programs or disruptions in the markets in which our
mortgage subsidiaries operate; continued challenges in the residential mortgage markets; the
continuing negative impact on ResCap and our mortgage business generally due to the recent decline in
the U.S. housing market; uncertainty of our ability to enter into transactions or execute
strategic alternatives to realize the value of our ResCap operations; the potential for deterioration in
the residual value of off-lease vehicles; disruptions in the market in which we fund our
operations, with resulting negative impact on our liquidity; changes in our accounting
assumptions that may require or that result from changes in the accounting rules or their application, which could result
in an impact on earnings; changes in the credit ratings of Ally, ResCap, Chrysler, or GM; changes in
economic conditions, currency exchange rates or political stability in the markets in which we
operate; and changes in the existing or the adoption of new laws, regulations, policies or other
activities of governments, agencies and similar organizations (including as a result of the
Dodd-Frank Act). Investors are cautioned not to place undue reliance on forward-looking
statements. Ally undertakes no obligation to update publicly or otherwise revise any
forward-looking statements except where expressly required by law. Reconciliation of non-GAAP financial measures included within
this presentation are provided in this presentation.
Use of the term “loans” describes products associated with direct and indirect lending
activities of Ally’s global operations. The specific products include retail
installment sales contracts, loans, lines of credit, leases or other financing products. The term “originate” refers to Ally’s purchase,
acquisition or direct origination of various “loan” products.
|
 3
1Q 2011 Preliminary Results
•
Core
pretax
income
(1)
of
$428
million
and
net
income
of
$146
million
–
Fifth straight quarter of profitability
•
Began repayment of U.S. taxpayer investment
–
U.S.
Treasury
sold
$2.7
billion
of
Trust
Preferred
Securities
to
third
party
investors
–
Filed S-1 with the SEC for a proposed initial public offering
•
#1 overall U.S. auto lender
–
U.S. originations of $11.6 billion, up 25% from 4Q10
–
Strong growth in used and diversified channels
•
Further
improved liquidity position
–
Refinanced $15 billion of credit facilities on more favorable terms
–
Achieved multi-notch rating upgrades
•
Expanded Ally Bank and deposit base
–
Total deposits grew $1.6 billion in 1Q
–
Ally Bank now has over 425,000 deposit customers, up 8% from 4Q10
First Quarter Highlights
(1)
Core pre-tax income is a non-GAAP financial measure. Please refer to
slide 7 for further details |
 4
1Q 2011 Preliminary Results
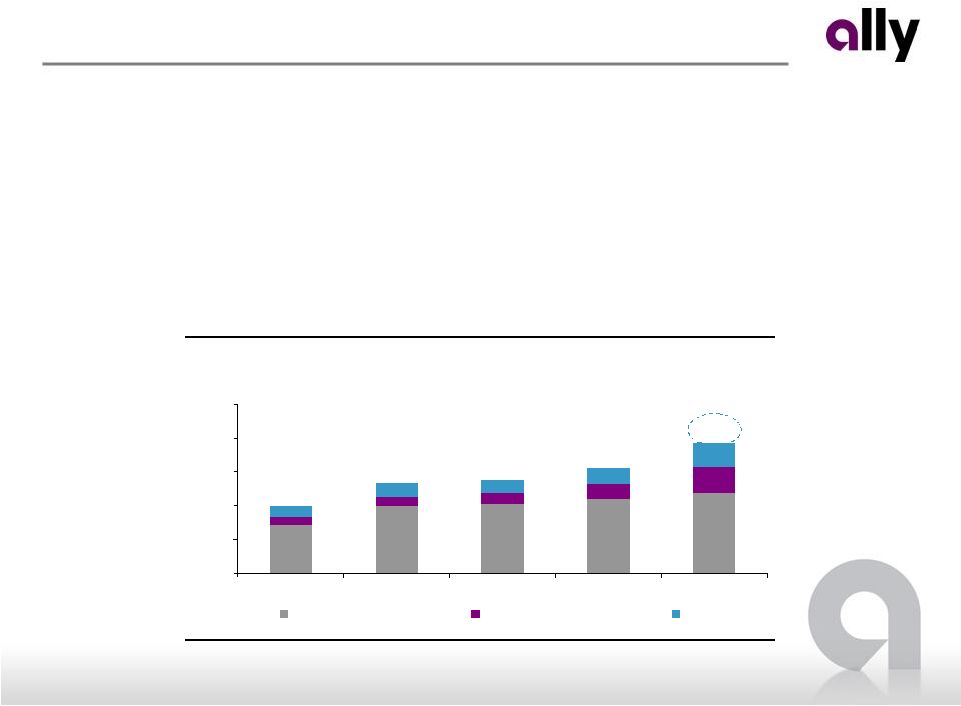
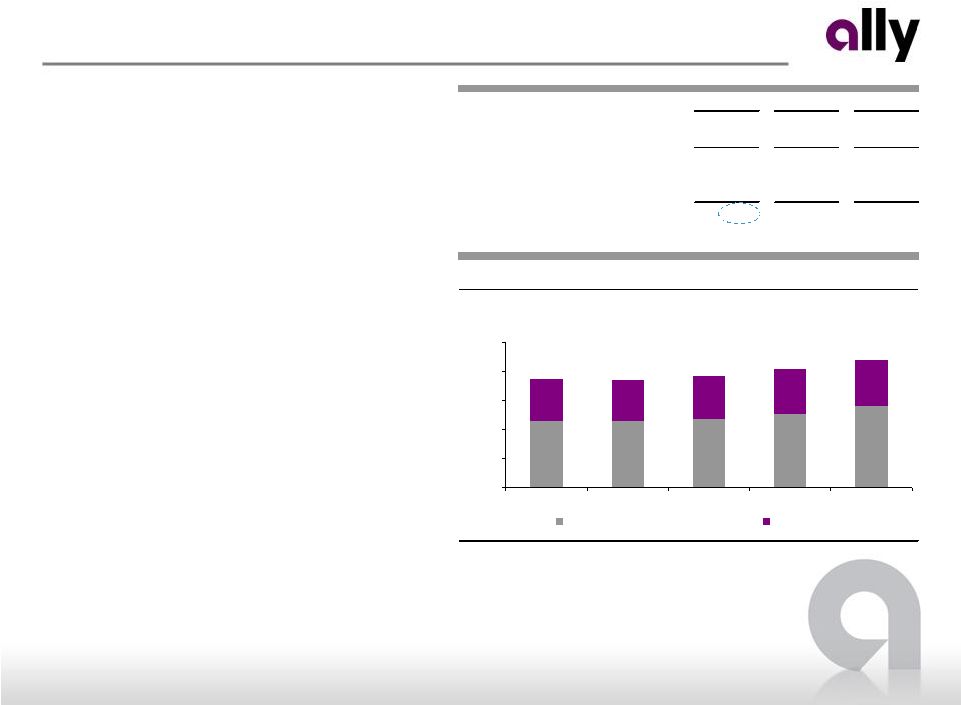
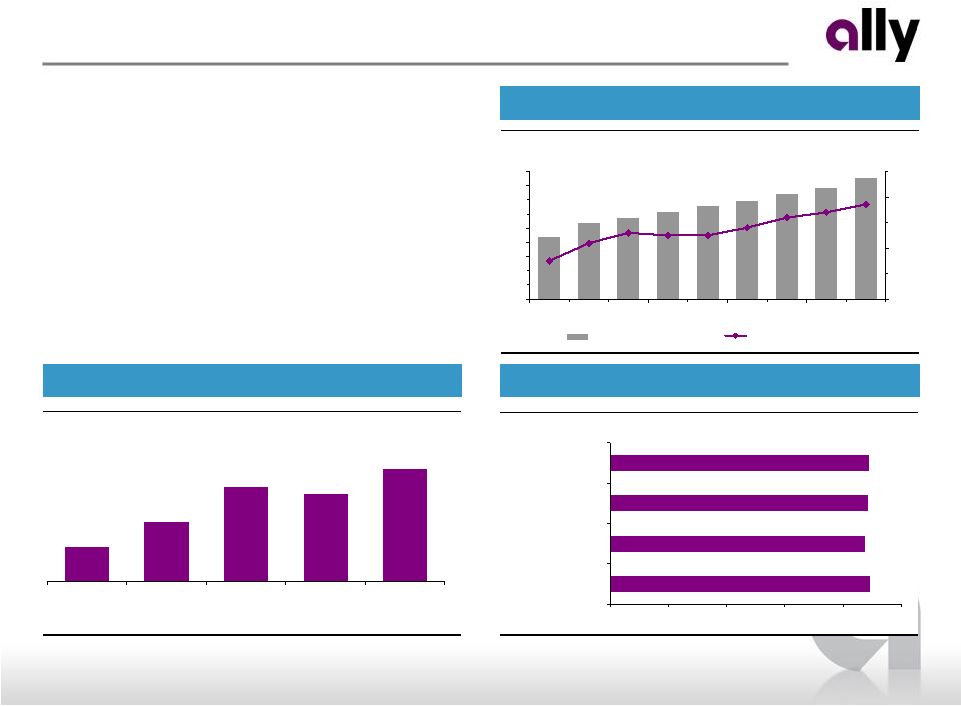
Demonstrating Auto Finance Franchise Strength
•
Evidence of competitively advantaged platform
–
Strong dealer relationships
–
Full product suite and scalable infrastructure
•
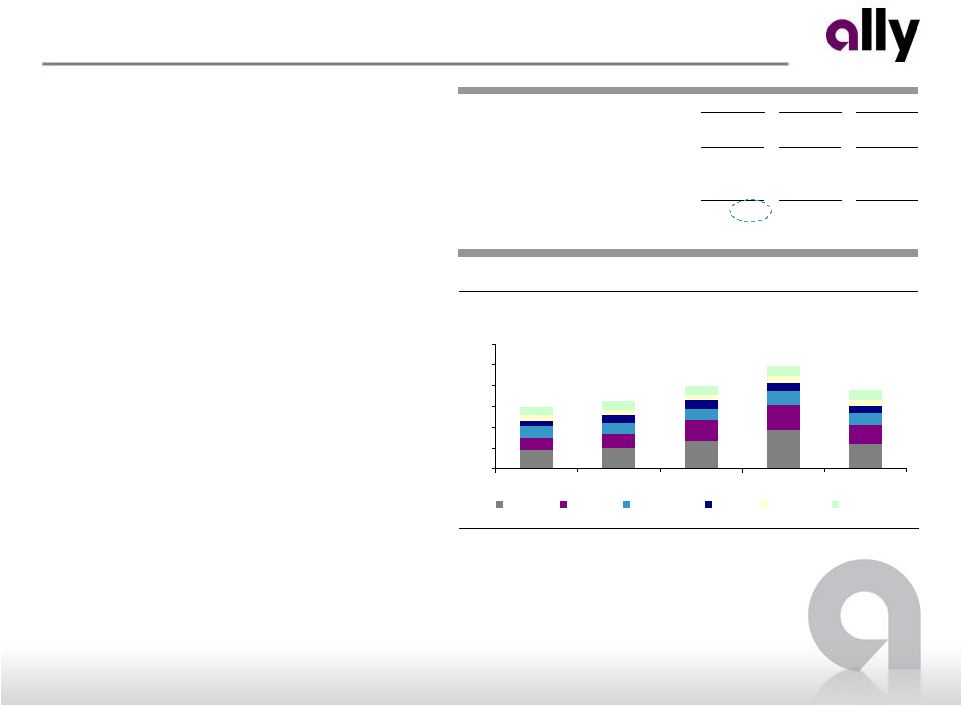
U.S. consumer originations up 25% quarter-over-quarter and 93%
year-over-year –
Used originations up 73% QoQ
–
Lease originations up 59% QoQ
–
Non GM/Chrysler new originations up 68% QoQ
U.S. Consumer Auto Originations
($ billions)
$6.0
$8.0
$8.3
$9.3
$11.6
$0.0
$3.0
$6.0
$9.0
$12.0
$15.0
1Q 10
2Q 10
3Q 10
4Q 10
1Q 11
New - Retail
New - Leases
Used |
 5
1Q 2011 Preliminary Results
Used Vehicle Market Share
2.2%
1.9%
1.8%
1.0%
0.9%
0.9%
0.8%
0.8%
4.2%
2.6%
Wells
Fargo
ALLY
Toyota
Chase
Capital
One
Santander
Drive
5th Third
Bank of
America
GM
Financial
Honda
LEASE: Tripled Originations YoY
USED: 70% Growth in Market Share Since 4Q
TOTAL MARKET: #1 Auto Finance Provider
NEW: Wide Margin Over Nearest Competitor
Auto Finance Category Leader
Source: Experian Automotive
Market share information as of 1Q 2011
Total Market Share
4.9%
4.1%
3.5%
2.9%
2.0%
1.7%
1.3%
1.3%
2.9%
6.7%
ALLY
Toyota
Honda
Wells
Fargo
Chase
Ford
Nissan
Capital
One
Hyundai
BMW
New Vehicle Market Share
7.7%
6.7%
6.3%
4.6%
3.4%
3.1%
2.9%
2.3%
1.8%
13.5%
ALLY
Toyota
Honda
Ford
Chase
Nissan
Wells
Fargo
Hyundai
Bank of
America
Capital
One
Lease Market Share
14.4%
10.1%
7.6%
5.7%
5.4%
5.3%
4.5%
3.8%
11.4%
19.8%
Honda
Toyota
ALLY
Nissan
Ford
VW
BMW
Hyundai
Mercedes
Benz
Chase |
 6
1Q 2011 Preliminary Results
2011 Strategic Priorities
Pre-eminent
Auto Franchise
Grow Deposit
Franchise
Mortgage
Franchise
Improve
Funding and
Costs
Manage Risk
Build a Winning
Culture
Build the pre-eminent global auto finance franchise by being an ally to the
dealer and strategic partner to the manufacturer
Continue to grow Ally Bank by building upon the strong consumer value
proposition
Operate a leading mortgage origination and servicing platform with lower risk
and higher operational efficiency
Continuously improve funding and operating costs
Effectively manage all our business risks
Build a winning culture that distinguishes Ally in the marketplace
Repay the U.S.
Treasury
Work toward repayment of the U.S. Treasury’s investment over time
|
 7
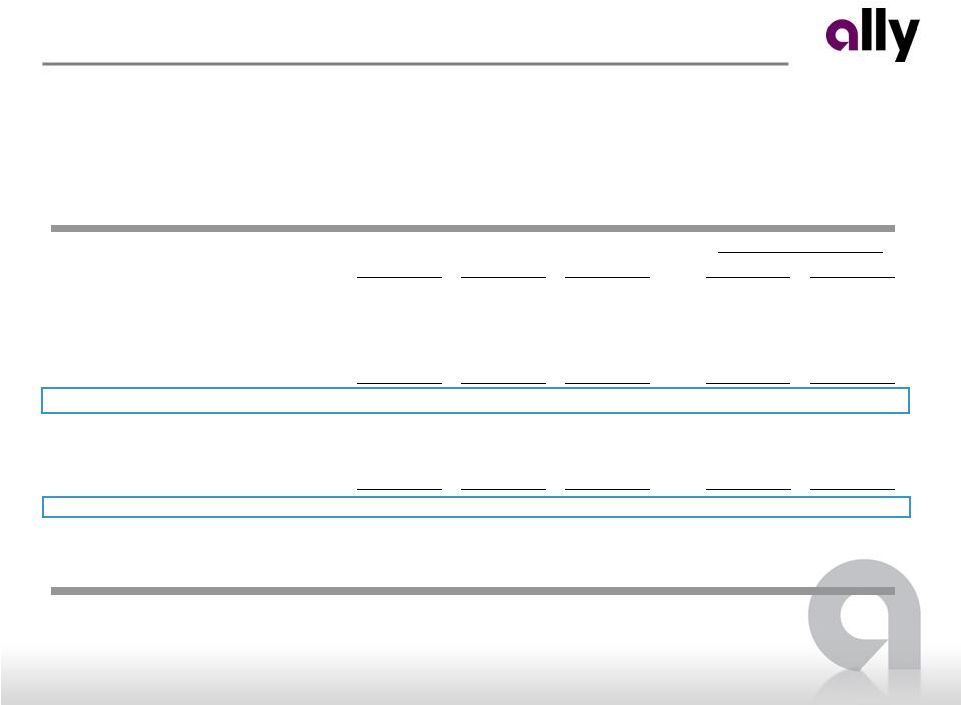
1Q 2011 Preliminary Results
($ millions)
1Q 11
4Q 10
1Q 10
4Q 10
1Q 10
Total net revenue (ex. OID)
1,933
$
2,209
$
2,247
$
(276)
$
(314)
$
Provision for loan losses
113
71
144
42
(31)
Controllable expenses
(1)
874
923
906
(49)
(32)
Other noninterest expenses
518
682
613
(164)
(95)
Core pre-tax income (loss)
(2)
428
$
533
$
584
$
(105)
$
(156)
$
OID amortization expense
(3)
326
301
397
25
(71)
Income tax expense (benefit)
(68)
36
36
(104)
(104)
(Loss) income from discontinued operations
(24)
(117)
11
93
(35)
Net income (loss)
146
$
79
$
162
$
67
$
(16)
$
Total assets
173,704
$
172,008
$
179,427
$
1,696
$
(5,723)
$
Net interest margin
(4)
2.2%
2.3%
3.0%
Increase/(Decrease) vs.
First Quarter 2011 Results
•
Five straight quarters of profitability
•
Certain
favorable
notable
items
from
2010
are
moderating
in
2011
(see
next
page)
•
Over time, profitability expected to improve
–
Cost of funds decline, more balanced credit mix, OID run off
•
Income tax benefit this quarter from $101 million release of valuation allowance in
Canadian operations (1) Includes employee related costs, consulting and legal fees, marketing,
information technology, facility, portfolio servicing and restructuring expenses
(2) Core pre-tax income is defined as income from continuing operations before taxes and primarily
bond exchange original issue discount ("OID") amortization expense
(3) Includes $30 million of accelerated OID amortization in 1Q11 and $101 million in 1Q10 from
extinguishment of debt
(4) Excludes OID amortization expense. The impact of historical financial statement restatements
for discontinued operations are not reflected in prior periods |
 8
1Q 2011 Preliminary Results
Notable Items
•
Several notable items are impacting core pre-tax income
Notable Items - Pre-Tax
($ millions)
1Q 11
4Q 10
1Q 10
4Q 10
1Q 10
NAO lease remarketing gains
119
$
155
$
185
$
(36)
$
(66)
$
Auto forward flow sale gains
-
47
113
(47)
(113)
Insurance investment income and other
80
135
141
(55)
(61)
Origination and Servicing gain on sale of mortgage loans, net
74
214
86
(140)
(12)
Mortgage net servicing revenue
240
125
193
115
47
Legacy gain on sale of mortgage loans, net
18
136
65
(118)
(47)
Total net revenue impact of notable items
531
$
812
$
783
$
(281)
$
(252)
$
Mortgage repurchase reserve expense
26
180
49
154
23
Total core pre-tax income impact of notable items
505
$
632
$
734
$
(127)
$
(229)
$
Memo:
Total net revenue (ex. OID)
1,933
$
2,209
$
2,247
$
(276)
$
(314)
$
Core pre-tax income
428
$
533
$
584
$
(105)
$
(156)
$
Fav / (Unf.) vs. |
 9
1Q 2011 Preliminary Results
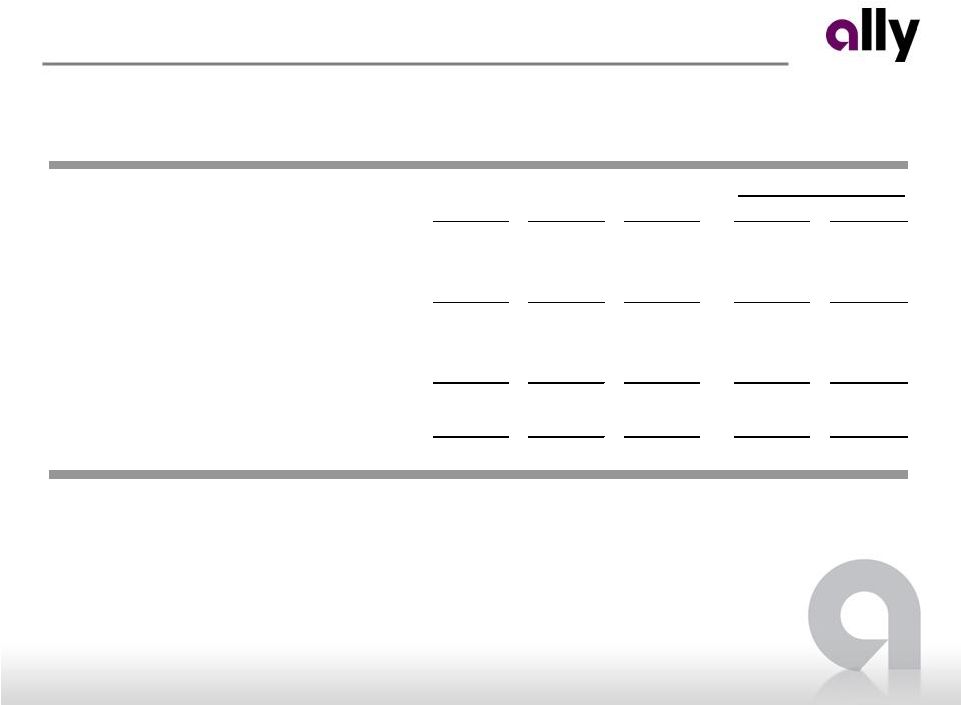
Results by Segment
(1)
Legacy Portfolio and Other segment primarily consists of loans originated prior to
Jan. 1, 2009, and includes non-core business activities including portfolios in run off
(2)
Corporate and Other as presented includes Commercial Finance Group
(“CFG”), certain equity investments and treasury activities including the residual impacts from the
corporate funds transfer pricing and asset liability management (“ALM”)
activities (3)
Core pre-tax income is a non-GAAP financial measure. Please refer to
slide 7 for further details •
Auto finance business continues positive credit and origination trends
•
Mortgage business impacted by lower volumes and higher expected servicing
costs Pre-Tax Income
($ millions)
1Q 11
4Q 10
1Q 10
4Q 10
1Q 10
North American Automotive Finance
518
$
589
$
612
$
(71)
$
(94)
$
International Automotive Finance
40
12
47
28
(7)
Insurance
134
164
183
(30)
(49)
Global Automotive Services
692
$
765
$
842
$
(73)
$
(150)
$
Mortgage Origination and Servicing
73
172
71
(99)
2
Legacy Portfolio and Other
(1)
(39)
(49)
85
10
(124)
Mortgage Operations
34
$
123
$
156
$
(89)
$
(122)
$
Corporate and Other (ex. OID)
(2)
(298)
(355)
(414)
57
116
Core pre-tax income (loss)
(3)
428
$
533
$
584
$
(105)
$
(156)
$
Increase/(Decrease) vs. |
 10
1Q 2011 Preliminary Results
Key Financials ($ millions)
1Q 11
4Q 10
1Q 10
Net financing revenue
818
$
798
$
872
$
Total other revenue
109
157
203
Total net revenue
927
955
1,075
Provision for loan losses
46
19
101
Noninterest expense
363
347
362
Pre-tax income from continuing ops
518
$
589
$
612
$
Total assets
87,662
$
81,893
$
74,786
$
•
North American segment reported pre-tax income
of $518 million
•
Net financing revenue increase of $20 million
driven by higher consumer asset balances and
favorable net lease revenues
•
Total other revenue lower by $48 million
–
Expiration of whole loan forward flow
agreements in 4Q10 and resulting loss of
gain on sale revenue
•
Provision expense higher than 4Q10 by $27
million
due
to
higher
origination
volume
but
down
$55 million from 1Q10
•
Balance sheet growth driven by strong originations
and expiration of forward flow agreements
•
Auto balance sheet is repositioning
–
Run off of higher yielding, more volatile
legacy assets
–
More loans being held on-balance sheet
–
Originating more balanced credit mix
North American Automotive Finance
NAO Earning Asset Balances
($ billions)
$87.5
$81.9
$77.0
$73.8
$74.6
$0.0
$20.0
$40.0
$60.0
$80.0
$100.0
1Q 10
2Q 10
3Q 10
4Q 10
1Q 11
Consumer
Commercial |
  11
1Q 2011 Preliminary Results
Key Statistics
Inc/(Dec) vs.
($ billions)
1Q 11
4Q 10
1Q 10
1Q 10
GM Retail Subvented
$1.8
$2.0
$1.3
42%
GM Retail Standard
3.3
2.9
1.6
104%
Chrysler Retail Subvented
0.5
0.6
0.6
-14%
Chrysler Retail Standard
1.0
0.8
0.7
49%
Diversified New
0.5
0.3
0.1
358%
Lease
(1)
2.2
1.4
0.7
215%
Used
2.3
1.3
1.0
128%
Total
$11.6
$9.3
$6.0
93%
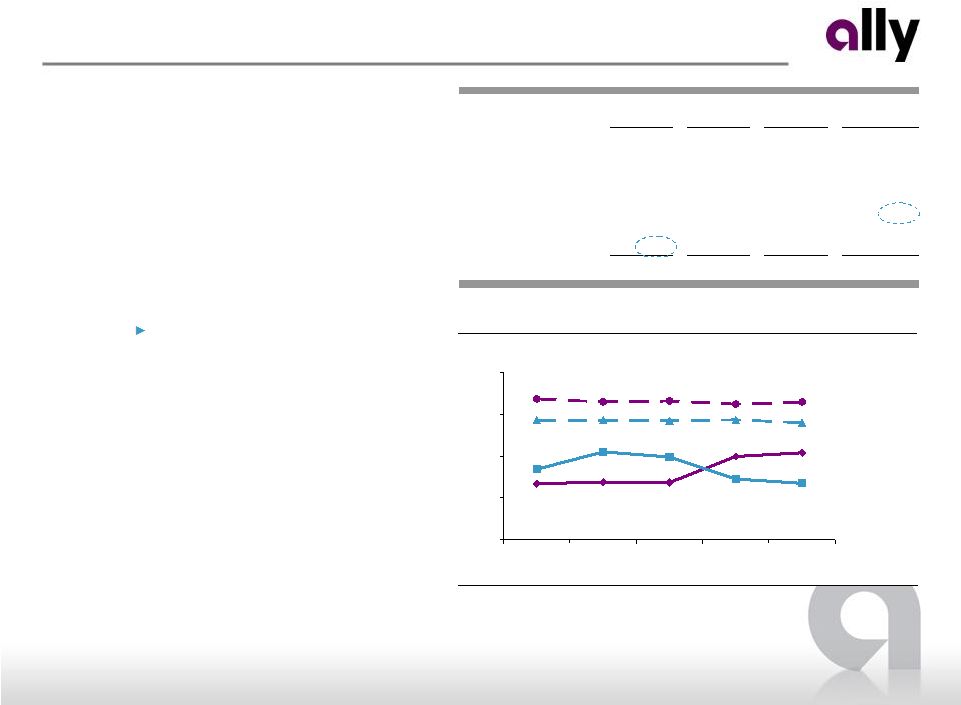
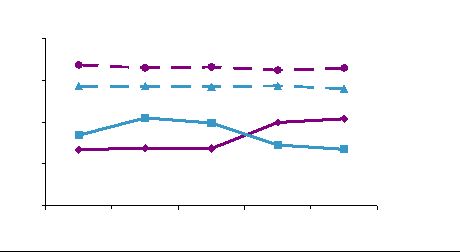
•
U.S. originations increased 25% QoQ and 93%
YoY
–
Strong consumer penetration at GM
–
Positive impact from OEM marketing
programs
–
Non GM/Chrysler new retail originations
grew 358% YoY
–
Lease originations up 215% YoY
Strong retention rate on GM pull
ahead programs
–
Used originations grew 128% YoY
U.S. Auto Originations
U.S. Penetration Rates
0%
25%
50%
75%
100%
1Q 10
2Q 10
3Q 10
4Q 10
1Q 11
GM Floorplan
Chrysler Floorplan
Chrysler Consumer
GM Consumer
(1) Includes GM and Chrysler lease originations |
  12
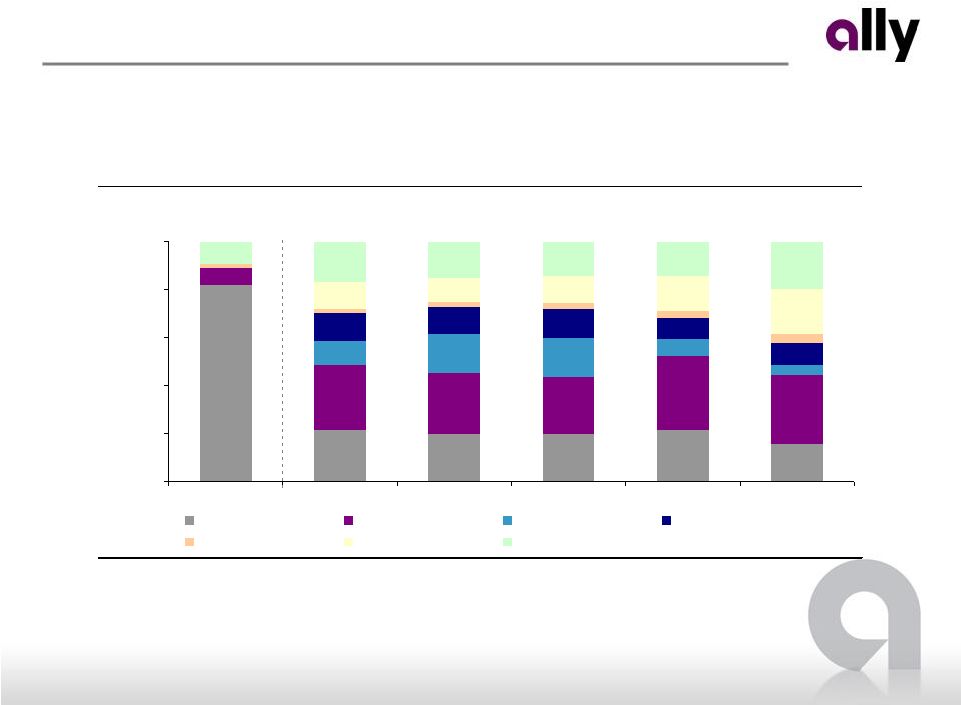
1Q 2011 Preliminary Results
U.S. Consumer Auto Originations
(% of $ originations)
16%
82%
28%
7%
4%
9%
4%
1%
19%
20%
9%
0%
20%
40%
60%
80%
100%
2006
1Q 10
2Q 10
3Q 10
4Q 10
1Q 11
GM Subvented
GM Standard
Chrysler Subvented
Chrysler Standard
Diversified New
Lease
Used
(1)
•
Diversifying originations as an independent market driven competitor
•
Subvented loan originations, subject to partial exclusivity, down to 20% of total
originations from 32% in 1Q10 U.S. Auto Origination Mix
(2)
Note: Some standard rate loan originations contain manufacturer sponsored cash back rebate
incentives. Some lease originations contain rate subvention. While Ally may
jointly develop marketing programs for these originations, Ally does not have exclusive rights to such
originations under operating agreements with manufacturers.
(1) Includes subvented loan and lease originations to which Ally had exclusive rights prior to 2009
(2) Includes GM and Chrysler lease originations |
 13
1Q 2011 Preliminary Results
•
International operations earned $40 million of
pre-tax income compared to $12 million in 4Q10
–
Net financing revenue higher by $13
million, primarily driven by higher asset
levels and improving margin in Brazil
–
Other revenue higher by $12 million due to
joint venture income in China
•
Originations up 28% year-over-year but down
24% quarter-over-quarter
–
Central bank tightening in China
–
Seasonality
•
Asset balances starting to grow after significant
streamlining over past two years
International Automotive Finance
Key Financials ($ millions)
1Q 11
4Q 10
1Q 10
Net financing revenue
171
$
158
$
178
$
Total other revenue
75
63
92
Total net revenue
246
221
270
Provision for loan losses
37
29
21
Noninterest expense
169
180
202
Pre-tax income (loss) from continuing ops
40
$
12
$
47
$
Total assets
16,295
$
15,979
$
19,378
$
Note: Originations in China part of a joint-venture in which Ally owns a
minority interest International Consumer Auto Originations (Continuing Operations)
($ billions)
$1.5
$1.6
$2.0
$2.5
$1.9
$0.0
$0.5
$1.0
$1.5
$2.0
$2.5
$3.0
1Q 10
2Q 10
3Q 10
4Q 10
1Q 11
China
Brazil
Germany
U.K.
Mexico
Other |
  14
1Q 2011 Preliminary Results
Key Financials ($ millions)
1Q 11
4Q 10
1Q 10
Insurance premiums, service revenue earned and other
440
$
464
$
480
$
Insurance losses and loss adjustment expenses
173
202
196
Acquisition and underwriting expenses
213
233
242
Total underwriting income
54
29
42
Investment income and other
80
135
141
Pre-tax income from continuing ops
134
$
164
$
183
$
Total assets
9,024
$
8,789
$
9,083
$
Key Statistics
1Q 11
4Q 10
1Q 10
Insurance Ratios
Loss ratio
40%
44%
41%
Underwriting expense ratio
48%
50%
50%
Combined ratio
88%
94%
91%
Insurance
•
Pre-tax income of $134 million, down $30 million
from 4Q10
–
Underwriting income increased $25 million
due to lower losses and lower operating
expenses
–
Investment income down due to lower
realized gains on investment portfolio
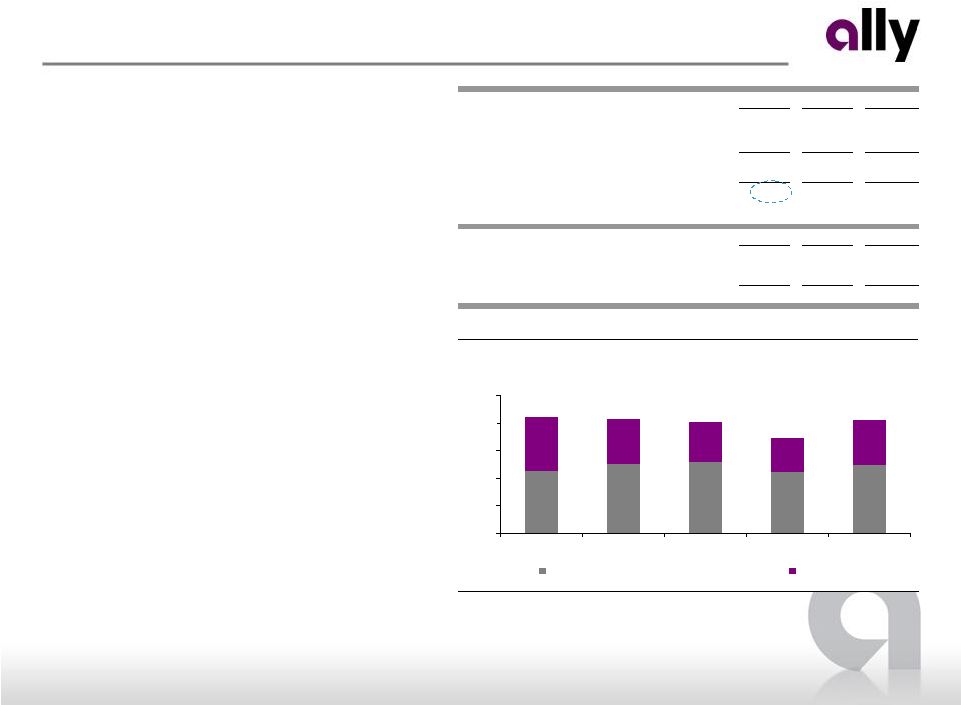
•
Written premiums increased from 4Q10 to $411
million
–
Higher written vehicle service contracts at
DP&S
–
Increase in fleet contract renewals in
international
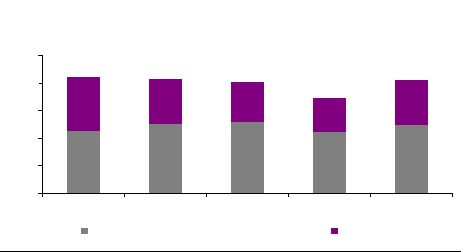
Insurance Total Written Premiums
($ millions)
$411
$346
$404
$415
$423
$0
$100
$200
$300
$400
$500
1Q 10
2Q 10
3Q 10
4Q 10
1Q 11
Dealer Products & Services
International |
  15
1Q 2011 Preliminary Results
Key Financials ($ millions)
1Q 11
4Q 10
1Q 10
Net financing revenue
(30)
$
(2)
$
(11)
$
Gain on sale of mortgage loans, net
74
214
86
Other revenue (excluding gain on sale)
277
206
260
Total net revenue
321
418
335
Provision for loan losses
2
-
1
Noninterest expense
246
246
263
Pre-tax income (loss) from continuing ops
73
$
172
$
71
$
Total assets
19,164
$
24,478
$
16,491
$
Primary servicing - EOP ($ billions)
360
$
361
$
379
$
($ millions)
1Q 11
4Q 10
1Q 10
Servicing fees
327
$
338
$
326
$
Servicing asset valuation, net of hedge
(87)
(213)
(133)
Net servicing revenue
240
$
125
$
193
$
Mortgage Operations –
Origination and Servicing
•
Continued solid performance with pre-tax income
of $73 million
–
Gain on sale revenue lower due to lower
production volumes
–
Servicing asset valuation impacted by
higher expected servicing costs
•
Loan production of $12.2 billion is down $11.6
billion from 4Q10 and $1.1 billion from 1Q10
–
Lower industry volume driven by higher
rates and seasonal trends
Residential Mortgage Loan Production
($ billions)
$13.3
$13.5
$20.5
$23.8
$12.2
$0
$5
$10
$15
$20
$25
$30
1Q 10
2Q 10
3Q 10
4Q 10
1Q 11
Prime Conforming
Government
Prime Non-Conforming
Other |
 16
1Q 2011 Preliminary Results
•
Highest HAMP conversion rate among 5 largest servicers
•
Completed
more
than
675,000
default
workouts
for
borrowers
since
2008
–
Comprises 25% of loans serviced during that time period
Leader in Loan
Modifications
Foreclosure
Process Update
Federal Consent
Order
•
Significantly bolstered foreclosure processes over the last six months
•
In
October,
began
assigning
single
point
of
contact
to
borrowers
in
need
of
assistance
•
Throughout foreclosure review process, Ally has found no instance where a
homeowner was foreclosed upon without being in significant default
Increased
Servicing Costs
•
Increased staffing levels, improved processes and foreclosure remediation have
impacted financial results:
–
Majority of foreclosure remediation costs (~$25 million) incurred in 4Q10
–
Changes reflected in the cost of servicing as part of our quarterly MSR valuation
process Increased
cost
of
servicing
since
Jan.
1,
2009
has
decreased
the
current
MSR
valuation by approximately $340 million
Impact
to
MSR
of
$79
million
in
1Q
due
to
higher
expected
future
servicing
and
foreclosure costs
•
Signed Consent Order issued by the Federal Reserve and FDIC on April 13
•
Ally
remains
committed
to
helping
borrowers
retain
homeownership
whenever
possible
•
Ally places the highest priority on meeting the requirements of the Order in a
timely manner –
Designated specific internal executive oversight team
–
Reassigned our General Auditor to lead the initiative
Mortgage Servicing Update |
 17
1Q 2011 Preliminary Results
Key Financials ($ millions)
1Q 11
4Q 10
1Q 10
Net financing revenue
78
$
98
$
193
$
Gain on sale of mortgage loans, net
18
136
65
Other revenue (excluding gain on sale)
(6)
(20)
(42)
Total net revenue
90
214
216
Provision for loan losses
45
23
6
Noninterest expense
84
240
125
Pre-tax income (loss) from continuing ops
(39)
$
(49)
$
85
$
Mortgage Operations –
Legacy Portfolio and Other
•
Pre-tax loss of $39 million
–
Lower gain on sale revenues offset by
lower repurchase expense
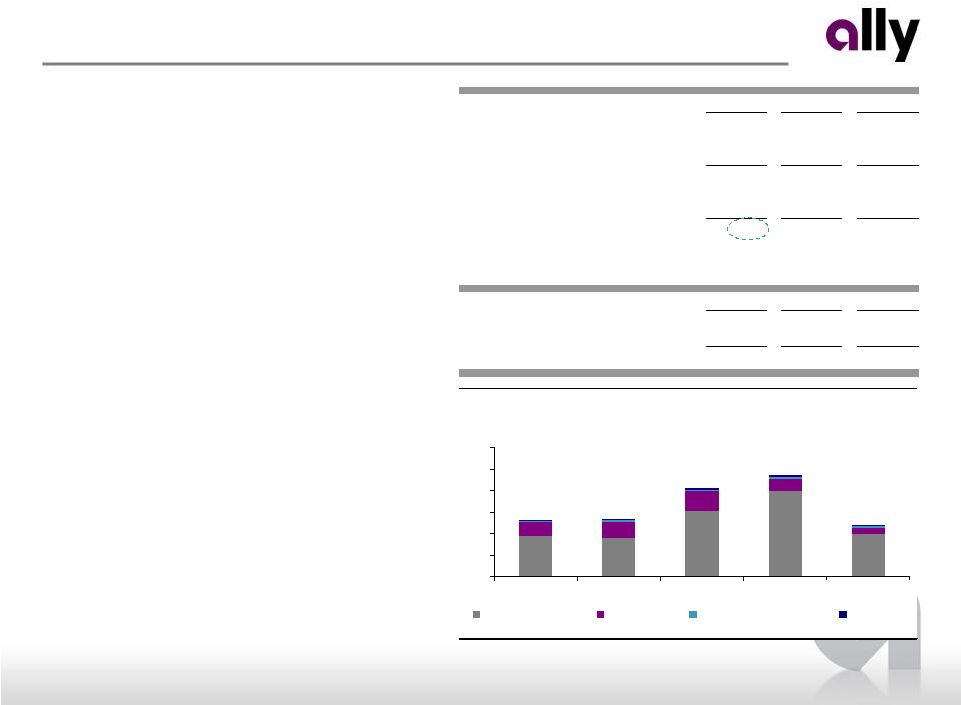
•
Assets continued to decline to $11.8 billion in 1Q
•
Legacy HFS portfolio of $1.7 billion carry value
–
Marked at 45% of UPB
–
Sold $35 million net UPB resulting in a net
gain of $7 million
•
Legacy Ally Bank HFI portfolio of $7.7 billion gross
carry value, down $323 million from 4Q10 and
down $1.4 billion from 1Q10
–
Performance has stabilized
–
Delinquencies remain in line with
expectations
–
Reserve of $508 million against portfolio
Note: Consumer loans HFI consists primarily of Ally Bank HFI (originated
pre-2009) and legacy securitizations
Legacy Portfolio & Other Balance Sheet
($ billions)
$11.8
$12.3
$15.6
$26.0
$28.0
$0
$10
$20
$30
1Q 10
2Q 10
3Q 10
4Q 10
1Q 11
Loans HFI
Disc Ops
Loans HFS
Cash, trading & other assets |
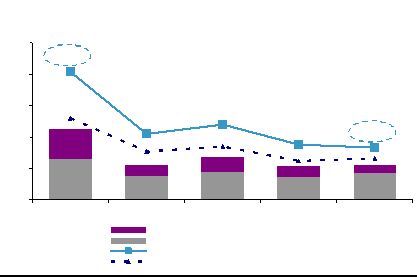
 18
1Q 2011 Preliminary Results
New Claims Trend
($ millions)
Trick
$133
$222
$281
$225
$392
1Q 10
2Q 10
3Q 10
4Q 10
1Q 11
Mortgage Repurchase Reserves
•
Mortgage repurchase reserve expense of $26
million down $154 million from 4Q10
•
Reserve balance flat to 4Q10
–
Remaining reserves are primarily for
potential non-GSE claims
•
Outstanding claims predominantly from monolines
–
Vast majority reviewed and declined
•
New claims trends down 40% from 4Q10 and 66%
from 1Q10
–
Driven by settlements reached in 2010
(1) Includes claims that Ally has requested to be rescinded but not yet confirmed
by the counterparty
(2) Represents current UPB and requested make-whole amounts for claims and
does not represent expected losses
(1) Includes settlement amounts
Mortgage Repurchase Reserves
($ millions)
1Q 10
2Q 10
3Q 10
4Q 10
1Q 11
Beginning reserve balance
1,263
$
890
$
855
$
1,128
$
830
$
Repurchase reserve expense
49
97
344
180
26
Other additions
1
25
8
37
6
Loss experience, net
(1)
(423)
(156)
(80)
(515)
(32)
Ending reserve balance
890
$
855
$
1,128
$
830
$
830
$
Outstanding
Claims
by
Counterparty
(1)(2)
($ millions)
Trick
$865
$827
$889
$918
$838
$-
$250
$500
$750
$1,000
1Q 10
2Q 10
3Q 10
4Q 10
1Q 11
GSEs
Monoline
Other |
 19
1Q 2011 Preliminary Results
Ally Bank Customer Satisfaction
89.0%
87.5%
88.3%
88.7%
0%
20%
40%
60%
80%
100%
Call Center Satisfaction
Web Satisfaction
Likelihood to Recommend
Ally Bank
Customer Satisfaction
Ranking
Ally Bank Customer Relationships
(# thousands)
220
427
1.7
1.9
0
50
100
150
200
250
300
350
400
450
1Q 09
2Q 09
3Q 09
4Q 09
1Q 10
2Q 10
3Q 10
4Q 10
1Q 11
1.5
1.6
1.7
1.8
1.9
2.0
# of Unique Ally Customers
Average Number of Accounts
Ally Bank Brand Awareness
10%
17%
27%
25%
32%
1Q 10
2Q 10
3Q 10
4Q 10
1Q 11
Ally Bank Franchise Momentum
Steadily building Ally brand awareness
Strong customer satisfaction
Growing customer base
Note: Satisfaction scores represent top-two box satisfaction scores
•
Ally’s brand promise is resonating with customers
–
Added nearly 33,000 individual deposit customers
in 1Q
–
High CD retention rates
–
Accounts per customer increasing
•
Continued platform development
–
Introducing remote deposit capabilities
–
Integrating lending operations onto website
Note: Brand awareness figures based on monthly, third party consumer survey
|
 20
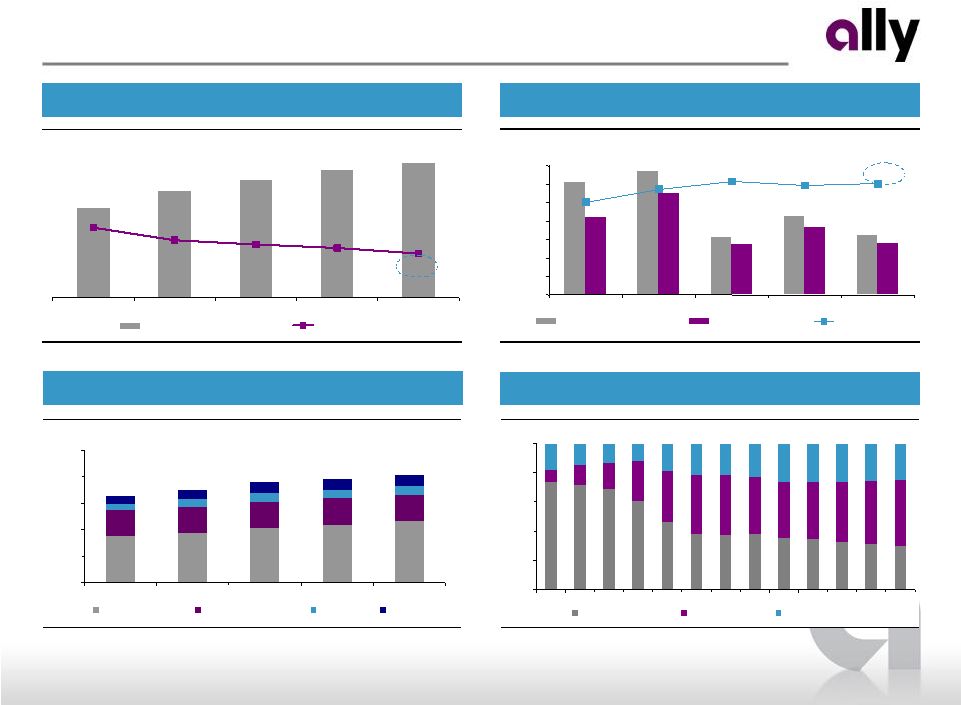
1Q 2011 Preliminary Results
Average Retail CD Maturity and Retail Deposit Portfolio Rate
(months)
Trick
16.0
19.0
21.0
22.8
24.1
2.00%
1.82%
1.76%
1.71%
1.63%
1Q 10
2Q 10
3Q 10
4Q 10
1Q 11
Avg. Retail CD Maturity
Avg. Retail Deposit Rate
Deposits
Deposit rates declining as maturity extending
Diversified deposit product mix
High CD retention rates reflect franchise strength
Stable, consistent growth of retail deposits
Ally Financial Deposit Levels
($ billions)
$40.7
$39.0
$38.0
$35.2
$32.9
$0.0
$10.0
$20.0
$30.0
$40.0
$50.0
1Q 10
2Q 10
3Q 10
4Q 10
1Q 11
Ally Bank Retail
Ally Bank Brokered
ResMor
Other
Ally Bank Deposit Composition
0%
20%
40%
60%
80%
100%
1Q 08
2Q 08
3Q 08
4Q 08
1Q 09
2Q 09
3Q 09
4Q 09
1Q10
2Q10
3Q10
4Q10
1Q 11
Brokered CD
Retail CD
MMA/OSA/Checking
Retail CD Balance Retention
(1)
($ billions)
(1) Retention includes balances retained in any Ally Bank product
82%
72%
85%
88%
86%
$0.0
$0.5
$1.0
$1.5
$2.0
$2.5
$3.0
$3.5
1Q 10
2Q 10
3Q 10
4Q 10
1Q 11
CD Balances Up for Renewal
CD Balances Retained
Retention Rate |
 21
1Q 2011 Preliminary Results
Liquidity
Unsecured
ABS
Credit Facilities
Issued $2.25 billion of U.S. unsecured debt in 1Q
Maintaining robust liquidity with minimal issuance required to address 2012
maturities Raised $4.6 billion in the securitization market in 1Q
–
$3.4 billion
of
U.S.
auto
transactions
including
retail,
lease
and
floorplan
assets
–
$748 million Canadian retail auto securitization
–
$450 million ResCap servicer advance securitization
Renewal of two large auto credit facilities totaling $15 billion
–
Capacity for both Ally Financial and Ally Bank
–
More favorable terms and lower funding costs
Additional $1.8 billion of renewals and new facilities in 1Q including mortgage
and auto facilities
•
Conservative liquidity
posture
with
total
parent
company
available
liquidity
of
$22
billion
and
consolidated
debt
maturities of $20 billion through 2012
(1)
–
Additional $11 billion of liquidity at Ally Bank to support asset generation
•
Diverse access to capital markets with over $7.2 billion of new funding in 1Q
(1) Refer to page 29 for more details |
 22
1Q 2011 Preliminary Results
Capital
Note: Refer to page 22 of the financial supplement for additional details
•
Capital ratios lower due to increase in risk-weighted assets, driven by strong
growth in auto originations •
Ally is well positioned to achieve the enhanced Basel III capital requirements in
advance of the proposed timelines –
Estimated
1Q
2011
Basel
III
Tier
1
Common
Ratio
of
10.8%
on
a
fully
converted
basis
(1)
•
Comprehensive Capital Adequacy Review plan is still under review
–
Ally
is
well
capitalized
and
“stress
testing”
is
ongoing
part
of
our
operations
•
Series A Preferred remarketing saves approximately $15 million of dividends per
annum (1) Pro forma calculation assumes full conversion of remaining MCP
to common equity and is based on management’s current interpretation of Basel III capital proposals.
This pro forma calculation is subject to change depending on final Basel III
rulemaking and interpretations thereof by regulatory authorities. ($ billions)
3/31/2011
12/31/2010
3/31/2010
Tier 1 Capital
22.1
$
22.2
$
22.1
$
Tier 1 Common Capital
12.7
$
12.7
$
7.4
$
Total Risk-Based Capital
24.1
$
24.2
$
24.4
$
Tangible Common Equity
12.9
$
13.0
$
7.8
$
Tangible Assets
173.2
$
171.5
$
178.9
$
Risk-Weighted Assets
150.8
$
148.0
$
148.4
$
Tier 1 Capital Ratio
14.7%
15.0%
14.9%
Tier 1 Common Capital Ratio
8.4%
8.6%
5.0%
Total Risk-Based Capital Ratio
16.0%
16.4%
16.4%
Tangible Common Equity / Tangible Assets
7.5%
7.6%
4.4%
Tangible Common Equity / Risk-Weighted Assets
8.6%
8.8%
5.3% |
 23
1Q 2011 Preliminary Results
Asset Quality: Summary
•
Continued positive trends in credit quality
•
Strong allowance coverage ratios relative to net charge-offs and
non-performing loans –
Almost 2.4x coverage of net charge-offs
•
Loan balance growth driven by strong auto originations
–
Global Automotive Services represents over 85% of loan balances
(1) Loans within this table are classified as held-for-investment recorded
at historical cost as these loans are included in our allowance for loan losses
(2) Net charge-off ratios are calculated as annualized net charge-offs
divided by average outstanding finance receivables and loans excluding loans measured
at fair value and loans held-for-sale
(3) ALLL coverage ratios are based on the allowance for loan losses related to
loans held-for-investment excluding those loans held at fair value as a
percentage of the unpaid principal balance, net of premiums and discounts
Ally Financial Consolidated
(1)
($ millions)
1Q 11
4Q 10
3Q 10
2Q 10
1Q 10
Ending Loan Balance
106,488
$
101,398
$
95,770
$
90,371
$
86,468
$
30+ Accruing DPD
963
1,114
1,173
1,380
1,366
30+ Accruing DPD %
0.9%
1.1%
1.2%
1.5%
1.6%
Non-Performing Loans (NPLs)
1,244
1,508
1,592
2,294
2,443
Net Charge-Offs (NCOs)
189
240
334
307
316
Net Charge-Off Rate
(2)
0.7%
1.0%
1.4%
1.4%
1.5%
Provision Expense
113
71
9
218
144
Allowance Balance (ALLL)
1,806
1,873
2,054
2,377
2,480
ALLL as % of Loans
(3)
1.7%
1.8%
2.1%
2.6%
2.9%
ALLL as % of NPLs
(3)
145.2%
124.3%
129.0%
103.6%
101.5%
ALLL as % of NCOs
(3)
239.1%
194.8%
153.8%
193.3%
196.1% |
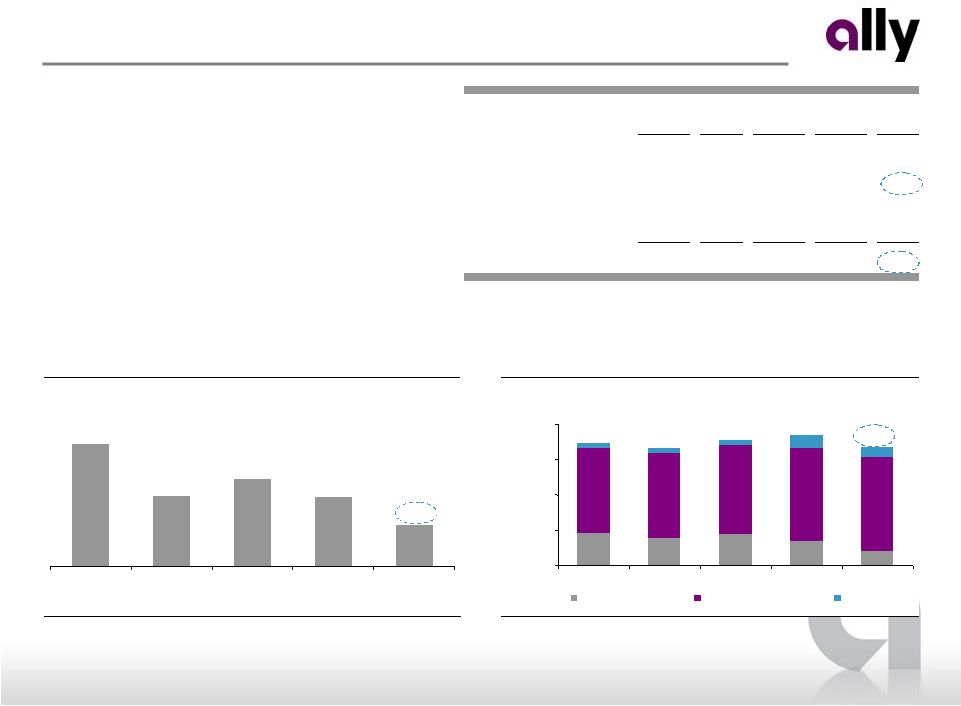
  24
1Q 2011 Preliminary Results
Global Annualized Credit Losses - Managed Retail Contract Amount
($ millions)
2.04%
1.05%
1.20%
0.88%
0.83%
0.66%
0.62%
0.85%
0.77%
1.30%
$0
$100
$200
$300
$400
$500
1Q 10
2Q 10
3Q 10
4Q 10
1Q 11
Nuvell Credit Losses
Credit Losses (excluding Nuvell)
% of Avg. Managed Assets
% of Avg. Managed Assets (excluding Nuvell)
Global Delinquencies - Managed Retail Contract Amount
$ Amount of Accruing Contracts Greater than 30 Days Past Due (millions)
2.22%
2.16%
1.81%
1.57%
1.21%
1.42%
1.94%
2.26%
2.93%
2.87%
$0
$500
$1,000
$1,500
$2,000
$2,500
1Q 10
2Q 10
3Q 10
4Q 10
1Q 11
Nuvell Delinquent Contract $
Delinquent Contract $ (excluding Nuvell)
% of Retail Contract $ Outstanding
% of Retail Contract $ Outstanding (excluding Nuvell)
Asset Quality: Global Auto Finance
•
Global auto credit quality trends continued to improve
in 1Q
–
Retail delinquencies down 52 bps from 4Q10
and 145 bps from 1Q10
–
Net credit loss ratio down 60% YoY
•
Nuvell portfolio continues to demonstrate strong
performance improvement
–
Significant decrease in delinquencies
–
Nuvell portfolio balance down to $2 billion |
 25
1Q 2011 Preliminary Results
Summary
•
Fifth straight quarter of profitability
•
Demonstrated success as pre-eminent auto finance company with significant
origination growth •
Initiated process of repaying U.S. Treasury investments with Trust Preferred
transaction •
Further improved liquidity
•
Ally Bank continued positive momentum
First Quarter Highlights
Captive
Finance Company
Market Driven
Competitor
Bank Holding
Company
Transformation |
 Supplemental Charts |
 27
1Q 2011 Preliminary Results
Key Financials ($ millions)
1Q 11
4Q 10
1Q 10
Net financing loss
(226)
$
(243)
$
(214)
$
Total other revenue
55
45
(56)
Total net loss (ex. OID)
(171)
(198)
(270)
Provision for loan losses
(17)
-
15
Noninterest expense
144
157
129
Core pre-tax loss
(298)
$
(355)
$
(414)
$
OID Amortization
(1)
326
301
397
Pre-tax loss from continuing ops
(624)
$
(656)
$
(811)
$
Total assets
29,750
$
28,561
$
31,644
$
Corporate and Other
•
OID amortization expense of $326 million in 1Q
•
Commercial Finance pre-tax income of $51
million in 1Q up from $19 million in 4Q10
–
Favorable impact on provision due to
recoveries
Supplemental
OID Amortization Schedule
($ billions)
$0.6
$0.3
$0.2
$0.1
$0.2
Avg = $0.1 / yr
2011
2012
2013
2014
2015
2016 and thereafter
As of 3/31/2011
(1) Primarily bond exchange OID amortization expense used for calculating core
pre-tax income |
 28
1Q 2011 Preliminary Results
Discontinued Operations
•
Closed the sale of Ecuador auto finance in 1Q
•
Signed agreement to sell U.K. Property and
Casualty insurance business in April 2011
•
No new operations classified as discontinued in
the quarter
•
Results driven by $26 million impairment of
Venezuela auto finance
Supplemental
(1) Definitive agreement signed in April 2011
Businesses classified as Discontinued Operations as of 3/31/2011
Auto Finance:
Australia
Russia
Venezuela
Insurance:
U.K. P&C
(1)
Impact of Discontinued Operations, net of tax
($ millions)
1Q 11
4Q 10
International Automotive Finance
(a)
(31)
$
(88)
$
Insurance
(a)
7
(20)
Global Automotive Services
(24)
(108)
Mortgage Operations
-
(9)
Consolidated net (loss) income
(24)
$
(117)
$
Total assets
523
$
690
$
(a) Includes certain income tax activity recognized by Corporate and Other |
 29
1Q 2011 Preliminary Results
Ally Financial Inc. Consolidated Unsecured Long-Term Debt Maturity Profile
($ billions)
$21
$4
$4
$2
$13
$7
2011
2012
2013
2014
2015
2016 and
thereafter
Liquidity and Unsecured Debt Maturity Profile
Supplemental
As of 3/31/11
Available Liquidity
3/31/2011
12/31/2010
($ billions)
Parent
(1)
Ally Bank
Parent
(1)
Ally Bank
Cash and Cash Equivalents
7.6
$
3.7
$
6.7
$
3.1
$
Unencumbered Securities
(2)
1.2
5.0
2.3
4.4
Current Committed Unused Capacity
(3)
10.9
4.9
11.1
3.8
Subtotal
19.7
$
13.6
$
20.1
$
11.3
$
Ally Bank Intercompany Loan
(4)
2.3
(2.3)
3.7
(3.7)
Total Available Liquidity
22.0
$
11.3
$
23.8
$
7.6
$
(1)
Parent defined as Ally Consolidated less Ally Bank, ResCap (not shown) and Insurance (not
shown)
(2)
Includes UST, Agency debt and Agency MBS
(3)
Includes equal allocation of shared unused capacity totaling $3.93 billion in 1Q and $3.89 billion at
year end which can be used by Ally Bank or the Parent (including international
subsidiaries)
(4)
To optimize use of cash and secured facility capacity between entities, Ally Financial lends cash to
Ally Bank from time to time under an intercompany loan agreement. Amounts outstanding on
this loan are repayable to Ally Financial at any time, subject to 5 days notice. |