Attached files
| file | filename |
|---|---|
| 8-K - FORM 8-K - DOLE FOOD CO INC | v59406e8vk.htm |
| EX-99.1 - EX-99.1 - DOLE FOOD CO INC | v59406exv99w1.htm |
Exhibit 99.2

| 1 1 Dole Food Company, Inc. Earnings Call and Webcast First Quarter 2011 May 3, 2011 |

| 2 2 Beth Potillo Treasurer |

| 3 3 Forward Looking Statements Some of the information presented contains forward-looking statements that involve a number of risks and uncertainties. Forward looking statements, which are based on management's assumptions and describe the company's future plans, strategies and expectations, are generally identifiable by the use of terms such as "anticipate," "will," "expect," "believe," "shall," or similar expressions. The potential risks and uncertainties that could cause the company's actual results to differ materially from those expressed or implied herein include weather-related phenomena; market responses to industry volume pressures; product and raw materials supplies and pricing; electrical power supply and pricing; changes in interest and currency exchange rates; economic crises; quotas, tariffs and other governmental actions; and international conflict. |

| 4 Non-GAAP Financial Measures EBIT, Adjusted EBITDA and Comparable Income (loss) from continuing operations (total and per share) are measures commonly used by financial analysts in evaluating the performance of companies. EBIT is calculated by subtracting income from discontinued operations, net of incomes taxes, from net income, by adding interest expense and by adding income tax expense to net income. Adjusted EBITDA is calculated by adding depreciation and amortization to EBIT, by adding the net unrealized loss or subtracting the net unrealized gain on certain derivative instruments (foreign currency and bunker fuel hedges and the cross currency swap), to or from EBIT, respectively, by adding the foreign currency loss or subtracting the foreign currency gain on the vessel obligations to or from EBIT, respectively, by adding the net unrealized loss or subtracting the net unrealized gain on foreign denominated instruments to or from EBIT, respectively, and by subtracting the gain on asset sales from EBIT. Comparable Income (loss) from continuing operations is calculated from income (loss) from continuing operations by adding charges for restructuring and long-term receivables, net of income taxes, adding the net unrealized loss or subtracting the net unrealized gain on certain derivative instruments (foreign currency and bunker fuel hedges and the cross currency swap), net of income taxes, adding the foreign currency loss or subtracting the foreign currency gain on the vessel obligations, net of income taxes, adding the net unrealized loss or subtracting the net unrealized gain on foreign denominated instruments, net of income taxes, and subtracting gain on asset sales, net of income taxes. These items have been adjusted because management excludes these amounts when evaluating the performance of Dole. Net debt is calculated as total debt less cash and cash equivalents. EBIT, Adjusted EBITDA and Comparable Income (loss) from continuing operations (total and per share) are not calculated or presented in accordance with U.S. GAAP. EBIT and Adjusted EBITDA are not a substitute for net income attributable to Dole Food Company, Inc., net income, income from continuing operations, cash flows from operating activities or any other measure prescribed by U.S. GAAP. Further, EBIT, Adjusted EBITDA and Comparable Income (loss) from continuing operations (total and per share) as used herein are not necessarily comparable to similarly titled measures of other companies. However, Dole has included EBIT, Adjusted EBITDA and Comparable Income (loss) from continuing operations (total and per share) herein because management believes that EBIT and Adjusted EBITDA are useful performance measures for Dole. In addition, EBIT, Adjusted EBITDA and Comparable Income (loss) from continuing operations (total and per share) are presented because Dole's management believes that these measures are frequently used by securities analysts, investors and others in the evaluation of Dole. |

| 5 5 David A. DeLorenzo Chief Executive Officer |

| 6 ($ millions) Packaged foods Fresh vegetables Fresh fruit Note: Graph does not include Corporate Q1 Results 2011 2010 Fresh Fruit 81 52 Fresh Vegetables 16 15 Packaged Foods 19 34 $106 $85 Q1 Adjusted EBITDA increased $21 million Fresh fruit increased $29 million 56% Higher pricing worldwide, increased volumes in North America and Asia Lower shipping and distribution costs in Europe resulting from 2010 restructuring activity, partially offset by higher fruit and packaging costs Vegetables increased $1 million Higher pricing across most major product lines, offsetting higher product costs due to a shortage of raw product Packaged foods decreased $15 million Higher marketing expenses in North America in relation to launch of FRUIT BOWLS in 100% juice, as well as higher product costs and unfavorable FX movement in Thailand and the Philippines |

| Restructuring on track Annual cost savings estimated at $36 million Latin America Severe weather conditions throughout Latin America reduced industry supply, which continued through first quarter of 2011 Europe Reduced 2011 banana volumes Lower shipping and distribution costs, partially offset by higher fruit and packaging costs North America Benefited from higher sales of bananas in North America Offset by higher fruit and packaging costs Asia Improved performance of banana operations with stronger banana prices Dole Fresh Fruit 7 |

| Fresh Vegetables EBITDA improved to $16 million Adverse weather during January and February caused product shortages Costs increased dramatically Prices on fresh-packed products also increased, covering the increase in costs Packaged salads Shifted volumes from fresh-packed to packaged salads retail business to cover product shortage caused by growing conditions Increased retail volumes by 6.5% 8 |

| U.S. Dollar Market Shares Dole Packaged Foods *Source: IRI Syndicated Data Total US for the first quarter ended March 26, 2011 and March 27, 2010 Product 2011* 2010* Canned pineapple 55% #1 55% Canned pineapple juice 56% #1 56% Fruit Bowls 49.8% #1 48.6% 9 Successful launch of FRUIT BOWLS in 100% juice Increase in Dollar market share EBITDA impacted by: Higher marketing expenses in North America Higher product costs worldwide Easter shift reduced North America volumes |

| 10 Summary Strong performance to begin fiscal 2011 with strength in fresh fruit and vegetables Successful introduction of FRUIT BOWLS in 100% juice Dole will continue to improve the balance sheet, driving down interest expense, thereby improving net income in 2011 |

| 11 11 Joseph S. Tesoriero Chief Financial Officer |

| Comparable Net Income 12 ($ millions See Appendix for definition of non-GAAP measures |

| 13 Segment Revenues 2011 2010 Fresh Fruit 1175 1123 Fresh Vegetables 246 231 Packaged Foods 265 252 $1,686 $1,606 Packaged foods Fresh vegetables Fresh fruit ($ millions) Q1 Revenues increased 5% Fresh fruit increased 5% Higher banana pricing worldwide, increased banana volumes in North America and Asia offset partially by planned volume reduction in Europe Increased volumes in Chilean fruit Vegetables increased 7% Higher pricing across most major product lines and higher volumes in packaged salads Packaged foods increased 5% Higher volumes in Europe and Asia, offset by lower North America volumes due to the later Easter holiday |
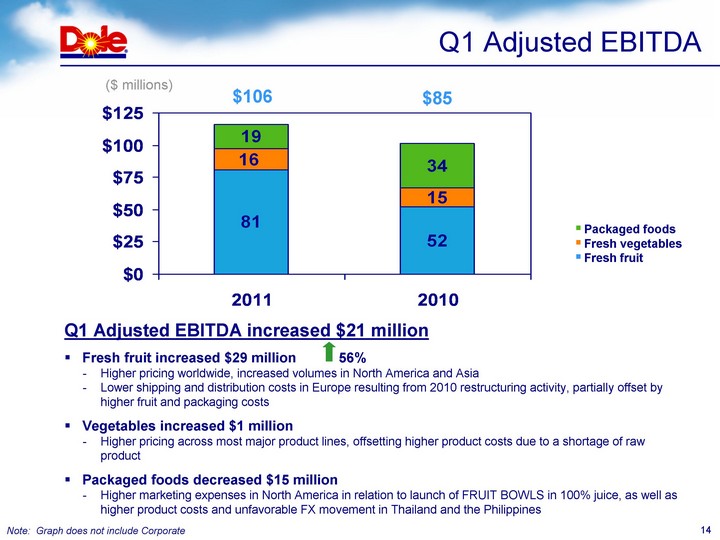
| 14 2011 2010 Fresh Fruit 81 52 Fresh Vegetables 16 15 Packaged Foods 19 34 ($ millions) $106 $85 Packaged foods Fresh vegetables Fresh fruit Note: Graph does not include Corporate Q1 Adjusted EBITDA increased $21 million Fresh fruit increased $29 million 56% Higher pricing worldwide, increased volumes in North America and Asia Lower shipping and distribution costs in Europe resulting from 2010 restructuring activity, partially offset by higher fruit and packaging costs Vegetables increased $1 million Higher pricing across most major product lines, offsetting higher product costs due to a shortage of raw product Packaged foods decreased $15 million Higher marketing expenses in North America in relation to launch of FRUIT BOWLS in 100% juice, as well as higher product costs and unfavorable FX movement in Thailand and the Philippines Q1 Adjusted EBITDA |

| 15 15 Q&A |

| 16 16 Appendix |
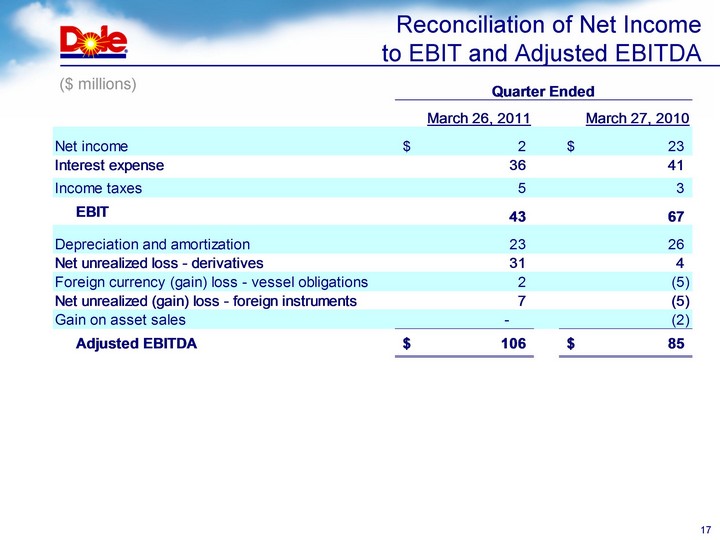
| 17 Reconciliation of Net Income to EBIT and Adjusted EBITDA ($ millions) |

| 18 Adjusted Q1 EBITDA by Segment |

| 19 Q1 Statement of Operations ($ thousands) |

| 20 Non-GAAP Financial Measures ($ thousands) |

| Balance Sheet 21 |