Attached files
| file | filename |
|---|---|
| 8-K - Colfax CORP | v220223_8k.htm |
| EX-99.1 - Colfax CORP | v220223_ex99-1.htm |
First Quarter 2011 Earnings Call May 3, 2011

Forward -Looking Statements Q1 2011 Earnings Call The following information contains forward -looking statements, including forward -looking statements within the meaning of the Private Securities Litigation Reform Act of 1995. Such forward -looking statements include, but are not limited to, statements concerning Colfax's plans, objectives, expectations and intentions and other statements that are not historical or current facts. Forward -looking statements are based on Colfax's current expectations and involve risks and uncertainties that could cause actual results to differ materially from those expressed or implied in such forward -looking statements . Factors that could cause Colfax's results to differ materially from current expectations include, but are not limited to, factors detailed in Colfax's reports filed with the U.S. Securities and Exchange Commission as well as its Annual Report on Form 10-K under the caption “Risk Factors” . In addition, these statements are based on a number of assumptions that are subject to change . This presentation speaks only as of this date. Colfax disclaims any duty to update the information herein. 1
Q1 2011 Highlights Q1 2011 Earnings Call Adjusted net income of $10.1 million (23 cents per share) compared to $6.0 million (14 cents per share) in Q1 2010, an increase of 68.6%; Q1 2011 results include the positive 1 cent per share effect of currency translation Net sales of $158.6 million compared to $120.0 million in Q1 2010, an increase of 32.2% (organic increase of 17.6%) Adjusted operating income of $16.7 million compared to $10.6 million in Q1 2010, an increase of 57.5% First quarter orders of $159.0 million compared to $119.6 million in Q1 2010, an increase of 32.9% (organic increase of 22.7%) Backlog of $369.8 million 2

Orders and Backlog Q1 2011 Earnings Call Orders Backlog $450.0 $200.0 $400.0 $350.0 $150.0 $300.0 $250.0 $100.0 $200.0 $3 9 9 $4 0 0 $3 6 7 $3 70 $3 4 9 $3 51 $159.0 $3 2 2 $3 2 7 $3 2 5 $150.0 $3 14 $2 9 1 $2 9 7 $2 8 1 $119.6 $50.0 $100.0 $50.0 $0.0 $0.0 Q1 2010 Q1 2011 2008 2008 2008 2008 2009 2009 2009 2009 2010 2010 2010 2010 2011 Q1 Q2 Q3 Q4 Q1 Q2 Q3 Q4 Q1 Q2 Q3 Q4 Q1 Existing 22.7 % Businesses Acquisitions 9.3 % FX Translation 0.9 % Total Growth 32.9 % ____________________ Note: Dollars in millions. 3

Revenue and Adjusted Operating Income Q1 2011 Earnings Call Revenue Adjusted Operating Income (1) $200.0 $20.0 $150.0 $15.0 $100.0 $10.0 $158.6 $16.7 $120.0 $50.0 $5.0 $10.6 $0.0 $0.0 Q1 2010 Q1 2011 Q1 2010 Q1 2011 Existing Businesses 17.6 % % Margin 8.8% 10.5% Acquisitions 13.3 % FX Translation 1.3 % Total Growth 32.2 % (1) Refer to Appendix for Non-GAAP reconciliation . __________________ Note: Dollars in millions (unaudited) . 4

Q1 2011 Sales and Orders by End Market Q1 2011 Earnings Call Sales: $158.6 . million Orders: $159.0 . million Defense Defense Power Power 6% 7% Generation Generation General 12% 13% Industrial General 32% Industrial 36% Oil & Gas 16% Oil & Gas 23% Commercial Commercial Marine Marine 26% 29% Total Growth (Decline) Organic Growth (Decline) Total Growth (Decline) Organic Growth (Decline) Commercial Marine 21 % 17 % Commercial Marine 35 % 32 % Oil & Gas 200 % 72 % Oil & Gas 99 % 31 % Power Generation 10 % 10 % Power Generation 58 % 58 % Defense (8)% (8)% Defense (27)% (28)% General Industrial 14 % 13 % General Industrial 24 % 18 % Total 32 % 18 % Total 33 % 23 % 5

Oil & Gas Market Perspective Q1 2011 Earnings Call Colfax Q1 2011 Sales & Orders Growth Sales Split Q1 2011 vs. Q1 2010 23% Total Organic O&G Sales 200% 72% Orders 99% 31% Highlights and Outlook Colfax Q1 2011 New project orders continuing to book; fueled by higher crude Orders Split oil prices Robust activity in Middle East, Latin America and Canada 16% O&G Quoting activity remains strong – heavy crude transfer, storage and refinery lubrication systems Acquisitions of Baric and Rosscor broadened our product offering and increased our participation in this end market 6
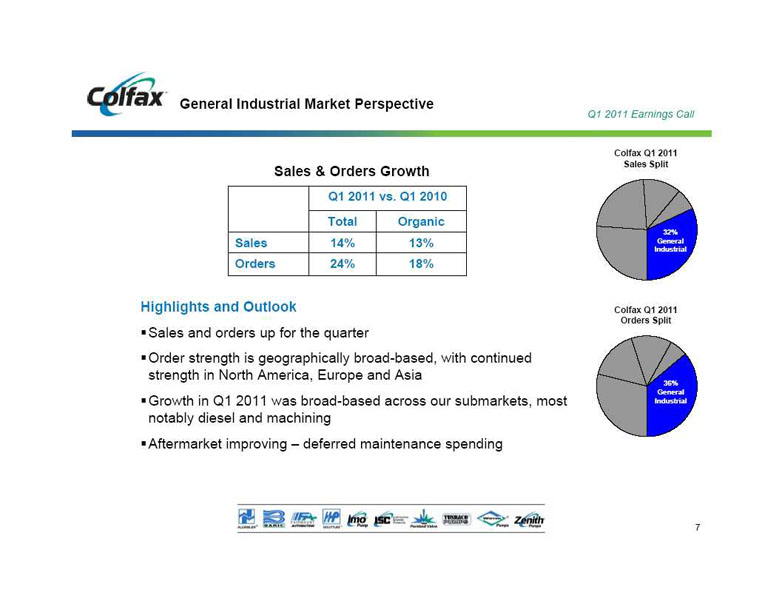
General Industrial Market Perspective Q1 2011 Earnings Call Colfax Q1 2011 Sales Split Sales & Orders Growth Q1 2011 vs. Q1 2010 Total Organic 32% Sales 14% 13% General Industrial Orders 24% 18% Highlights and Outlook Colfax Q1 2011 Orders Split Sales and orders up for the quarter Order strength is geographically broad-based, with continued strength in North America, Europe and Asia 36% General Growth in Q1 2011 was broad-based across our submarkets, most Industrial notably diesel and machining Aftermarket improving – deferred maintenance spending 7

Power Generation Market Perspective Q1 2011 Earnings Call Colfax Q1 2011 Sales & Orders Growth Sales Split Q1 2011 vs. Q1 2010 12% Power Total Organic Gen. Sales 10% 10% Orders 58 % 58 % Highlights and Outlook Colfax Q1 2011 Growth in sales and orders, despite decision to exit certain Orders Split business in the Middle East 13% Power Robust growth in OEM and packaged systems businesses, Gen. especially in Europe, North America and Asia Continuing to evaluating product offerings and pruning lower value-add business 8

Defense Market Perspective Q1 2011 Earnings Call Colfax Q1 2011 Sales Split Sales & Orders Decline Q1 2011 vs. Q1 2010 7% Total Organic Defense Sales (8)% (8)% Orders (27)% (28)% Highlights and Outlook Colfax Q1 2011 Sales and orders declined in Q1 2011, as expected Orders Split Shipment and order activity follow timing of specific ship 6% programs Defense Aftermarket orders delayed due to funding, recent approval will contribute to sales this year Solid backlog 9
Commercial Marine Market Perspective Q1 2011 Earnings Call Colfax Q1 2011 Sales & Orders Growth Sales Split Q1 2011 vs. Q1 2010 Total Organic Sales 21% 17% 26% Orders 35% 32% Comm. Marine Highlights and Outlook Colfax Q1 2011 Sales increase primarily driven by reduction in backlog Orders Split Orders increased significantly due to improved market conditions Cancellations were less than $1 million in Q1 2011 vs. $3 million in Q1 2010 29% Comm. Marine Focusing on aftermarket sales & service including opportunities related to changing environmental regulations Working through lower margin backlog 10

Rosscor Overview Q1 2011 Earnings Call Headquarters Hengelo, The Netherlands Products Multiphase pump (MPP) systems for upstream oil & gas applications Other engineered pump and compression systems Key Served Regions Russia, Kazakhstan, Southeast Asia Acquisition Rationale Logical extension to oil & gas product line in attractive segment Channel leverage (Colfax and Rosscor geographically complementary) Proven supplier with valuable domain expertise; Multiphase System consistent with strategy of delivering solutions to customers 11

Strong Financial Condition Q1 2011 Earnings Call Strong balance sheet Debt of $84 million, principal payments of $10 million in 2011, matures in 2013 Cash of $45 million $118 million available on revolver Note: As of 10/1/2010 12

Income Statement Summary (Unaudited) Q1 2011 Earnings Call Three Months Ended Change April 1, 2011 April 2, 2010 $ % Orders $ 159.0 $ 119.6 $ 39.4 32.9 % Sales $ 158.6 $ 120.0 $ 38.6 32.2 % Gross Profit $ 53.3 $ 41.8 $ 11.5 27.5 % % of Sales 33.6% 34.8% SG&A Expenses $ 34.9 $ 29.5 $ 5.4 18.3 % R&D Expense 1.6 1.6 - 0.0 % Operating Expenses $ 36.5 $ 31.1 $ 5.4 17.4 % % of Sales 23.0% 25.9% Adjusted Operating Income $ 16.7 $ 10.6 $ 6.1 57.5 % % of Sales 10.5% 8.8% Adjusted EBITDA $ 22.1 $ 14.4 $ 7.7 53.5 % % of Sales 13.9% 12.0% Adjusted Net Income $ 10.1 $ 6.0 $ 4.1 68.3 % % of Sales 6.4% 5.0% Adjusted Net Income Per Share $ 0.23 $ 0.14 $ 0.09 64.3 % Refer to Appendix for Non-GAAP reconciliation and footnotes. __________________ Note: Dollars in millions. 13

Q1 2011 Earnings Call Appendix 14

Disclaimer Q1 2011 Earnings Call Colfax has provided financial information that has not been prepared in accordance with GAAP. These non-GAAP financial measures are adjusted net income, adjusted net income per share, adjusted operating income, earnings before interest, taxes depreciation and amortization (“EBITDA”), adjusted EBITDA, organic sales growth (decline) and organic order growth (decline) . Adjusted net income, adjusted net income per share, adjusted operating income and adjusted EBITDA exclude asbestos liability and defense costs, asbestos coverage litigation expenses, and restructuring and other related charges to the extent they impact the periods presented . Adjusted net income, adjusted net income per share and projected adjusted net income per share present income taxes at an effective tax rate of 32%. Organic sales growth (decline) and organic order growth (decline) exclude the impact of acquisitions and foreign exchange rate fluctuations . These non-GAAP financial measures assist Colfax in comparing its operating performance on a consistent basis because, among other things, they remove the impact of legacy asbestos issues and items outside the control of its operating management team. Sales and order information by end market are estimates . We periodically update our customer groupings in order to refine these estimates . 15
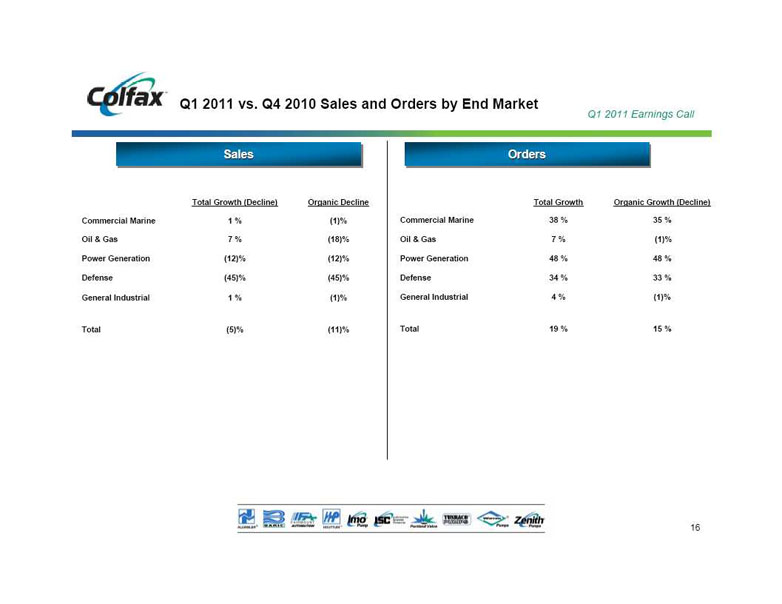
Q1 2011 vs. Q4 2010 Sales and Orders by End Market Q1 2011 Earnings Call Sales Orders Total Growth (Decline) Organic Decline Total Growth Organic Growth (Decline) Commercial Marine 1 % (1)% Commercial Marine 38 % 35 % Oil & Gas 7 % (18)% Oil & Gas 7 % (1)% Power Generation (12)% (12)% Power Generation 48 % 48 % Defense (45)% (45)% Defense 34 % 33 % General Industrial 1 % (1)% General Industrial 4 % (1)% Total (5)% (11)% Total 19 % 15 % 16

Non-GAAP Reconciliation (unaudited) Q1 2011 Earnings Call Three Months Ended April 1, 2011 April 2, 2010 EBITDA Net income (loss) $ 6,555 $ (374) Interest expense 1,827 1,813 Provision for (benefit from) income taxes 2,950 (155) Depreciation and amortization 5,353 3,735 EBITDA $ 16,685 $ 5,019 EBITDA margin 10.5% 4.2% Adjusted EBITDA Net income (loss) $ 6,555 $ (374) Interest expense 1,827 1,813 Provision for (benefit from) income taxes 2,950 (155) Depreciation and amortization 5,353 3,735 Restructuring and other related charges 1,977 4,039 Asbestos liability and defense costs 1,333 1,435 Asbestos coverage litigation expenses 2,066 3,881 Adjusted EBITDA $ 22,061 $ 14,374 Adjusted EBITDA margin 13.9% 12.0% ____________________ Note: Dollars in thousands. 17

Non -GAAP Reconciliation (unaudited) Q1 2011 Earnings Call Three Months Ended April 1, 2011 April 2, 2010 Adjusted Net Income and Adjusted Earnings per Share Net income (loss) $ 6,555 $ (374) Restructuring and other related charges 1,977 4,039 Asbestos liability and defense costs 1,333 1,435 Asbestos coverage litigation expenses 2,066 3,881 Tax adjustment to effective rate of 32% (1,812) (2,979) Adjusted net income $ 10,119 $ 6,002 Adjusted net income margin 6.4% 5.0% Weighted average shares outstanding - diluted 44,105,120 43,242,659 Adjusted net income per share $ 0.23 $ 0.14 Net income (loss) per share—diluted in accordance with GAAP $ 0.15 $ (0.01) Adjusted Operating Income Operating income $ 11,332 $ 1,284 Restructuring and other related charges 1,977 4,039 Asbestos liability and defense costs 1,333 1,435 Asbestos coverage litigation expenses 2,066 3,881 Adjusted operating income $ 16,708 $ 10,639 Adjusted operating income margin 10.5% 8.9% ____________________ Note: Dollars in thousands, except share data. 18

Sales & Order Growth (unaudited) Q1 2011 Earnings Call Sales Orders Backlog at Period End $ % $ % $ % Three months ended April 2, 2010 $ 120.0 $ 119.6 $ 281.3 Components of Change: Existing Businesses 21.1 17.6 % 27.2 22.7 % (0.4) (0.1)% Acquisitions 15.9 13.3 % 11.1 9.3 % 76.9 27.3 % Foreign Currency Translation 1.6 1.3 % 1.1 0.9 % 12.0 4.3 % Total 38.6 32.2 % 39.4 32.9 % 88.5 31.5 % Three months ended April 1, 2011 $ 158.6 $ 159.0 $ 369.8 ____________________ Note: Dollars in millions. 19