Attached files
| file | filename |
|---|---|
| 8-K - FORM 8-K - ALIMERA SCIENCES INC | c16285e8vk.htm |
| EX-99.2 - EXHIBIT 99.2 - ALIMERA SCIENCES INC | c16285exv99w2.htm |
Exhibit 99.1

| Fluocinolone Acetonide in Diabetic Macular Edema (FAME(tm)) Study: 36-Month Results Andrew N. Antoszyk, MD |

| Potential Conflicts of Interest Consultant - AlconConsultant - Alimera SciencesConsultant and Speaker - GenentechThe FAME Study is sponsored by Alimera Sciences, Inc. |

| Nonbioerodible cylindrical tube; 3.5 mm long, 0.37 mm in diameterInjected through a self sealing wound via 25-gauge proprietary inserter Two doses studied; 0.2 µg and 0.5 µg of fluocinolone acetonide (FAc) per day ILUVIEN(r) Drug Delivery Insert ILUVIEN(r) is a registered trademark of Alimera Sciences.ILUVIEN is an investigational drug, currently under review by several health authorities worldwide. |

| Consistent and Low Daily Dosing In Vitro Average Daily Wet Release Rates Human Aqueous Humor Levels1 ILUVIEN delivers a rapid and sustained therapeutic effect over 36 months 1Campochiaro P, et al. Ophthalmol. 2010;117:1393-1399. 2Data on file. Alimera Sciences. 0.2 µg/d FAc0.5 µg/d FAc 0 0 1 2 3 4 5 3 6 9 12 Months FAc Concentration +- SEM (ng/mL) 0 3 6 9 12 15 18 21 24 0.0 0.1 0.2 0.3 0.4 0.5 0.2 µg/d FAc 0.5 µg/d FAc Months FAc Released (µg/d) |

| 0 6 12 18 24 30 36 ILUVIEN 0.2 FAc µg/d (n = 376) 0.5 FAc µg/d (n = 395) Control: sham injection (n = 185) FAME Study Design Additional Laser Allowed After Week 6a Retreatment any time after Month 12 (if eligibleb) Study Ends N = 956Randomization 2:2:1 Primary Readout Patients with DME and:^ 1 previous laserBCVA ^ 19 and ^ 68 lettersTD-OCT center point ^ 250 ^m Month: a At masked investigator's discretion.b If BCVA loss ^ 5 letters or FTH ^ 50 µm from best reading in previous 12 months. |

| Baseline Characteristics and Demographics Baseline Characteristics and Demographics |

| Baseline Visual Acuity and Foveal Thickness Baseline Visual Acuity and Foveal Thickness |

| Patient Disposition Patient Disposition |

| ILUVIEN 36-Month Efficacy Results |

| (CHART) (CHART) Months Patients (%) 27.8% 28.7% 18.9% P = .018 Percentage of Patients With ^ 15-Letter Improvement Over Baseline, FAME A + B Primary Readout 28.6% 28.7% 16.2% P = .002 |

| (CHART) Mean Center Point Retinal Thickness Over Time, FAME A + B 280.0 µm 308.6 µm 299.9 µm Months Mean Center Point Thickness in Study Eye (µm) 0.5 µg/d FAc (n = 388) Control (n = 182) 0.2 µg/d FAc (n = 369) Difference in change from baseline vs controlP = .015 for 0.2 µg/d FAc P = .004 for 0.5 µg/d FAc |

| Study, Laser, and Off-Protocol Treatments Control(n = 185) 0.2 µg/d FAc(n = 376) 0.5 µg/d FAc(n = 395) Study Treatments (Sham injection or FAc insert) Study Treatments (Sham injection or FAc insert) Study Treatments (Sham injection or FAc insert) Study Treatments (Sham injection or FAc insert) 1 treatment, % 71.4 74.4 70.7 2 treatments, % 23.8 21.6 23.2 ^ 3 treatments, % 4.8 4.0 6.1 Rescue Laser Treatments (at masked physician's discretion after week 6) Rescue Laser Treatments (at masked physician's discretion after week 6) Rescue Laser Treatments (at masked physician's discretion after week 6) Rescue Laser Treatments (at masked physician's discretion after week 6) Patients, n (%) 115(62.2) 156(41.5) 157(39.7) P value - .002 < .001 Off-Protocol Treatments (IVTA, bevacizumab, or ranibizumab) Off-Protocol Treatments (IVTA, bevacizumab, or ranibizumab) Off-Protocol Treatments (IVTA, bevacizumab, or ranibizumab) Off-Protocol Treatments (IVTA, bevacizumab, or ranibizumab) Patients, n (%) 61(33.0) 57(15.2) 64(16.3) P value < .001 < .001 |

| Cataract-Related Events Cataract-Related Events a Phakic patients only.b For a minimum of 7 days. Patients, %(Study Eye) Control(n = 185) 0.2 µg/d FAc (n = 375) 0.5 µg/d FAc(n = 393) IOP > 30 mm Hg 4.3 18.4 22.9 Any IOP-lowering medsb 14.1 38.4 47.3 Trabeculoplasty 0.0 1.3 2.5 Incisional IOP-lowering surgery 0.5 4.8 8.1 IOP-Related Events |

| Subgroup Analysis Rationale Pre-specified primary endpoint for FAME was met at month 24 readout, BUT:Did a subgroup of patients with DME have a greater benefit-to-risk ratio?Ideal subgroup must meet the following:Statistically significant VA results at months 24 and 36Greater benefit-to-risk ratioIdentifiable prior to administration of ILUVIEN |

| Determination of DME Subgroup At over 100 sites on 3 continents, investigators determined a date of diagnosis of DME at baseline as part of FAME study Best clinical judgment employed Time between date of diagnosis and date of randomization was "duration of DME at baseline"Across all patients randomized, median duration of DME at baseline was 3 yearsResults presented are based on ^ 3 years duration of DME at baseline, and < 3 years duration of DME at baselineThis was a preplanned subgroup analysis |

| Baseline Demographics and Disease Characteristics, FAME A + B, DME ^ 3 Years FAME A + B, DME ^ 3 Years FAME A + B, DME ^ 3 Years Full Analysis Population |

| Baseline Demographics and Disease Characteristics, FAME A + B, DME < 3 Years FAME A + B, DME < 3 Years FAME A + B, DME < 3 Years Full Analysis Population |

| FAME A Duration of DME Subgroup Analysis |

| (CHART) Months Patients (%) 31.8% 13.6% P = .010 Percentage of Patients With ^ 15-Letter Improvement Over Baseline, FAME A, DME ^ 3 Years Primary Readout P = .004 P < .001 Full Analysis Population |

| (CHART) Months Patients (%) 24.1% 28.6% P = .441 Percentage of Patients With ^ 15-Letter Improvement Over Baseline, FAME A, DME < 3 Years Primary Readout P = .836 P = .767 Full Analysis Population |

| FAME B Duration of DME Subgroup Analysis |

| (CHART) Months Patients (%) 36.4% 13.2% P = .004 Percentage of Patients With ^ 15-Letter Improvement Over Baseline, FAME B, DME ^ 3 Years Primary Readout P = .006 P < .001 Full Analysis Population |

| (CHART) Months Patients (%) 20.7% 27.0% P = .424 Percentage of Patients With ^ 15-Letter Improvement Over Baseline, FAME B, DME < 3 Years Primary Readout P = .886 P = .775 Full Analysis Population |

| FAME A + B Duration of DME Subgroup |

| (CHART) Months Patients (%) 34.0% 13.4% P < .001 Percentage of Patients With ^ 15-Letter Improvement Over Baseline, FAME A + B, DME ^ 3 Years Primary Readout P < .001 P < .001 Full Analysis Population |

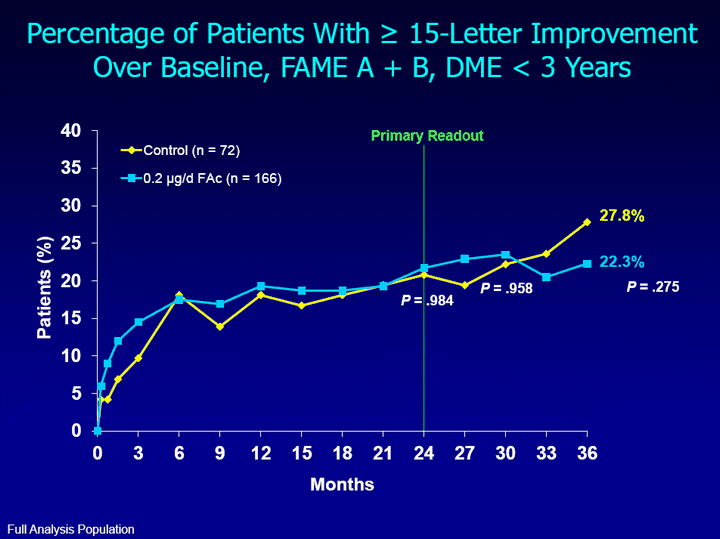
| (CHART) Months Patients (%) 22.3% 27.8% P = .275 Percentage of Patients With ^ 15-Letter Improvement Over Baseline, FAME A + B, DME < 3 Years Primary Readout P = .984 P = .958 Full Analysis Population |

| Percentage of Patients With ^ 15-Letter Improvement Over Baseline, FAME A + B DME < 3 Years DME ^ 3 Years (CHART) Months Patients (%) 28.8% 34.0% 13.4% P < .001 P < .001 P = .002 P = .003 28.4% 34.4% 13.4% (CHART) Months 26.4% 22.3% 27.8% P = .275 P = .984 P = .793 P = .245 28.7% 21.7% 20.8% Full Analysis Population |

| Mean Change in Excess Center Point Thickness Percentage of Patients With ^ 15-Letter Response DME < 3 Years DME ^ 3 Years (CHART) (CHART) (CHART) (CHART) FAME A + B, Full Analysis Population Months Patients (%) Months Patients (%) Months Change in Excess CPT (^m) Months Change in Excess CPT (^m) 0.2 µg/d FAc Control |

| Cataract-Related Events Cataract-Related Events Patients, %(Study Eye) Control(n = 112) 0.2 µg/d FAc (n = 209) 0.5 µg/d FAc(n = 213) IOP > 30 mm Hg 5.4 14.8 21.1 Any IOP-lowering medsb 15.2 35.9 48.4 Trabeculoplasty 0.0 1.9 3.3 Incisional IOP-lowering surgery 0.0 5.3 8.9 IOP-Related Events FAME A + B, DME ^ 3 Years a Phakic patients only.b For a minimum of 7 days.Full Analysis Population. |

| Cataract-Related Events Cataract-Related Events Patients, %(Study Eye) Control(n = 72) 0.2 µg/d FAc (n = 165) 0.5 µg/d FAc(n = 178) IOP > 30 mm Hg 2.8 23.0 24.7 Any IOP-lowering medsb 12.5 41.8 46.1 Trabeculoplasty 0.0 0.6 1.7 Incisional IOP-lowering surgery 1.4 4.2 7.3 IOP-Related Events FAME A + B, DME < 3 Years a Phakic patients only.b For a minimum of 7 days.Full Analysis Population. |

| Conclusions Patients with DME ^ 3 years, treated with the 0.2 µg/day FAc insert:Had a greater rate of ^ 3-line gainers than the sham control patients at month 36 (34.0% vs 13.2%, P < .001)Required only 1 insert during the study in > 75% of casesHad an incidence of IOP-lowering surgery of 5.3%Visual outcomes in this group were not affected by surgery Most patients treated with the FAc insert required cataract surgery during the study |

| Acknowledgments The FAME Study Group956 Patients101 sites in North America, Europe and IndiaWisconsin Fundus Photograph Reading CenterBernie McCary - Endothelial Cell Count Reading CenterCROs: Chiltern, EMMES, SIRO, CovanceAlimera Sciences, Inc.pSivida, Inc. |
