Attached files
| file | filename |
|---|---|
| 8-K - FORM 8-K - 3D SYSTEMS CORP | f8k_050311.htm |
May 3 2011
Investor Presentation
May 2011
www.3dsystems.com NASDAQ:TDSC

Company Confidential
2
Forward Looking Statements
This presentation contains forward-looking statements, as defined by federal and state securities laws. Forward-looking statements include
statements concerning plans, objectives, goals, strategies, expectations, intentions, projections, developments, future events, performance
or products, underlying assumptions, and other statements which are other than statements of historical facts. In some cases, you can
identify forward-looking statements by terminology such as ''may,'' ''will,'' ''should,'' “hope,'' "expects,'' ''intends,'' ''plans,'' ''anticipates,''
"contemplates," ''believes,'' ''estimates,'' ''predicts,'' ''projects,'' ''potential,'' ''continue,'' and other similar terminology or the negative of
these terms. From time to time, we may publish or otherwise make available forward-looking statements of this nature. All such forward-
looking statements, whether written or oral, and whether made by us or on our behalf, are expressly qualified by the cautionary statements
described on this message including those set forth below. In addition, we undertake no obligation to update or revise any forward-looking
statements to reflect events, circumstances, or new information after the date of the information or to reflect the occurrence or likelihood
of unanticipated events, and we disclaim any such obligation.
Forward-looking statements are only predictions that relate to future events or our future performance and are subject to known and
unknown risks, uncertainties, assumptions, and other factors, many of which are beyond our control, that may cause actual results,
outcomes, levels of activity, performance, developments, or achievements to be materially different from any future results, outcomes,
levels of activity, performance, developments, or achievements expressed, anticipated, or implied by these forward-looking statements. As a
result, we cannot guarantee future results, outcomes, levels of activity, performance, developments, or achievements, and there can be no
assurance that our expectations, intentions, anticipations, beliefs, or projections will result or be achieved or accomplished. These forward-
looking statements are made as of the date hereof and are based on current expectations, estimates, forecasts and projections as well as
the beliefs and assumptions of management. 3D System’s actual results could differ materially from those stated or implied in forward-
looking statements. Past performance is not necessarily indicative of future results. We do not intend to update these forward looking
statements even though our situation may change in the future. Further, we encourage you to review the risks that we face and other
information about us in our filings with the SEC, including our Annual Report on Form 10-K which was filed on February 17, 2011. These are
available at www.SEC.gov.

Company Confidential
3
Profile

Company Confidential
4
Balanced Revenue Composition… 2010 FY

Company Confidential
5
Leading Provider of 3D Content-to-Print Solutions

Company Confidential
6
Global Reach with Local Presence
United States
- Rock Hill, SC
- Atlanta, GA
- Goodland, IN
- Lawrenceburg, TN
- Seattle, WA
- Syracuse, NY
- Valencia, CA
- Vernon Hills, IL
Europe
- England
- France
- Germany
- Italy
- Switzerland
Asia-Pacific
- China
- Hong Kong
- Japan
- Singapore

Company Confidential
7
Compelling Business Model
Printer Consumables

Company Confidential
8
Leadership Through Technology
Professional 3D Printers:
MJM, SLA®
MJM, SLA®
Price: $1,300 - $9,900
Personal 3D Printers:
FTI, PJP
Price: $49,000 - $199,000
Production 3D Printers:
SLA®, SLS®, SLM
SLA®, SLS®, SLM
Price: $250,000 - $950,000

Company Confidential
9
High-Performance Integrated Print Materials
q High-definition materials for
concept models and functional
prototypes
concept models and functional
prototypes
q Accurate durable materials for
rapid prototyping and
manufacturing of end-use
parts
rapid prototyping and
manufacturing of end-use
parts
q Engineered plastic materials
and composites that are tough
and stable for demanding end-
use environments
and composites that are tough
and stable for demanding end-
use environments
q Fully dense metals and alloys
for rapid tools and real parts
for rapid tools and real parts

Company Confidential
10
Expanding Range of End-Use Applications

Company Confidential
11
First Mover Advantage… Diverse Customer Base

Company Confidential
12
Clear Competitive Advantage

Company Confidential
13
Marketplace Convergence Drives Opportunities
Source: 3D Systems

Company Confidential
14

Company Confidential
15
Results From Growth Initiatives: Custom Parts Services
Access to end
users
users
Build scale and
presence
presence
Consolidate
channel
channel
Shape brand
experience
experience
Quickparts®
3Dproparts™
Exited 2010 with
$18.3 M of annual
customer parts services
revenue
$18.3 M of annual
customer parts services
revenue
Acquired Quickparts®
(Feb 2011) with 2010
revenue of $25.2 M
(Feb 2011) with 2010
revenue of $25.2 M
Generated $10.3 M
customer parts services
revenue in Q1 2011
customer parts services
revenue in Q1 2011
Improved gross profit
margin sequentially:
margin sequentially:
• 26% Q4, 2010
• 39% Q1, 2011

Company Confidential
16
Results From Growth Initiatives: 3D Printers
Record 2010 printer revenue of $54.7
million and 79% growth over prior year
million and 79% growth over prior year
Record Q1 2011 printer revenue of $13.5
million and 54% growth over Q1 2010
million and 54% growth over Q1 2010

Company Confidential
17
Results From Growth Initiatives: Healthcare Solutions
ITE hearing aids
Dental restorations
Orthodontic aligners
Orthopedic implants
Prosthetics
Trauma procedures

Company Confidential
18
Full Year 2010
2010
2010
79%
Across-The-Board Revenue Growth
$ in millions
38%
46%
16%
$ 30.5
$ 54.7
$ 32.0
$ 46.8
$ 50.3
$ 58.4
$ 15.7
$ 21.6
2010

Company Confidential
19
Shareholder Value
Acquisitions Track Record
2011
Quickparts
National RP Support
ATI
Sycode
Print3D
2010
Provel
Bits From Bytes
Express Pattern
CEP
Protometal
Design Prototyping Technologies
Moeller Design & Development
2009
AdvaTech Manufacturing
Acu-Cast Technologies
Desktop Factory

Company Confidential
20
Experienced Management Team
Bob Grace
GC&S
GC&S
Damon Gregoire
CFO
CFO
Abe Reichental
CEO
CEO
Chuck Hull
CTO
CTO
Kevin McAlea
Sales
Sales
Cathy Lewis
Marketing
Marketing

May 3 2011
Financial Overview
www.3dsystems.com NASDAQ:TDSC

Company Confidential
22
Revenue Categories
Geography
First Quarter Revenue by Category & Geography
Asia Pacific
2010
2010
2011
2011

Company Confidential
23
First Quarter 2011
2010
2010
54%
Across-The-Board Revenue Growth
$ in millions
52%
103%
15%
$ 8.8
$ 13.5
$ 9.2
$ 18.8
$ 13.6
$ 15.6
$ 4.1
$ 6.2
2010

Company Confidential
24
|
First Quarter
|
||||||
|
|
|
|
|
|
|
|
|
Drivers
|
|
2011
|
|
2010
|
|
% Change
Favorable/(Unfavorable)
|
|
Revenue
|
|
$ 47.9
|
|
$ 31.6
|
|
51%
|
|
Gross Profit
|
|
$ 23.2
|
|
$ 14.3
|
|
62%
|
|
% of Revenue
|
|
48%
|
|
45%
|
|
|
|
Operating Expenses
|
|
$15.8
|
|
$11.7
|
|
(35%)
|
|
% of Revenue
|
|
33%
|
|
37%
|
|
|
|
Net Income
|
|
$6.8
|
|
$2.0
|
|
238%
|
|
% of Revenue
|
|
14%
|
|
6%
|
|
|
|
Depreciation & Amortization
|
|
$2.4
|
|
$1.5
|
|
(60%)
|
|
% of Revenue
|
|
5%
|
|
5%
|
|
|
|
Diluted Earnings Per Share
|
|
$0.28
|
|
$0.09
|
|
211%
|
$ in millions, except earnings per share
-Percents are rounded to nearest whole number
First Quarter 2011 Operating Results

Company Confidential
25
Printer Razor and Blade Profile
(1) Model assumes net annual material revenue of $12,000 per printer from a mix of all printers. Model illustrates cumulative revenue growth of adding 100
new printers/year for five years. This target model is not intended to constitute financial global guidance related to the company’s expected performance. It is
based upon management’s current expectations concerning future events and trends and is necessarily subject to uncertainties.
new printers/year for five years. This target model is not intended to constitute financial global guidance related to the company’s expected performance. It is
based upon management’s current expectations concerning future events and trends and is necessarily subject to uncertainties.
Personal & Professional Printer Revenue Model (1)
Commentary
q Our “razor and blades” business model
centers on sustainable profitable growth
from consumables
centers on sustainable profitable growth
from consumables
q Recurring revenue drives sustainability and
profitability
profitability
q We expect higher margin integrated print
materials revenue to drive further margin
expansion and reduce seasonality as our
installed base grows over time
materials revenue to drive further margin
expansion and reduce seasonality as our
installed base grows over time
q Our personal and professional printers
consume an average of $12,000 of materials
annually (excluding BfB™ printers)
consume an average of $12,000 of materials
annually (excluding BfB™ printers)
Company Confidential
26
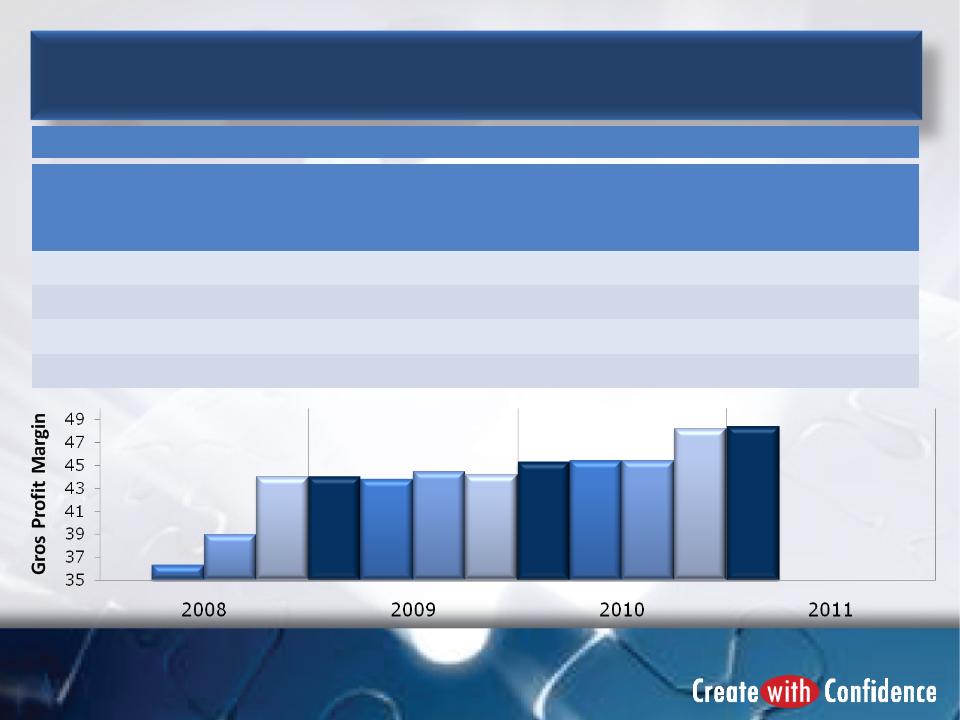
|
First Quarter
|
||||||
|
|
|
|
|
|
|
|
|
Category
|
2011
|
2010
|
Yr-Yr%
|
|||
|
$ Millions
|
Gross Profit
Margin |
$ Millions
|
Gross Profit
Margin |
$
|
Margin
|
|
|
Printers
|
$5.5
|
41%
|
$ 3.1
|
36%
|
75%
|
13%
|
|
Materials
|
$9.9
|
63%
|
$ 8.3
|
61%
|
20%
|
5%
|
|
Services(1)
|
$7.8
|
42%
|
$ 2.9
|
32%
|
167%
|
31%
|
|
Total
|
$23.2
|
48%
|
$ 14.3
|
45%
|
62%
|
7%
|
Gross Profit and Margin Trend
Company Confidential
27
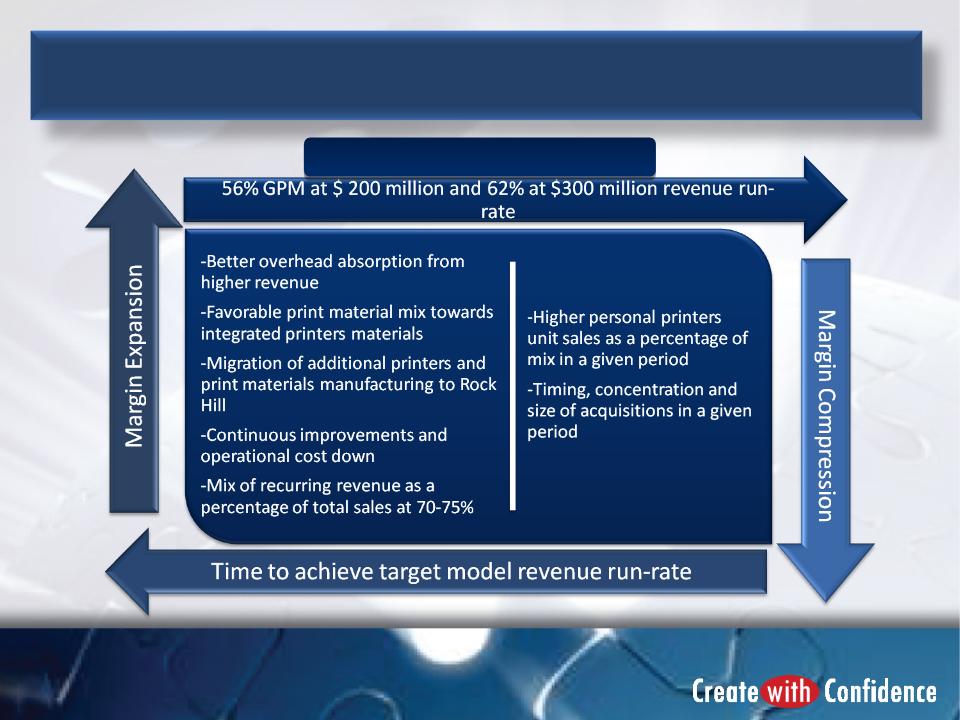
Expected Margin Expansion Path
Long-Term Target

Company Confidential
28
|
First Quarter
|
|||
|
|
|
|
|
|
Category
|
2011
|
2010
|
% Change Favorable
(Unfavorable) |
|
Selling, general & administrative
|
$13.0
|
$ 9.2
|
(42%)
|
|
Research and development
|
$2.8
|
$ 2.5
|
(13%)
|
|
Total Operating Expenses
|
$15.8
|
$ 11.7
|
(35%)
|
|
% of Revenue
|
33%
|
37%
|
11%
|
• Total operating expenses increased primarily due to:
• Higher commissions from increased revenue
• Cost from additional acquisitions made during the quarter
• Legal expenses of $1.7 million primarily due to litigation concentration and timing
• Selling, general & administrative expenses decreased to 27% of revenue for the quarter from 29% in the first quarter of 2010
• Research & development expenses decreased to 6% of revenue in 2011 from 8% of revenue in the 2010 quarter
($ in millions)
First Quarter Operating Expenses

Company Confidential
29
Operating Leverage Expected To Continue
$ in millions

Company Confidential
30
Factors Affecting Earnings Per Share

Company Confidential
31
Favorable EPS Trend
Revenue and margin expansion, coupled with operating cost containment and
optimization resulted in an improved bottom line and stronger balance sheet
optimization resulted in an improved bottom line and stronger balance sheet
|
EPS Improvement over Prior Year's Quarter
|
|
|
|
|
|
Q1 2009
|
$0.08
|
|
Q2 2009
|
$0.09
|
|
Q3 2009
|
$0.08
|
|
Q4 2009
|
$0.08
|
|
Q1 2010
|
$0.18
|
|
Q2 2010
|
$0.18
|
|
Q3 2010
|
$0.19
|
|
Q4 2010
|
$0.24
|
|
Q1 2011
|
$0.19
|

Company Confidential
32
|
|
|
|
|
|
|
March 31, 2011
|
December 31, 2010
|
% Change
Favorable (Unfavorable)
|
|
Cash
|
$70.8
|
$ 37.3
|
90%
|
|
Inventory
|
$ 26.6
|
$23.8
|
(12%)
|
|
Accounts Receivable
|
$ 39.3
|
$ 35.8
|
10%
|
|
Accounts Payable
|
$ 23.4
|
$ 26.6
|
12%
|
|
Working Capital
|
$ 76.5
|
$ 42.5
|
80%
|
• Cash increased $33.5 million from the fourth quarter of 2010, primarily reflecting $54.0 million
proceeds from our equity raise and $22.1 million paid in cash for acquisitions during the quarter.
proceeds from our equity raise and $22.1 million paid in cash for acquisitions during the quarter.
• Working capital increased $34.0 million compared to the end of 2010, including a $3.5 million
increase in accounts receivable and a $7.5 million decrease in trade accounts payable.
increase in accounts receivable and a $7.5 million decrease in trade accounts payable.
• Inventory increased $2.8 million primarily related to timing of inventory purchases and customer
deliveries.
deliveries.
($ in millions)
Working Capital

Company Confidential
33
Balance Sheet Management
Strong balance sheet coupled
with operating leverage allows us
to fund our strategic initiatives
with operating leverage allows us
to fund our strategic initiatives
No debt
Strong cash
balance
balance
Quality receivables
Balanced
inventories
inventories
Managed payables

Company Confidential
34
($ millions)
* Net income is inclusive of the estimated fully-burdened tax rate in a range of 31-38% depending on the period.
- The company’s current NOLs of $65 million reduce the cash taxes to the portion relating to the non-U.S. obligations.
This target model is not intended to constitute financial guidance related to the company’s expected performance. It is based upon management’s current
expectations concerning future events and trends and is necessarily subject to uncertainties.
expectations concerning future events and trends and is necessarily subject to uncertainties.
Long-Term Target Operating Model

Company Confidential
35
Well-Positioned For the Long Term

May 3 2011
www.3dsystems.com NASDAQ:TDSC
Thank You