Attached files
| file | filename |
|---|---|
| 8-K - DEX ONE CORPORATION 8-K - DEX ONE Corp | a6702875.htm |
| EX-99.1 - EXHIBIT 99.1 - DEX ONE Corp | a6702875ex99_1.htm |
Exhibit 99.2
First Quarter 2011 Results Information Package May 2, 2011
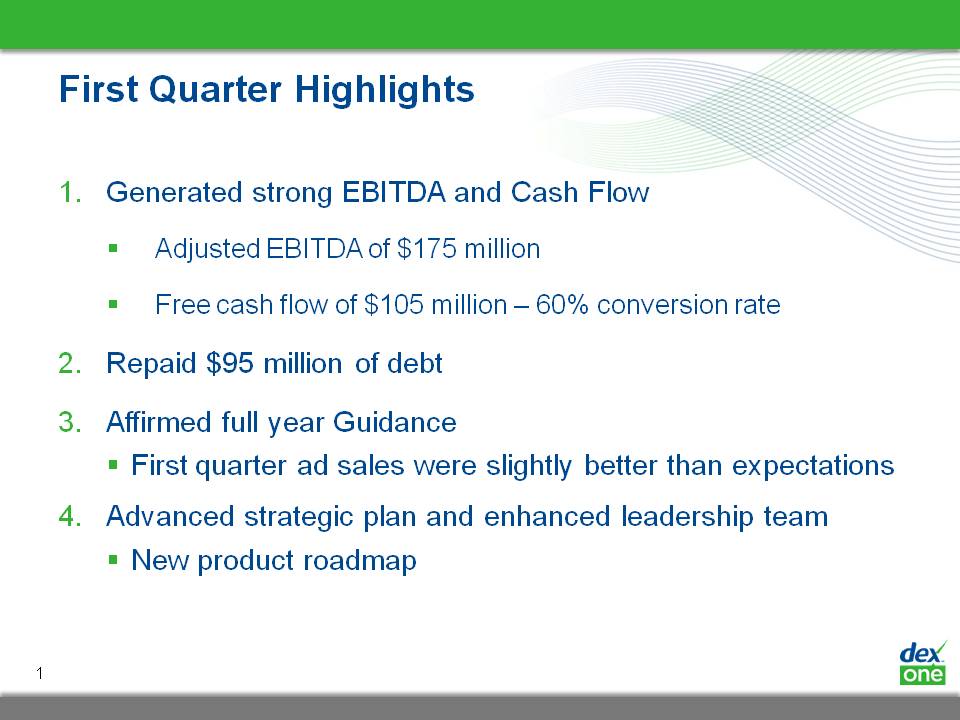
First Quarter Highlights Generated strong EBITDA and Cash FlowAdjusted EBITDA of $175 millionFree cash flow of $105 million – 60% conversion rateRepaid $95 million of debtAffirmed full year GuidanceFirst quarter ad sales were slightly better than expectationsAdvanced strategic plan and enhanced leadership teamNew product roadmap 1
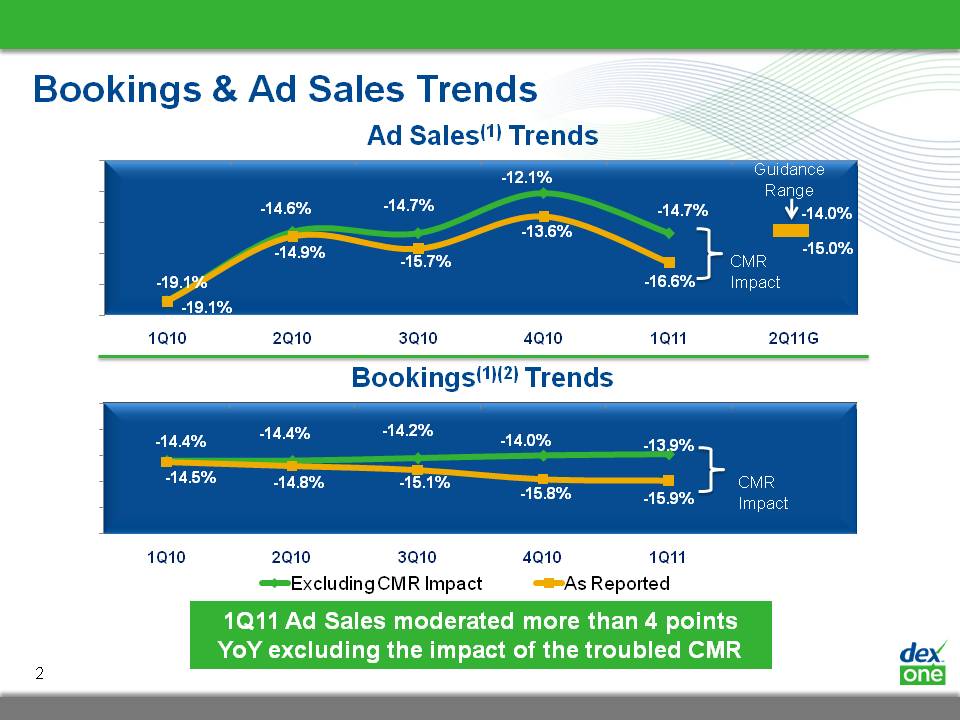
2 Bookings & Ad Sales Trends Ad Sales(1) Trends CMR Impact Bookings(1)(2) Trends 1Q11 Ad Sales moderated more than 4 points YoY excluding the impact of the troubled CMR CMR Impact -14.0% -15.0% Guidance Range
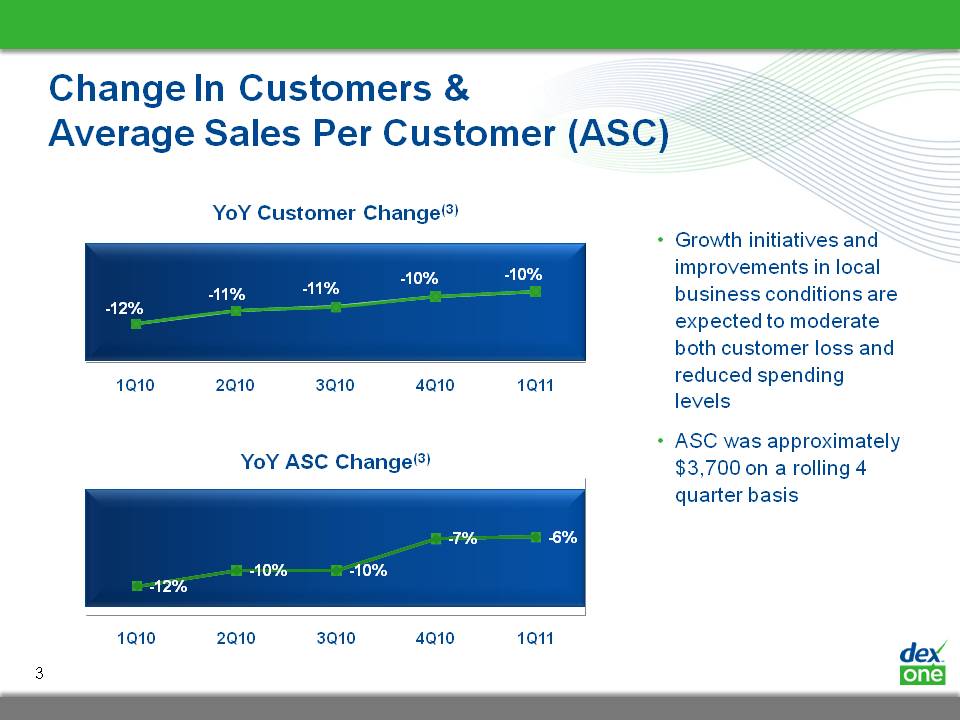
Change In Customers & Average Sales Per Customer (ASC) 3 YoY Customer Change(3) Growth initiatives and improvements in local business conditions are expected to moderate both customer loss and reduced spending levelsASC was approximately $3,700 on a rolling 4 quarter basis YoY ASC Change(3)
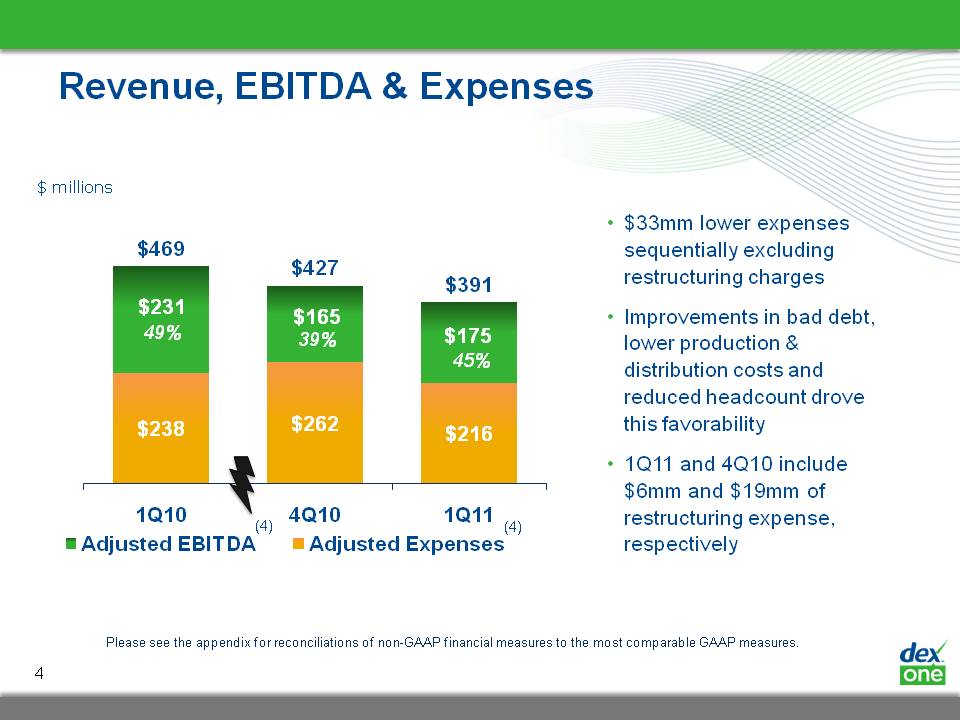
Revenue, EBITDA & Expenses 4 $33mm lower expenses sequentially excluding restructuring chargesImprovements in bad debt, lower production & distribution costs and reduced headcount drove this favorability1Q11 and 4Q10 include $6mm and $19mm of restructuring expense, respectively 49% 39% 45% (4) (4) Please see the appendix for reconciliations of non-GAAP financial measures to the most comparable GAAP measures. $ millions
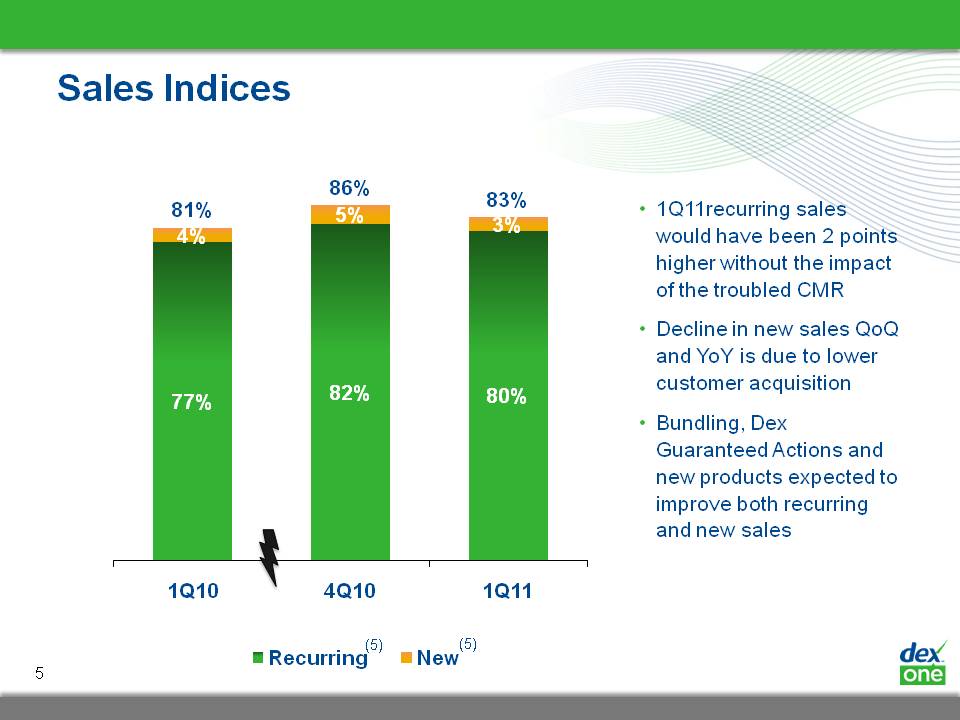
Sales Indices 5 1Q11recurring sales would have been 2 points higher without the impact of the troubled CMRDecline in new sales QoQ and YoY is due to lower customer acquisitionBundling, Dex Guaranteed Actions and new products expected to improve both recurring and new sales (5) (5)
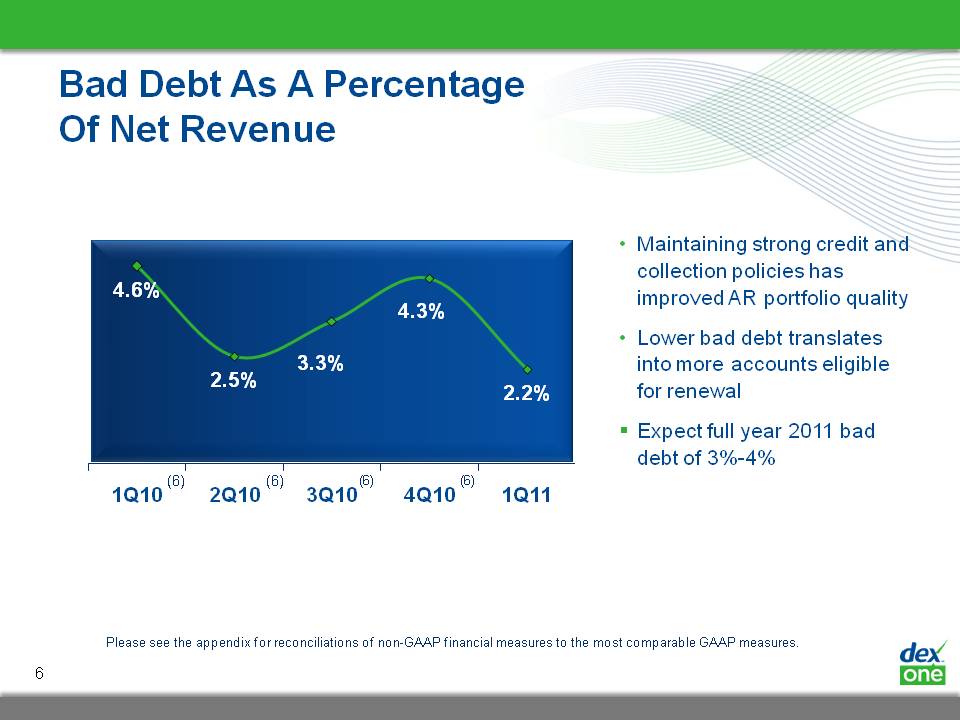
Bad Debt As A Percentage Of Net Revenue Maintaining strong credit and collection policies has improved AR portfolio qualityLower bad debt translates into more accounts eligible for renewalExpect full year 2011 bad debt of 3%-4% (6) (6) 6 Please see the appendix for reconciliations of non-GAAP financial measures to the most comparable GAAP measures.
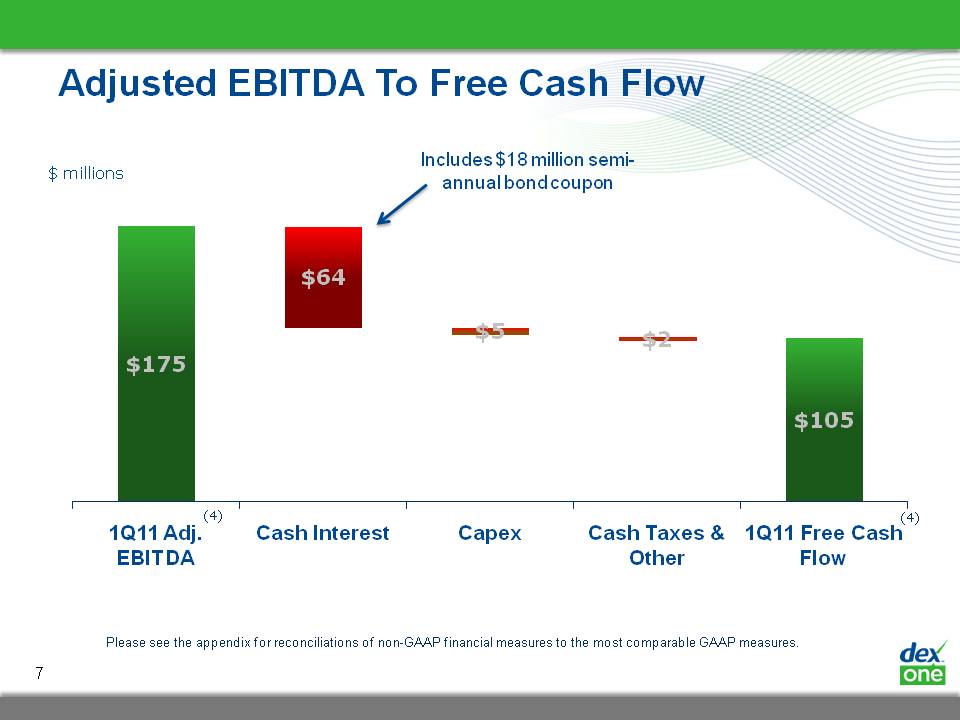
Adjusted EBITDA To Free Cash Flow $ millions (4) (4) Please see the appendix for reconciliations of non-GAAP financial measures to the most comparable GAAP measures. Includes $18 million semi-annual bond coupon 7
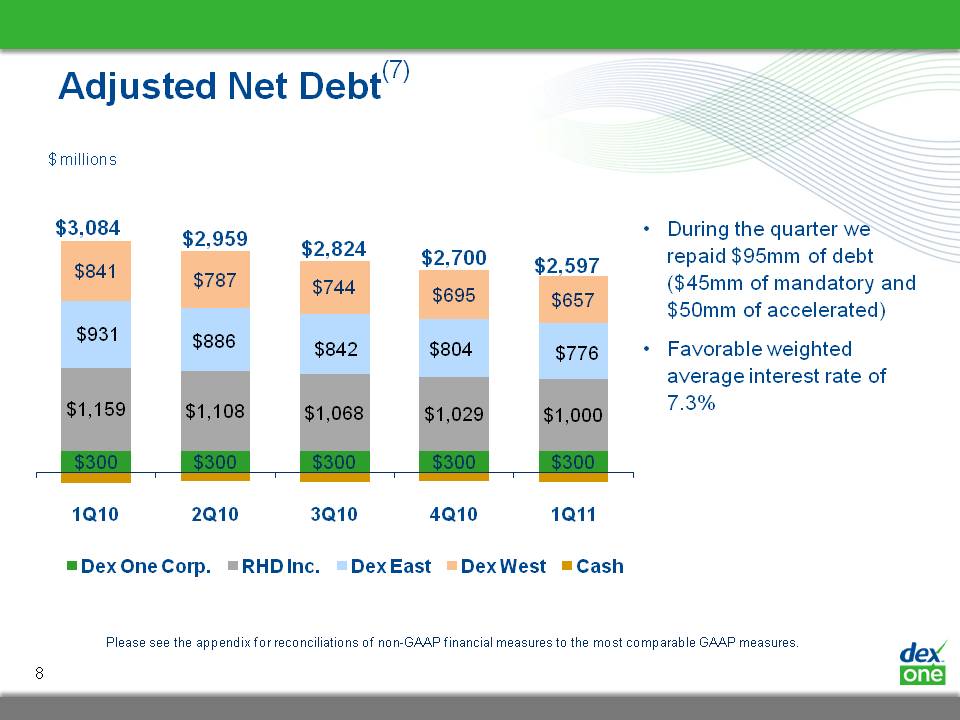
$ millions Adjusted Net Debt(7) During the quarter we repaid $95mm of debt ($45mm of mandatory and $50mm of accelerated)Favorable weighted average interest rate of 7.3% Please see the appendix for reconciliations of non-GAAP financial measures to the most comparable GAAP measures.
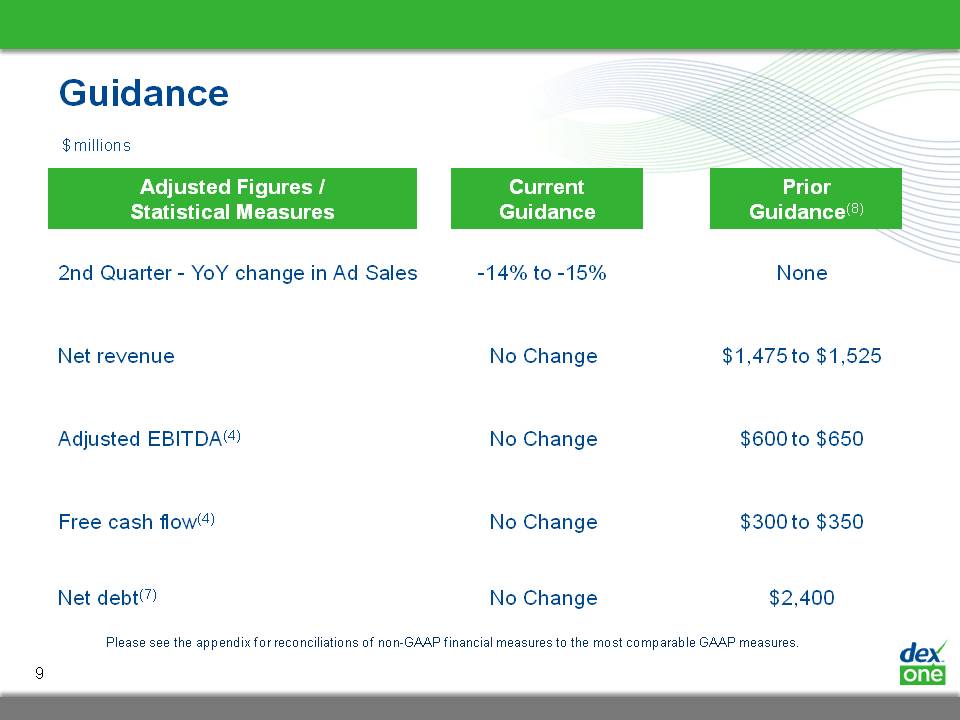
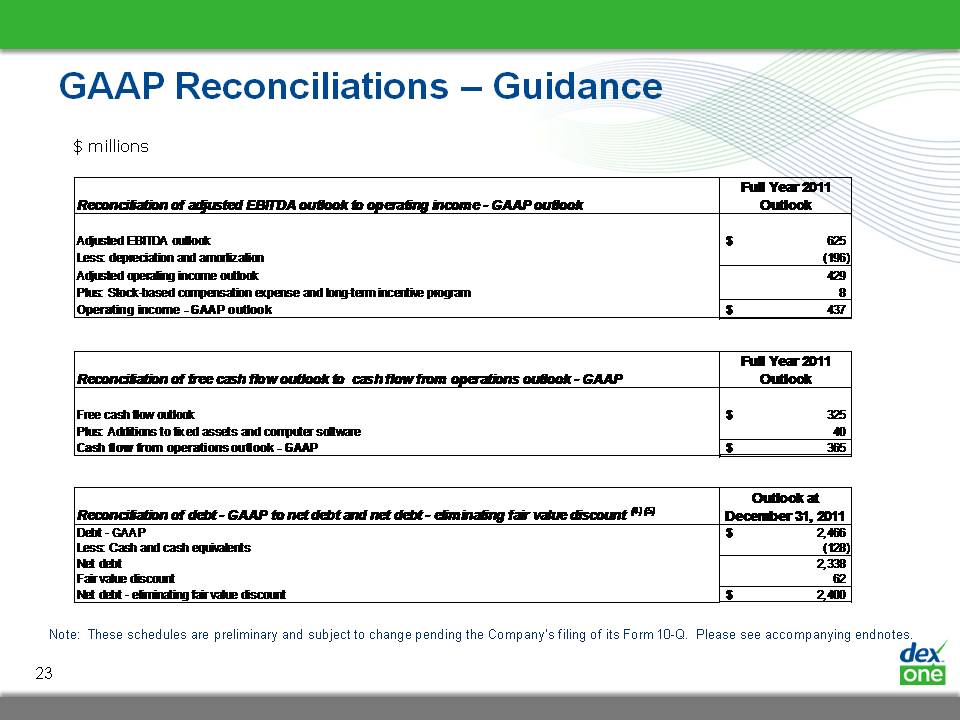
Guidance 2nd Quarter - YoY change in Ad Sales -14% to -15% None Net revenue No Change $1,475 to $1,525 Adjusted EBITDA(4) No Change $600 to $650 Free cash flow(4) No Change $300 to $350Net debt(7) No Change $2,400 Prior Guidance(8) Adjusted Figures / Statistical Measures Current Guidance Please see the appendix for reconciliations of non-GAAP financial measures to the most comparable GAAP measures.
Safe Harbor Statement Certain statements contained in this presentation regarding Dex One Corporation’s future operating results, performance, business plans, prospects, guidance and any other statements not constituting historical fact are “forward-looking statements” subject to the safe harbor created by the Private Securities Litigation Reform Act of 1995. Where possible, the words “believe,” “expect,” “anticipate,” “intend,” “should,” “will,” “would,” “planned,” “estimated,” “potential,” “goal,” “outlook,” “may,” “predicts,” “could,” or the negative of such terms, or other comparable expressions, as they relate to Dex One Corporation or its management, have been used to identify such forward-looking statements. All forward-looking statements reflect only Dex One Corporation’s current beliefs and assumptions with respect to future business plans, prospects, decisions and results, and are based on information currently available to Dex One Corporation. Accordingly, the statements are subject to significant risks, uncertainties and contingencies, which could cause Dex One Corporation’s actual operating results, performance or business plans or prospects to differ materially from those expressed in, or implied by, these statements.Factors that could cause actual results to differ materially from current expectations include risks and other factors described in Dex One Corporation’s publicly available reports filed with the SEC, which contain a discussion of various factors that may affect Dex One Corporation’s business or financial results. Such risks and other factors, which in some instances are beyond Dex One Corporation’s control, include: the continuing decline in the use of print directories; increased competition, particularly from existing and emerging online technologies; ongoing weak economic conditions and continued decline in advertising sales; our ability to collect trade receivables from customers to whom we extend credit; our ability to generate sufficient cash to service our debt; our ability to comply with the financial covenants contained in our debt agreements and the potential impact to operations and liquidity as a result of restrictive covenants in such debt agreements; our ability to refinance or restructure our debt on reasonable terms and conditions as might be necessary from time to time; increasing interest rates; changes in the company’s and the company’s subsidiaries credit ratings; changes in accounting standards; regulatory changes and judicial rulings impacting our business; adverse results from litigation, governmental investigations or tax related proceedings or audits; the effect of labor strikes, lock-outs and negotiations; successful realization of the expected benefits of acquisitions, divestitures and joint ventures; our ability to maintain agreements with Qwest, CenturyLink and AT&T and other major Internet search and local media companies; our reliance on third-party vendors for various services; and other events beyond our control that may result in unexpected adverse operating results. Dex One Corporation is not responsible for updating the information contained in this presentation beyond the published date, or for changes made to this document by wire services or Internet service providers. This presentation is being furnished to the SEC through a Form 8-K. The Company’s Quarterly Report on Form 10-Q for the period ended March 31, 2011 to be filed with the SEC may contain updates to the information included in this presentation.We reference non-GAAP financial measures in this presentation. Please see the appendix for a reconciliation of non-GAAP measures to the most comparable GAAP measures.
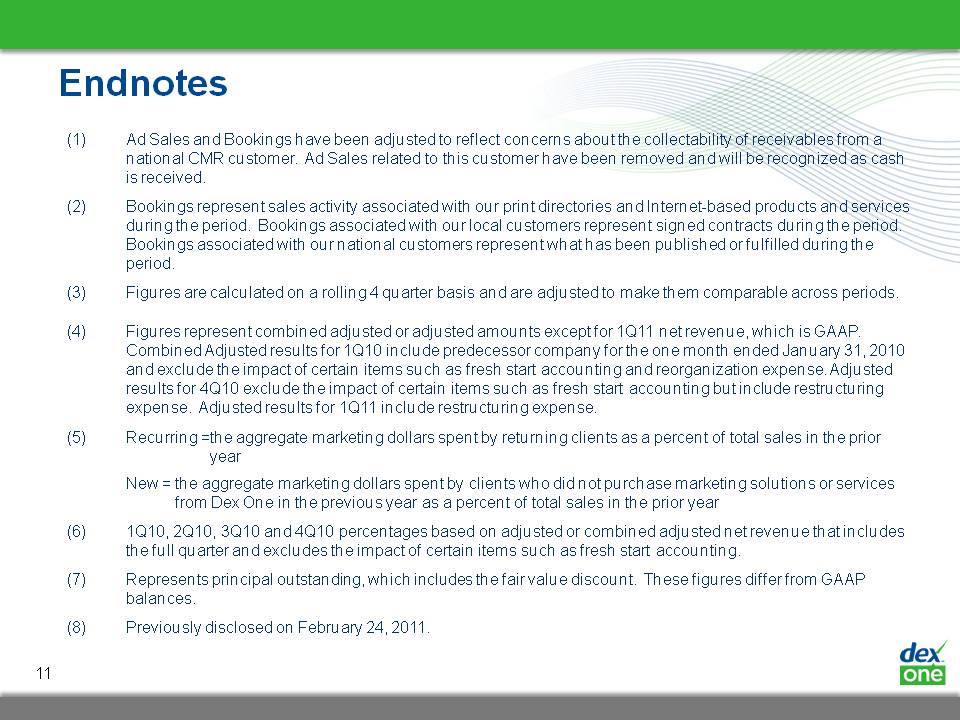
Endnotes
APPENDIX
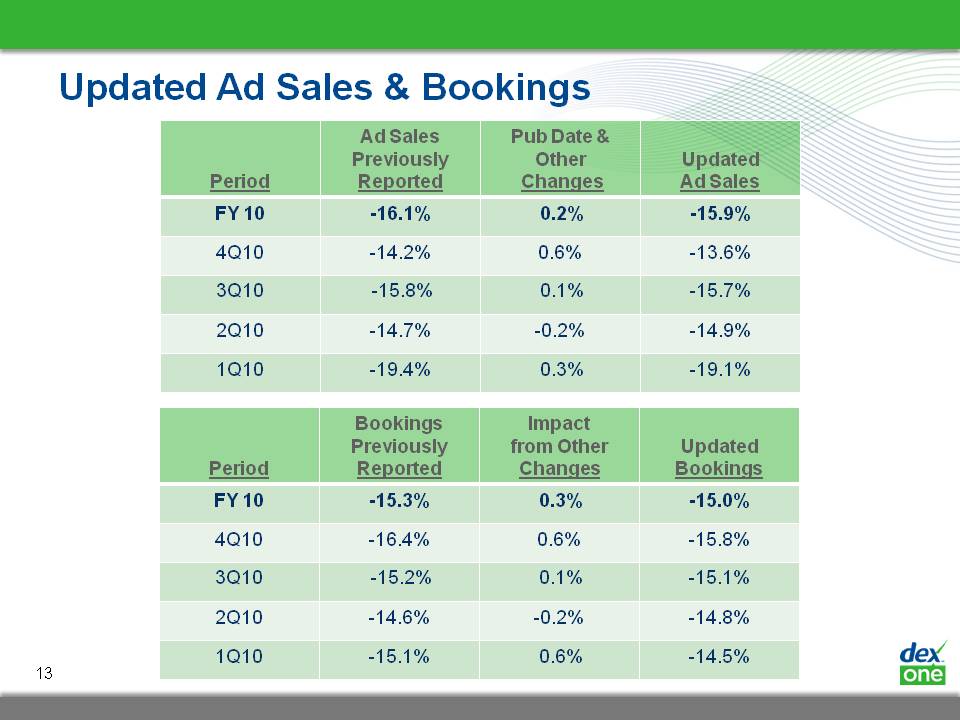
Updated Ad Sales & Bookings
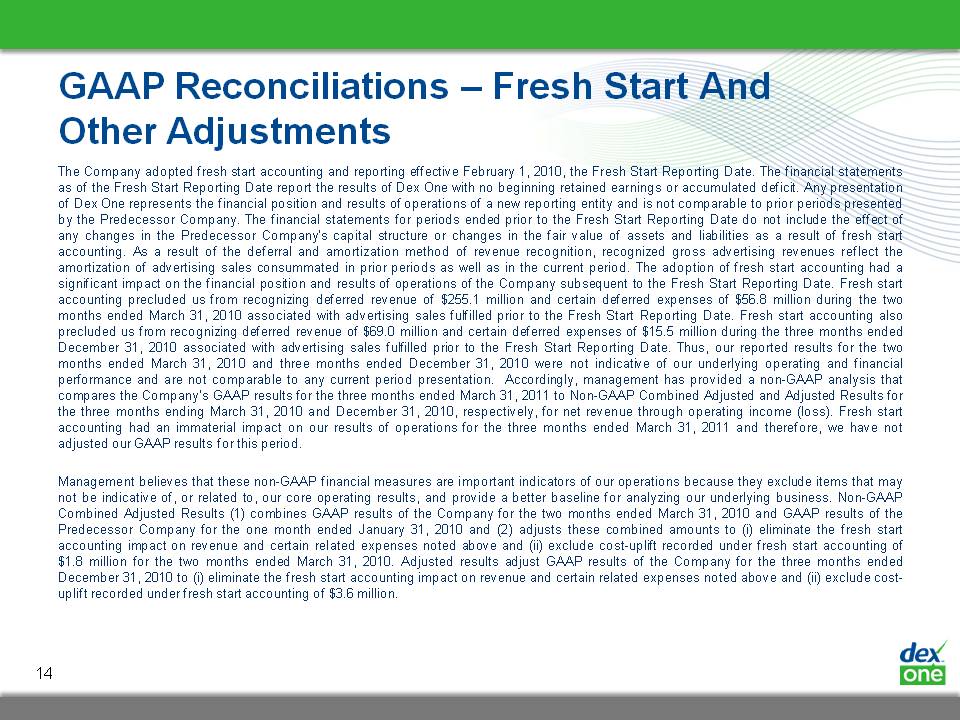
GAAP Reconciliations – Fresh Start And Other Adjustments The Company adopted fresh start accounting and reporting effective February 1, 2010, the Fresh Start Reporting Date. The financial statements as of the Fresh Start Reporting Date report the results of Dex One with no beginning retained earnings or accumulated deficit. Any presentation of Dex One represents the financial position and results of operations of a new reporting entity and is not comparable to prior periods presented by the Predecessor Company. The financial statements for periods ended prior to the Fresh Start Reporting Date do not include the effect of any changes in the Predecessor Company's capital structure or changes in the fair value of assets and liabilities as a result of fresh start accounting. As a result of the deferral and amortization method of revenue recognition, recognized gross advertising revenues reflect the amortization of advertising sales consummated in prior periods as well as in the current period. The adoption of fresh start accounting had a significant impact on the financial position and results of operations of the Company subsequent to the Fresh Start Reporting Date. Fresh start accounting precluded us from recognizing deferred revenue of $255.1 million and certain deferred expenses of $56.8 million during the two months ended March 31, 2010 associated with advertising sales fulfilled prior to the Fresh Start Reporting Date. Fresh start accounting also precluded us from recognizing deferred revenue of $69.0 million and certain deferred expenses of $15.5 million during the three months ended December 31, 2010 associated with advertising sales fulfilled prior to the Fresh Start Reporting Date. Thus, our reported results for the two months ended March 31, 2010 and three months ended December 31, 2010 were not indicative of our underlying operating and financial performance and are not comparable to any current period presentation. Accordingly, management has provided a non-GAAP analysis that compares the Company’s GAAP results for the three months ended March 31, 2011 to Non-GAAP Combined Adjusted and Adjusted Results for the three months ending March 31, 2010 and December 31, 2010, respectively, for net revenue through operating income (loss). Fresh start accounting had an immaterial impact on our results of operations for the three months ended March 31, 2011 and therefore, we have not adjusted our GAAP results for this period. Management believes that these non-GAAP financial measures are important indicators of our operations because they exclude items that may not be indicative of, or related to, our core operating results, and provide a better baseline for analyzing our underlying business. Non-GAAP Combined Adjusted Results (1) combines GAAP results of the Company for the two months ended March 31, 2010 and GAAP results of the Predecessor Company for the one month ended January 31, 2010 and (2) adjusts these combined amounts to (i) eliminate the fresh start accounting impact on revenue and certain related expenses noted above and (ii) exclude cost-uplift recorded under fresh start accounting of $1.8 million for the two months ended March 31, 2010. Adjusted results adjust GAAP results of the Company for the three months ended December 31, 2010 to (i) eliminate the fresh start accounting impact on revenue and certain related expenses noted above and (ii) exclude cost-uplift recorded under fresh start accounting of $3.6 million.
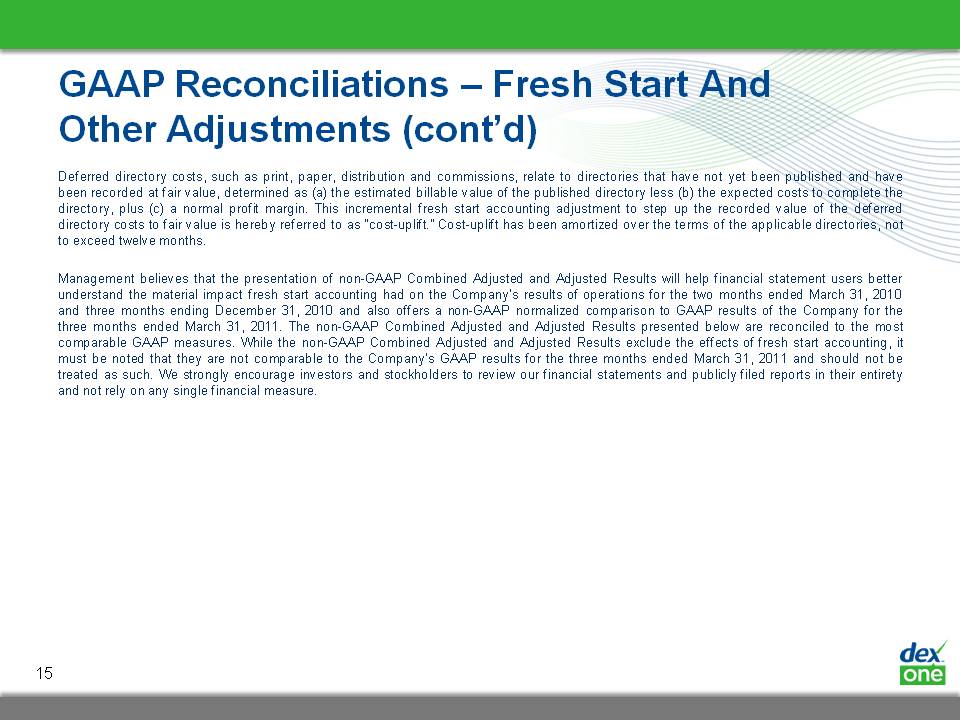
GAAP Reconciliations – Fresh Start And Other Adjustments (cont’d) Other Placeholder: Deferred directory costs, such as print, paper, distribution and commissions, relate to directories that have not yet been published and have been recorded at fair value, determined as (a) the estimated billable value of the published directory less (b) the expected costs to complete the directory, plus (c) a normal profit margin. This incremental fresh start accounting adjustment to step up the recorded value of the deferred directory costs to fair value is hereby referred to as “cost-uplift.” Cost-uplift has been amortized over the terms of the applicable directories, not to exceed twelve months.Management believes that the presentation of non-GAAP Combined Adjusted and Adjusted Results will help financial statement users better understand the material impact fresh start accounting had on the Company’s results of operations for the two months ended March 31, 2010 and three months ending December 31, 2010 and also offers a non-GAAP normalized comparison to GAAP results of the Company for the three months ended March 31, 2011. The non-GAAP Combined Adjusted and Adjusted Results presented below are reconciled to the most comparable GAAP measures. While the non-GAAP Combined Adjusted and Adjusted Results exclude the effects of fresh start accounting, it must be noted that they are not comparable to the Company’s GAAP results for the three months ended March 31, 2011 and should not be treated as such. We strongly encourage investors and stockholders to review our financial statements and publicly filed reports in their entirety and not rely on any single financial measure.
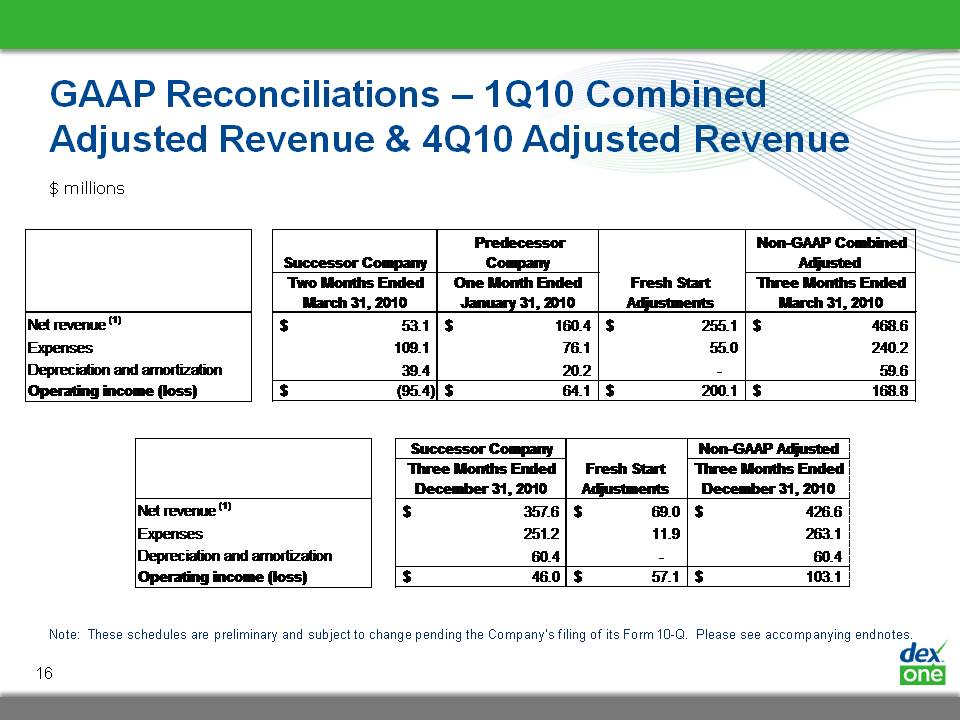
GAAP Reconciliations – 1Q10 Combined Adjusted Revenue & 4Q10 Adjusted Revenue $ millions Note: These schedules are preliminary and subject to change pending the Company's filing of its Form 10-Q. Please see accompanying endnotes.
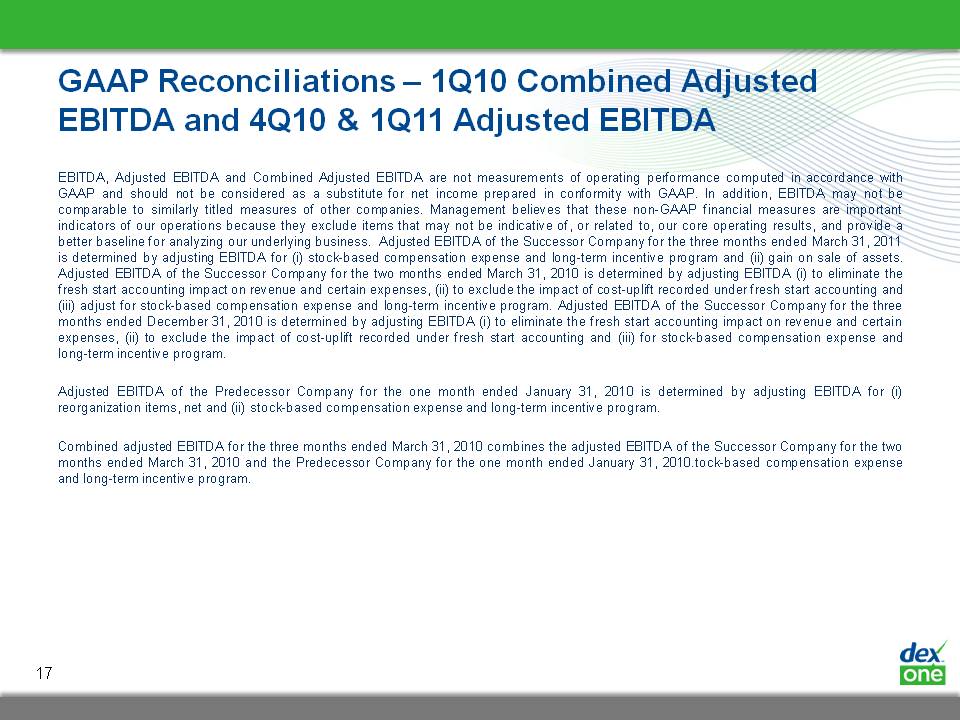
GAAP Reconciliations – 1Q10 Combined Adjusted EBITDA and 4Q10 & 1Q11 Adjusted EBITDA EBITDA, Adjusted EBITDA and Combined Adjusted EBITDA are not measurements of operating performance computed in accordance with GAAP and should not be considered as a substitute for net income prepared in conformity with GAAP. In addition, EBITDA may not be comparable to similarly titled measures of other companies. Management believes that these non-GAAP financial measures are important indicators of our operations because they exclude items that may not be indicative of, or related to, our core operating results, and provide a better baseline for analyzing our underlying business. Adjusted EBITDA of the Successor Company for the three months ended March 31, 2011 is determined by adjusting EBITDA for (i) stock-based compensation expense and long-term incentive program and (ii) gain on sale of assets. Adjusted EBITDA of the Successor Company for the two months ended March 31, 2010 is determined by adjusting EBITDA (i) to eliminate the fresh start accounting impact on revenue and certain expenses, (ii) to exclude the impact of cost-uplift recorded under fresh start accounting and (iii) adjust for stock-based compensation expense and long-term incentive program. Adjusted EBITDA of the Successor Company for the three months ended December 31, 2010 is determined by adjusting EBITDA (i) to eliminate the fresh start accounting impact on revenue and certain expenses, (ii) to exclude the impact of cost-uplift recorded under fresh start accounting and (iii) for stock-based compensation expense and long-term incentive program. Adjusted EBITDA of the Predecessor Company for the one month ended January 31, 2010 is determined by adjusting EBITDA for (i) reorganization items, net and (ii) stock-based compensation expense and long-term incentive program. Combined adjusted EBITDA for the three months ended March 31, 2010 combines the adjusted EBITDA of the Successor Company for the two months ended March 31, 2010 and the Predecessor Company for the one month ended January 31, 2010.tock-based compensation expense and long-term incentive program.
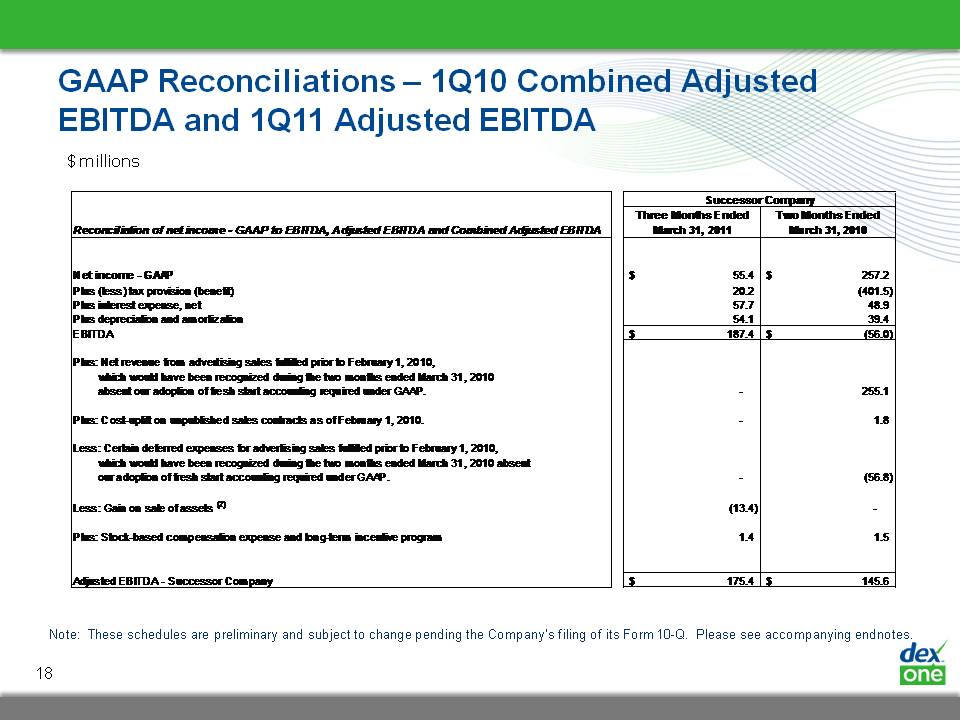
GAAP Reconciliations – 1Q10 Combined Adjusted EBITDA and 1Q11 Adjusted EBITDA Note: These schedules are preliminary and subject to change pending the Company's filing of its Form 10-Q. Please see accompanying endnotes. Slide: 20 $ millions
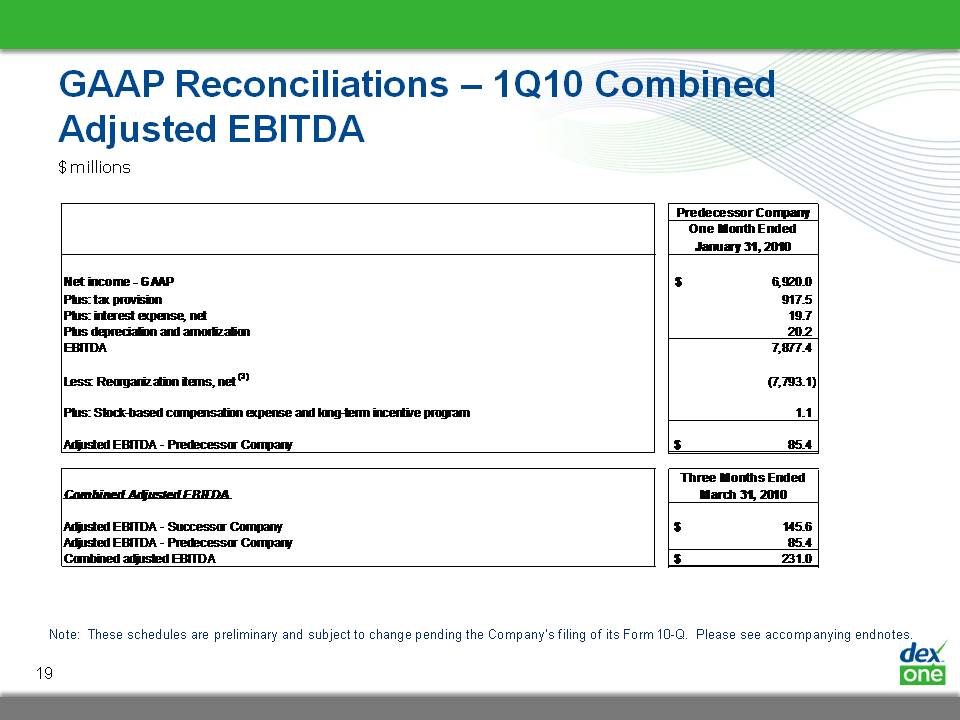
GAAP Reconciliations – 1Q10 Combined Adjusted EBITDA Note: These schedules are preliminary and subject to change pending the Company's filing of its Form 10-Q. Please see accompanying endnotes.
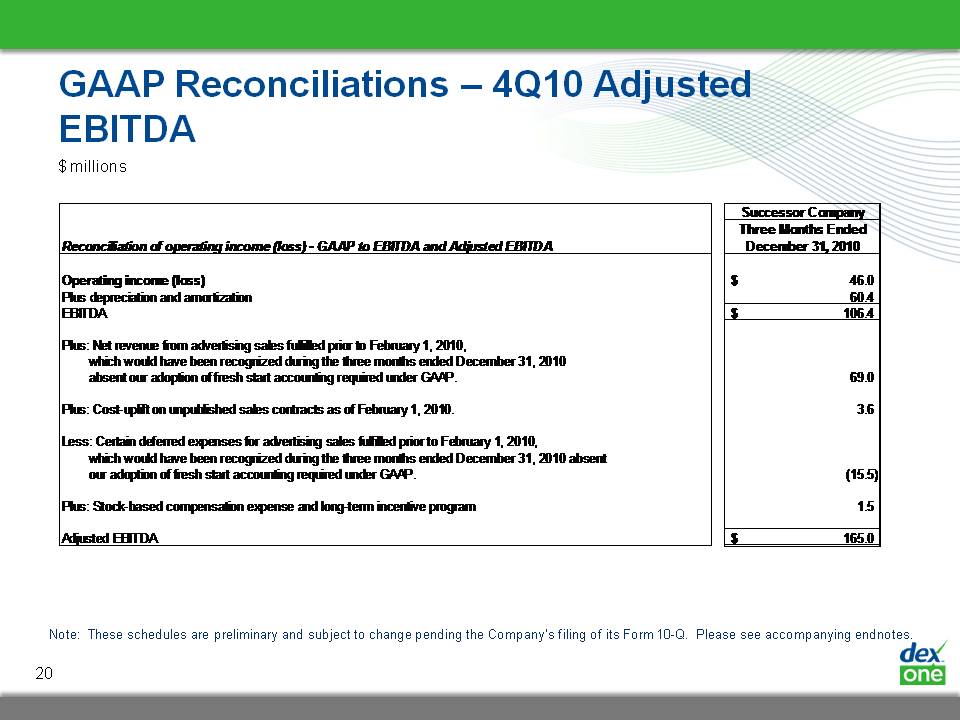
GAAP Reconciliations – 4Q10 Adjusted EBITDA Note: These schedules are preliminary and subject to change pending the Company's filing of its Form 10-Q. Please see accompanying endnotes.
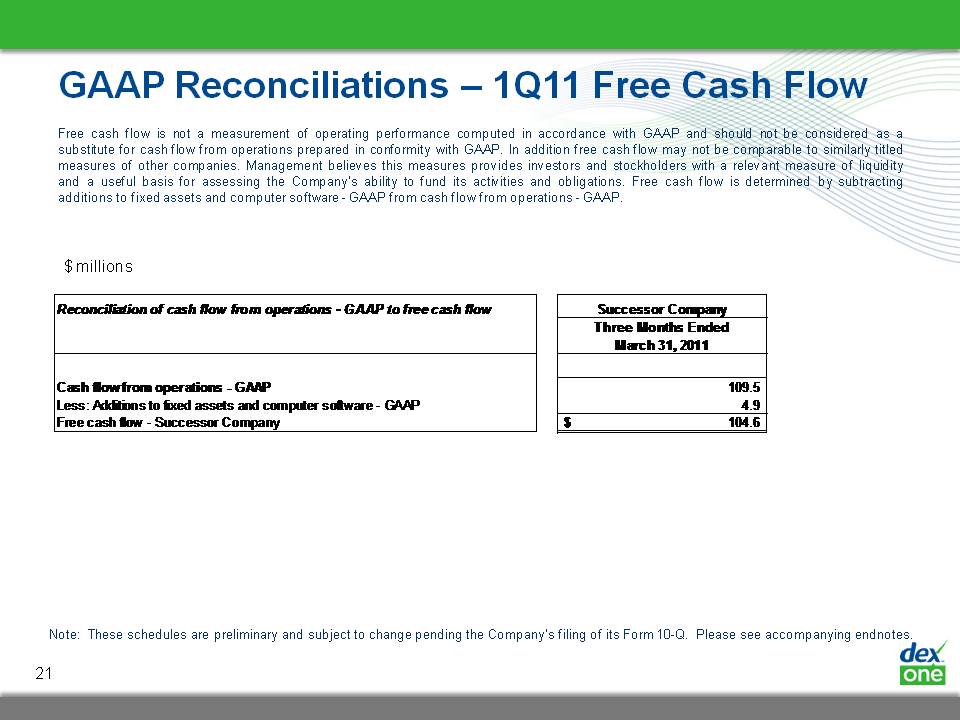
GAAP Reconciliations – 1Q11 Free Cash Flow Free cash flow is not a measurement of operating performance computed in accordance with GAAP and should not be considered as a substitute for cash flow from operations prepared in conformity with GAAP. In addition free cash flow may not be comparable to similarly titled measures of other companies. Management believes this measures provides investors and stockholders with a relevant measure of liquidity and a useful basis for assessing the Company's ability to fund its activities and obligations. Free cash flow is determined by subtracting additions to fixed assets and computer software - GAAP from cash flow from operations - GAAP.
$ millions Note: These schedules are preliminary and subject to change pending the Company's filing of its Form 10-Q. Please see accompanying endnotes.
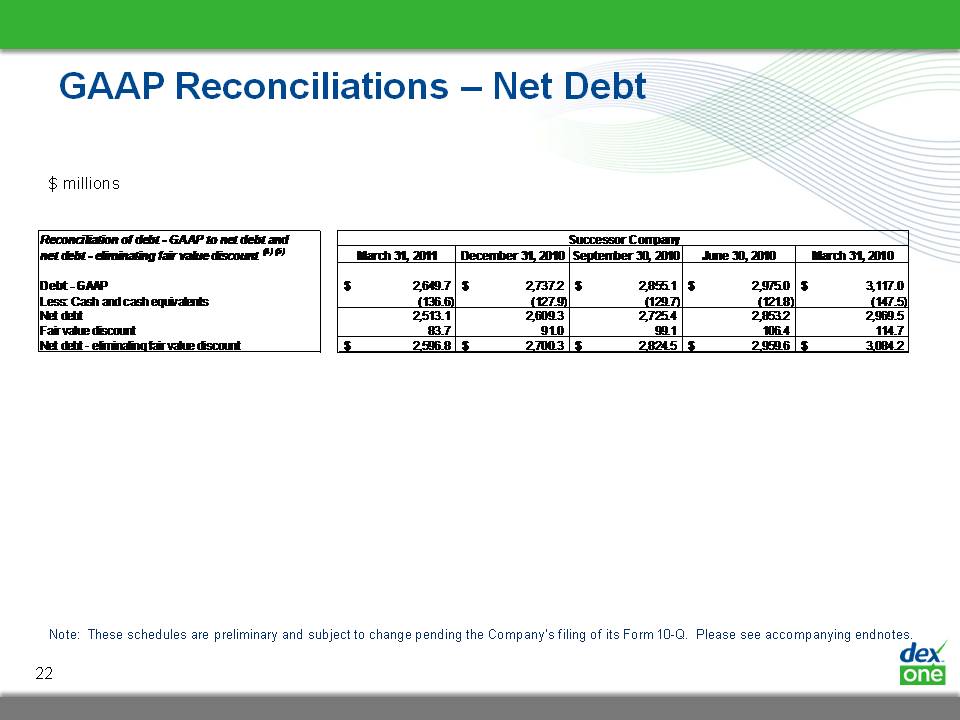
GAAP Reconciliations – Net Debt $ millions Note: These schedules are preliminary and subject to change pending the Company's filing of its Form 10-Q. Please see accompanying endnotes.
Reconciliation Endnotes Our advertising revenues are earned primarily from the sale of advertising in yellow pages directories we publish. Advertising revenues also include revenues from our Internet-based marketing solutions including online directories, such as DexKnows.com and DexNet. Advertising revenues are affected by several factors, including changes in the quantity and size of advertisements, acquisition of new clients, renewal rates of existing clients, premium advertisements sold, changes in advertisement pricing, the introduction of new marketing solutions, an increase in competition and more fragmentation in the local business search market and general economic factors. Revenues with respect to print advertising and Internet-based marketing solutions that are sold with print advertising are recognized under the deferral and amortization method whereby revenues are initially deferred when a directory is published, net of sales claims and allowances, and recognized ratably over the directory’s life, which is typically 12 months. Revenues with respect to Internet-based marketing solutions that are sold standalone, such as DexNet, are recognized ratably over the life of the contract commencing when they are first delivered or fulfilled. Revenues with respect to our marketing solutions that are non-performance based are recognized ratably over the life of the contract commencing when they are first delivered or fulfilled. Revenues with respect to our marketing solutions that are performance-based are recognized as the service is delivered or fulfilled.On February 14, 2011, we completed the sale of substantially all net assets of Business.com. As a result, we recognized a gain on sale of these assets of $13.4 million during the three months ended March 31, 2011. Reorganization items directly associated with the process of reorganizing the business under Chapter 11 of the Bankruptcy Code were recorded on a separate line item on the unaudited condensed consolidated statements of operations. The Predecessor Company had recorded $7.8 billion of reorganization items during the one month ended January 31, 2010 associated with the gain on reorganization/settlement of liabilities subject to compromise and the impact of fresh start accounting adjustments. In conjunction with our adoption of fresh start accounting, an adjustment was established to record our outstanding debt at fair value on the Fresh Start Reporting Date. The Company was required to record our amended and restated credit facilities at a discount as a result of their fair value on the Fresh Start Reporting Date. Therefore, the carrying amount of these debt obligations is lower than the principal amount due at maturity. This fair value adjustment is amortized as an increase to interest expense over the remaining term of the respective debt agreements and does not impact future scheduled interest or principal payments. The unamortized fair value adjustment resulting from fresh start accounting was $83.7 million at March 31, 2011. Net debt represents total debt less cash and cash equivalents on the respective date. Net debt – eliminating fair value discount eliminates the fair value discount as a result of fresh start accounting described in Note 4 and represents principal amounts due at maturity. 24 Note: These schedules are preliminary and subject to change pending the Company's filing of its Form 10-Q.