Attached files
| file | filename |
|---|---|
| 8-K - 8-K - HERC HOLDINGS INC | a11-11171_18k.htm |
Exhibit 99.1
|
|
1Q 2011 Earnings Call April 27, 2011 10:00 am ET Dial in: (800) 288-8967 (US) (612) 332-0342 (International) Passcode: 199009 |

|
|
Safe Harbor Statement Certain statements made within this presentation contain forward-looking statements, within the meaning of the Private Securities Litigation Reform Act of 1995. Forward-looking statements are not guarantees of performance and by their nature are subject to inherent uncertainties. Actual results may differ materially. Any forward-looking information relayed in this presentation speaks only as of April 27, 2011, and the Company undertakes no obligation to update that information to reflect changed circumstances. Additional information concerning these statements is contained in the Company’s press release regarding its First Quarter 2011 results issued on April 26, 2011, and the Risk Factors and Forward-Looking Statements sections of the Company’s 2010 Form 10-K. Copies of these filings are available from the SEC, the Hertz web site or the Company’s Investor Relations Department. |

|
|
Definitions and reconciliations of these non-GAAP measures are provided at the end of the presentation. The following non-GAAP measures will be used in the presentation: Non-GAAP Measures EBITDA Corporate EBITDA Adjusted Pre-Tax Income Adjusted Net Income Adjusted Diluted Earnings Per Share (Adjusted EPS) Net Corporate Debt Net Fleet Debt Total Net Debt Adjusted Interest Expense Adjusted Direct Operating Expense Adjusted Selling, General and Administrative Adjusted Depreciation of Revenue Earning Equipment Levered After-Tax Cash-Flow Before Fleet Growth Corporate Cash Flow |

|
|
First Quarter 2011 Results Mark Frissora, Chairman and CEO Financial & Operating Results Overview Elyse Douglas, Executive VP and CFO Outlook & Guidance Mark Frissora, Chairman and CEO Questions & Answers Session Today’s Agenda |

|
|
Opening Comments |

|
|
Despite $15 mil revenue impact from winter storms in Jan/Feb: U.S. RAC revenue up 3.6%; fleet up <1%, volume up 4.4% Improved pricing in Europe rental car despite economic volatility France, U.K., Spain Double-digit volume increase in equipment rental Refinanced $3.4B ABL & term loan, and $1B senior note First Quarter 2011 Review GAAP Q1:11 Results Q1:10 Results YoY Change Revenue $1,780.0 $1,660.9 7.2% Loss before income taxes ($158.9) ($157.8) (0.7)% Loss per share ($0.32) ($0.37) 13.5% Non-GAAP* Corporate EBITDA $166.4 $121.4 37.1% Adjusted Pre-Tax ($16.0) (69.2) 76.9% Adjusted EPS ($0.03) ($0.12) 75.0% ($ in millions, except per share amounts) * Definitions and reconciliations of these non-GAAP measures are provided at the end of the presentation. |

|
|
Q1:11 U.S. RAC Total Revenue +3.6% YoY Rev. +$35.8 million Total Revenue ($ in millions) 35.0% 84.9% (19.9%) % of total increase Airport Advantage Off-Airport % Change in Total Revenue On-Airport 74.3% of U.S. RAC Revenue Off-Airport 25.7% of U.S. RAC Revenue RPD * YoY Δ% $57.57 +0.8% $37.76 -3.6% $36.07 +1.5% Trans Days -1.8% +47.7% +11.5% % of Total U.S. RAC Revenue 70.2% 4.1% 25.7% U.S. RAC Growth Drivers Q1:11 vs. Q1:10 Note: Advantage RAC acquired April 2009 Advantage $12.5 Off Airport $30.4 Airport ($7.1) * RPD calculated using Total Revenue |

|
|
U.S. Off Airport (OAP) – leisure, local business, monthly, insurance replacement Opened 35 net new locations, +9%; Total locations = 1,963 Total OAP revenue +13.1%; same-store-revenue up 12.4% Low-cost infrastructure, minimum overhead, more economical vehicles, and longer-length rentals Worldwide Advantage brand revenue +$14.1 mil YoY to $43.7 mil 7 locations added in Q1:11; Total: 53 locations and 14 affiliates worldwide U.S. airport revenue from Inbound foreign travelers +5.5% YoY RAC GROWTH INITIATIVES |

|
|
2011 COST SAVINGS Efficiency & cost management programs continue Cost savings of $83 million achieved Q1:11 through efficiency programs FY2011 revised goal = $325 million Lean/Six Sigma “Lighthouse” programs at major airport locations and equipment rental branches: Completed in Q1:11 = NA RAC: 2, International: 8, HERC: 10 Completed since inception = NA RAC: 15, International RAC: 10, HERC: 13 Q1:11 YoY Δ U.S RAC +6.0% EU RAC + 8.2% WW HERC +2.5% Revenue Per Employee* (at constant currency) +29.8% since 2006 Cost Savings |

|
|
U.S. RAC Residual Values U.S. residual values hit Q1 record levels Tight supply of previously leased vehicles in used car market Lower OEM production levels Higher mix of risk vehicles More profitable remarketing channels Monthly Depreciation per Vehicle Age-Adjusted Residual Values* *Using 2007 avg. age as base year |

|
|
Increasing use of non-auction sales channels U.S. wholesale auction sales 32% of total Q1:11 down from 85% in FY07 Dealer-direct now 45% of all U.S. risk car sales vs. 2% in FY07 +90% from Q1:10 Retail / online auction/ Rent2buy - cars on rent up until the day purchased Expect licensing in 37 states (optimal) by Sept. 2011 for hertzrent2buy.com Licensed in 30 states today Q1:11 Remarketing Strategy Q1:11 US Risk Car Sales Channels Wholesale Auction 32% Alternative Channels 68% Retail 7% HertzRent2Buy.com 5% Dealer Direct 45% Online Auction 11% Total 100% Auction 32% Alternative 68% |

|
|
RAC Fleet Efficiency Fleet efficiency: % of days car is rented compared with avg. number vehicles available to rent. Formula: ((Annualized Transaction Days / 365) / Average Fleet)) Highest Q1 in U.S. post IPO Leisure rentals avg 5-6 days Insur. replacement rentals avg 10 days Expansion of off-airport and Advantage network nationally, where rental length is extended Use of direct-to-dealer/direct-to-consumer sales channels keep cars on rent until point of sale Reduction in non-rentable cars due to efficiencies in maintenance and repair Rent-A-Car Fleet Efficiency |

|
|
Q1 2011 Performance |

|
|
Elyse Douglas CFO Financial Results Balance Sheet Review Cash Flow Review |

|
|
* Definitions and reconciliations of these non-GAAP measures are provided at the end of the presentation. Q1:11 Consolidated Financial Results GAAP Q1:11 Q1:10 $ Change Revenue $1,780 .0 $1,660.9 + $119.1 Loss before income taxes ($158.9) ($157.8) - $1.1 Net loss attributable to HGH ($132.6) ($150.4) + $17.8 Diluted loss per share ($0.32) ($0.37) + $0.05 Non-GAAP* Q1:11 Q1:10 $ Change Margin Expansion Adjusted Pre-Tax Loss ($16.0) ($69.2) + $53.2 330 bps Adjusted Net Loss ($14.2) ($49.3) + $35.1 220 bps Corporate EBITDA $166.4 $121.4 + $45.0 200 bps Adjusted EPS ($0.03) ($0.12) + $0.09 $ in millions, except per share calculation |

|
|
Rent-A-Car Metrics: Q1:11 vs. Q1:10 % of WW RAC total revenue Q1:11 vs. Q1:10 Total Revenue Rental Rate Revenue* Revenue Per Day (RPD) Trans. Days Revenue Per Transaction Transactions Trans Length (days) 68% U.S. (Hertz + Advantage) 3.6% 2.9% (1.5%) 4.4% 1.0% 1.8% 2.5% U.S. (Hertz Classic) 2.4% 1.8% (0.9%) 2.7% 1.7% 0.1% 2.6% 22% Europe 8.0% 6.7% 0.8% 5.8% 1.6% 5.0% 0.8% Worldwide 6.2% 4.4% (1.0%) 5.4% 1.4% 2.9% 2.5% *Rental rate revenue exclude the effects of foreign currency . Rental revenue consists of all revenue, net of discounts, associated with the rental of cars including charges for optional insurance products, but excludes revenue derived from fueling and concession and other expense pass-throughs, NeverLost units in the U.S. and certain ancillary revenue. Adjusted pre-tax income: +126.2%; 2011 margin 4.1%, +220 bps yoy Corporate EBITDA: +70.2%; 2011 margin 6.1%, +230 bps yoy |

|
|
U.S. Rent-A-Car RPD Incl. Ancillary Sales Note: includes Advantage Revenue Per Day (RPD) Reported RPD — time, mileage, insurance products Ancillary product/services - roadside svc, Neverlost, parking, tolls, etc. Fuel Services Fully Loaded RPD Q1:11 Q1:10 %Δ $41.34 $41.96 -1.5% $5.22 $5.17 $2.45 $2.25 $49.01 $49.38 -0.7% |

|
|
Worldwide Rent A Car Q1 WW RAC = 85% of total company revenue Worldwide RAC total revenue: $1.5 bil Fleet Mix 2011 2010 U.S. Risk % 77% 66% Europe Risk % 56% 58% Worldwide Risk % 73% 66% |

|
|
YoY Change in U.S. RAC Fleet Mix Strategically increasing mix of risk vehicles as we shift into more profitable resale channels |

|
|
Q1:11 U.S. RAC Performance Q1 2011 Q1 2010 Var to Q1:11 Peak Q1 2007 Var to Q1:11 Revenue $1,020.4 984.6 3.6% $1,081.2 (5.6%) $ in millions Revenue +3.6% vs. Q1:10, but still down from Q1:07 peak Total expenses down 490 bps YoY as % of revenues Q1:11 adj. pre-tax 40.8% better than Q1:10 with margin improvement of 220 bps Q1:11 vs. Q1:07, adj. pre-tax income +52.7%; margin +320 bps Monthly depreciation per vehicle down 16.5% vs. Q1:07 Corporate EBITDA +30.0% vs. Q1:10; margin +220 bps Net Promoter Score 290bps higher to 54.3 vs. Q1:10 Cost Savings Driving Profit Growth Over 2010 and Peak Year 2007 |

|
|
Q1:11 Europe RAC Performance Total revenue increased by 8.0% driven by: 5.8% higher volume 2.1% improvement in total revenue per day YoY 11.1% improvement in monthly fleet depreciation per unit Gained 29 new corporate accounts and re-signed 37 accounts with RPD gains of 1% to 5.5% NPS Score improved by 910bps YoY to 48.3 Achieved scores above 50 for first time in March |

|
|
Q1:11 HERC Operating Performance Revenue increased 13.2% in Q1:11 vs prior year Rental and rental related revenue +12.8% YoY 14.3% increase in volume Q1:11 YoY Industrial spending forecasted +20% by Industrial information Resources HERC industrial revenue +23% Time utilization* +830 bps to 58.3% vs. Q1:10 Adjusted pre-tax income of $10.2 mil vs. prior year loss of ($5.0 mil) Corporate EBITDA improved 14.4% YoY; margin improvement of +30bps *Time utilization: Calculated on unit average vs. weighted fleet cost basis 2009 2010 2011 |

|
|
Equipment Rental Pricing Calculations HERTZ Equipment Rental Competitor A Base fleet identified using current calendar year and prior calendar year Normalizes fleet mix & impact Average realized rates for 3 rate segments calculated separately (Month, Week, Day) Weighted average rate index created using base transactions (prior year) Rate segment (day,week,month) weighting applied to the average rate creating a weighted index Price performance based on variance between rate indexes Base Fleet Base fleet identified using current period and prior period Normalizes fleet mix & impact Average rates for 3 rate segments calculated (Month, Week, Day) Current vs. prior variance weighted on current year revenue(Qtr 1 2011) Calculations totaled for each rate segment Rate segment variances blended based on current period revenue against current vs. prior rate variance 3-Yr Pricing Performance 2008-2011 Using Competitor A price method: HERC +2.0% Q1:11 Source: company reports |

|
|
Q1:11 HERC Fleet Statistics WW HERC Fleet Size ($ in millions) WW HERC Fleet ($ in millions) Excludes FX Q1:11 Q1:10 Fleet Expenditures $171.6 $32.7 Disposal Proceeds $52.3 $31.3 Net Capital Expenditures $119.3 $1.4 (cash basis) Disposals $127.2 $67.5 (original equipment cost) Note: Above amounts are on a cash flow basis, consistent with our GAAP statement of cash flows. In past slide presentations we had provided this information including non-cash purchases and sales. |

|
|
HERC Growth Initiatives Equipment rental recovery being lead by industrial projects Executing roll-up acquisition strategy to build position in industrial market, expand geographic coverage and develop new revenue streams Expanded Entertainment Services with 2 new locations 1st international location: Paris Non-residential construction starting to show signs of activity Q1 11 FY 10 FY 09 FY 08 FY 07 Construction 35.1% 37.7% 43.5% 47.8% 50.2% Industrial 29.8% 27.7% 22.9% 21.6% 19.7% Fragmented 35.1% 34.6% 33.6% 30.6% 30.1% North America Revenue Diversification |

|
|
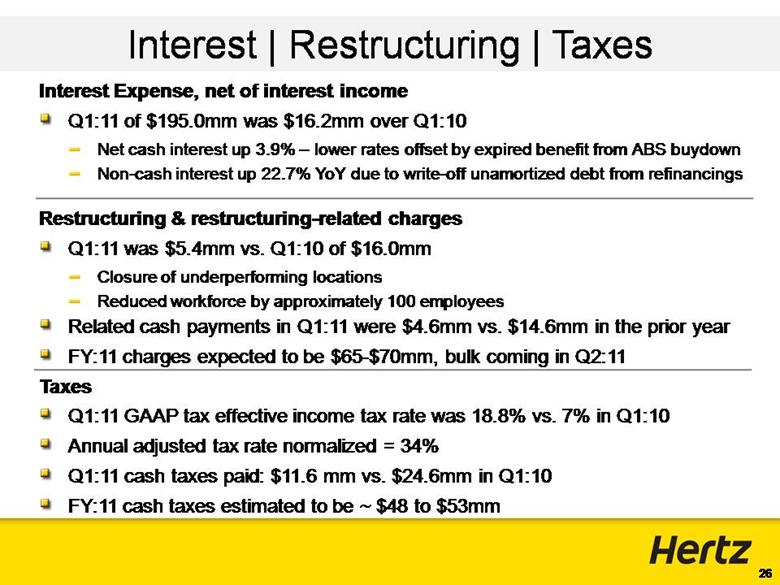
Interest Expense, net of interest income Q1:11 of $195.0mm was $16.2mm over Q1:10 Net cash interest up 3.9% – lower rates offset by expired benefit from ABS buydown Non-cash interest up 22.7% YoY due to write-off unamortized debt from refinancings Restructuring & restructuring-related charges Q1:11 was $5.4mm vs. Q1:10 of $16.0mm Closure of underperforming locations Reduced workforce by approximately 100 employees Related cash payments in Q1:11 were $4.6mm vs. $14.6mm in the prior year FY:11 charges expected to be $65-$70mm, bulk coming in Q2:11 Taxes Q1:11 GAAP tax effective income tax rate was 18.8% vs. 7% in Q1:10 Annual adjusted tax rate normalized = 34% Q1:11 cash taxes paid: $11.6 mm vs. $24.6mm in Q1:10 FY:11 cash taxes estimated to be ~ $48 to $53mm Interest | Restructuring | Taxes |
|
|
Decrease reflects corporate debt related activity: $116 million related to call premiums and fees $60 million to pay down Brazilian fleet debt maturity $11 million timing of interest payments Cash Flow First Quarter Cash Flow ($ in millions) Q1:11 Q1:10 $Δ Levered After Tax Cash Flow Before Fleet Growth ($46.4) $230.6 ($277.0) Corporate Cash Flow ($353.6) ($161.8) ($191.8) Corporate Cash Flow: Update to the presentation of Table 6 Conceptually same as Levered After Tax Cash Flow After Fleet Growth Corporate Cash Flow now incorporates changes in FX rates HERC maintenance & growth capex were consolidated |

|
|
Working Capital Days Note: Net working capital days includes non-fleet receivables, HERC fleet receivables, fleet/other payables, inventories, prepaid and accrued liabilities. Receivables include customer receivables, subro receivables, warranty, and other misc. Better Needs update Working Capital Q1:11 receivables DSO improved 7.3% since 2007 Q1:11 Working Capital Days improved 18% since 2007 Q1:07 Q1:08 Q1:09 Q1:10 Q1:11 (20) (25) (30) (35) (40) (45) (50) (55) (40.4) (45.9) Better (40.3) (49.5) (47.8) 35.0 30.0 25.0 20.0 24.25 27.81 27.58 23.49 22.49 Q1:07 Q1:08 Q1:09 Q1:10 Q1:11 Better |

|
|
Fleet Financing Status Comment €400M Securitization €220M Revolving Credit Facility €400M Secured Note Refinanced European facilities $184M Series 2009-2 Subordinated ABS Incremental liquidity from existing collateral Hertz’s first ever subordinated rental car ABS $750M Series 2010-1 Senior & Subordinated ABS Incremental Fleet Financing for Fleet Growth Blended advance rate of 7.5% and weighted average interest rate below 4% First ever stand-alone 7-year rental car ABS $250M Australian Securitization AAA rated, refinanced remainder of Int’l ABS Facility $2.1B Variable Funding Note (Conduit) Facilities Significantly reduced credit spread saving estimated $20M in 2011 interest expense Corporate Financing $700M of 7.5% Notes due 2018 Extend maturity profile and lower interest cost by calling 10.5% subordinated notes and a portion of the 8.875% senior notes $500M of 7.375% Notes due 2021 Extend maturity profile and lower interest cost by calling additional 8.875% senior notes $1B of 6.750% Notes due 2019 ($500M in Feb and $500M add-on in Mar) Redeem additional outstanding 8.875% Senior Dollar Notes due 2014 $3.4B of ABL and Term Loan Refinancing Increased operating flexibility and extended maturities Closed Closed Closed Closed Closed Closed Closed Closed Refinanced $10B in Debt Significantly Improving Capital Structure Extended avg. maturity profile by 3 yrs; lowered interest cost by $70 mil. over 3 years; improved operational flexibility Closed |

|
|
CAPITAL STRUCTURE Successfully refinanced $3.4 billion ABL & term loan Extended maturity of $1.8 B senior ABL facility to 2016 Extended maturity of $1.6 B senior term loan and letter of credit facility to 2018 Continued to capitalize opportunistically on strength of high-yield market Feb / Mar replaced $1 billion of higher coupon notes with new bonds, lowering interest rate by 2.125% |

|
|
Pro Forma Debt Maturity Profile Corporate Debt Debt Maturity Schedule - 3/31/11 Fleet Debt Debt Maturity Schedule - 3/31/11 * Reflects April redemption of 8.875% notes * Extended average maturity profile by 3 years ($ in millions) |

|
|
Refinancing Benefit Weighted Average Interest Rate Average Outstanding Refinanced Debt 2011 2010 1st year Annual Run -rate 3 year Forecast Savings US Fleet Debt $ 2.5B 2.7% 4.2% $39 M $87 M International Fleet Debt $1.1B 7.3% 3.8% ($38) M ($88) M High Yield Debt $2.2B 7.3% 9.1% $38 M $115 M Corp Debt $1.5B 3.2% 2.2% ($15) M ($44) M Total Savings $24 M $ 70 M Footnotes: Forecasted cash interest savings are over three years or the term of the refinanced debt, if shorter 1% Libor floor on Term Loan is excluded from forecasted interest savings Actual future interest expense will be impacted by fleet growth and other factors 2011 Cash Interest Expense: now only $15 to $25 million over 2010 Offsetting 2011 YoY cash interest savings is the expiration of a $54M benefit in 2010 from an interest rate buydown executed in 2009 1) 2) 3) |

|
|
Liquidity would be $1,771mm when adjusted for the $491mm of high yield notes called in April plus the call premium Liquidity Corporate Liquidity @ 3/31/11 ($ in millions) Actual Pro Forma ABL Availability: $ 896 $896 Unrestricted Cash: 1,366 875 Corporate Liquidity: $ 2,262 $1,771 Total net corporate debt $3.8 billion Total net fleet debt $5.4 billion Unrestricted cash of $1.4 billion |

|
|
2011 Updated Guidance |

|
|
Equipment Rental Outlook McGraw Hill’s Dodge Report – Non-residential Construction Spending Q2 down 1.2% Q3 up 1.0% Q4 up 11.5% HERC positive YoY pricing expected in Q2:11 1st time in four years |

|
|
FY 2011 Financial Guidance Updated due to lower depreciation & other cost savings Revised Guidance Prior Guidance* Revenue $8.1 to $8.2 bil $7.95 to $8.1 bil Corporate EBITDA $1.32 to $1.36 bil $1.265 to $1.305 bil Adjusted Pre-Tax Income $595 to $625 mil $525 to $565 mil Adjusted Net Income $375 to $395 mil $330 to $355 mil Adjusted Diluted Earnings Per Share** $0.85 to $0.90 (based on 440mm shares) $0.75 to $0.81 (based on 440mm shares) *Provided February 22, 2011 ** Q1:11 shares outstanding = 413mm Expect shares outstanding Q2:11 to be 450mm |

|
|
2011 Sensitivity to Adjusted Pre-tax Income 1 Percent change over FY:10 2 1% change = $25 million in revenue 3 Assumes all foreign currency forecasts move in the same proportion as the Euro estimate 4 1.0% of total cost base excluding net depreciation Updated Guidance Assumptions Previous Guidance Assumptions Annual Pre-Tax Opportunity with 1% Improvement1 WWRAC Pricing -1% to 0% -1% to 0% $50 Volume (Days) 6% to 7% 6% to 7% $18 Net Depr per Unit -6% to -7% -3% to -4% $15 WWHERC Pricing 0% to 1% 0% to 1% $9 Volume 10% to 12% 10% to 12% $3 FX rates2 Euro rate3 1.35 1.30 $1 Cost Efficiencies $325 mil $300 mil $564 ($ in millions) |

Table 1
HERTZ GLOBAL HOLDINGS, INC.
CONDENSED CONSOLIDATED STATEMENTS OF OPERATIONS
(In millions, except per share amounts)
Unaudited
|
|
|
Three Months Ended |
|
As a Percentage |
| ||||||
|
|
|
March 31, |
|
of Total Revenues |
| ||||||
|
|
|
2011 |
|
2010 |
|
2011 |
|
2010 |
| ||
|
Total revenues |
|
$ |
1,780.0 |
|
$ |
1,660.9 |
|
100.0 |
% |
100.0 |
% |
|
|
|
|
|
|
|
|
|
|
| ||
|
Expenses: |
|
|
|
|
|
|
|
|
| ||
|
Direct operating |
|
1,073.7 |
|
1,013.0 |
|
60.3 |
% |
61.0 |
% | ||
|
Depreciation of revenue earning equipment and lease charges |
|
436.1 |
|
459.2 |
|
24.5 |
% |
27.6 |
% | ||
|
Selling, general and administrative |
|
182.2 |
|
167.7 |
|
10.2 |
% |
10.1 |
% | ||
|
Interest expense |
|
196.9 |
|
181.1 |
|
11.1 |
% |
10.9 |
% | ||
|
Interest income |
|
(1.9 |
) |
(2.3 |
) |
(0.1 |
)% |
(0.1 |
)% | ||
|
Other (income) expense, net |
|
51.9 |
|
— |
|
2.9 |
% |
— |
% | ||
|
Total expenses |
|
1,938.9 |
|
1,818.7 |
|
108.9 |
% |
109.5 |
% | ||
|
Loss before income taxes |
|
(158.9 |
) |
(157.8 |
) |
(8.9 |
)% |
(9.5 |
)% | ||
|
Benefit for taxes on income |
|
30.0 |
|
11.0 |
|
1.7 |
% |
0.6 |
% | ||
|
Net loss |
|
(128.9 |
) |
(146.8 |
) |
(7.2 |
)% |
(8.9 |
)% | ||
|
Less: Net income attributable to noncontrolling interest |
|
(3.7 |
) |
(3.6 |
) |
(0.2 |
)% |
(0.2 |
)% | ||
|
Net loss attributable to Hertz Global Holdings, Inc. and Subsidiaries’ common stockholders |
|
$ |
(132.6 |
) |
$ |
(150.4 |
) |
(7.4 |
)% |
(9.1 |
)% |
|
|
|
|
|
|
|
|
|
|
| ||
|
Weighted average number of shares outstanding: |
|
|
|
|
|
|
|
|
| ||
|
Basic |
|
414.1 |
|
410.7 |
|
|
|
|
| ||
|
Diluted |
|
414.1 |
|
410.7 |
|
|
|
|
| ||
|
|
|
|
|
|
|
|
|
|
| ||
|
Loss per share attributable to Hertz Global Holdings, Inc. and Subsidiaries’ common stockholders: |
|
|
|
|
|
|
|
|
| ||
|
Basic |
|
$ |
(0.32 |
) |
$ |
(0.37 |
) |
|
|
|
|
|
Diluted |
|
$ |
(0.32 |
) |
$ |
(0.37 |
) |
|
|
|
|
Table 2
HERTZ GLOBAL HOLDINGS, INC.
CONDENSED CONSOLIDATED STATEMENTS OF OPERATIONS
(In millions)
Unaudited
|
|
|
Three Months Ended March 31, 2011 |
| |||||||
|
|
|
As |
|
|
|
As |
| |||
|
|
|
Reported |
|
Adjustments |
|
Adjusted |
| |||
|
Total revenues |
|
$ |
1,780.0 |
|
$ |
— |
|
$ |
1,780.0 |
|
|
|
|
|
|
|
|
|
| |||
|
Expenses: |
|
|
|
|
|
|
| |||
|
Direct operating |
|
1,073.7 |
|
(22.8 |
)(a) |
1,050.9 |
| |||
|
Depreciation of revenue earning equipment and lease charges |
|
436.1 |
|
(2.3 |
)(b) |
433.8 |
| |||
|
Selling, general and administrative |
|
182.2 |
|
(6.2 |
)(c) |
176.0 |
| |||
|
Interest expense |
|
196.9 |
|
(59.9 |
)(d) |
137.0 |
| |||
|
Interest income |
|
(1.9 |
) |
— |
|
(1.9 |
) | |||
|
Other (income) expense, net |
|
51.9 |
|
(51.7 |
)(e) |
0.2 |
| |||
|
Total expenses |
|
1,938.9 |
|
(142.9 |
) |
1,796.0 |
| |||
|
Income (loss) before income taxes |
|
(158.9 |
) |
142.9 |
|
(16.0 |
) | |||
|
Benefit (provision) for taxes on income |
|
30.0 |
|
(24.5 |
)(f) |
5.5 |
| |||
|
Net income (loss) |
|
(128.9 |
) |
118.4 |
|
(10.5 |
) | |||
|
Less: Net income attributable to noncontrolling interest |
|
(3.7 |
) |
— |
|
(3.7 |
) | |||
|
Net income (loss) attributable to Hertz Global Holdings, Inc. and Subsidiaries’ common stockholders |
|
$ |
(132.6 |
) |
$ |
118.4 |
|
$ |
(14.2 |
) |
|
|
|
Three Months Ended March 31, 2010 |
| |||||||
|
|
|
As |
|
|
|
As |
| |||
|
|
|
Reported |
|
Adjustments |
|
Adjusted |
| |||
|
Total revenues |
|
$ |
1,660.9 |
|
$ |
— |
|
$ |
1,660.9 |
|
|
|
|
|
|
|
|
|
| |||
|
Expenses: |
|
|
|
|
|
|
| |||
|
Direct operating |
|
1,013.0 |
|
(30.8 |
)(a) |
982.2 |
| |||
|
Depreciation of revenue earning equipment and lease charges |
|
459.2 |
|
(2.7 |
)(b) |
456.5 |
| |||
|
Selling, general and administrative |
|
167.7 |
|
(6.3 |
)(c) |
161.4 |
| |||
|
Interest expense |
|
181.1 |
|
(48.8 |
)(d) |
132.3 |
| |||
|
Interest income |
|
(2.3 |
) |
— |
|
(2.3 |
) | |||
|
Total expenses |
|
1,818.7 |
|
(88.6 |
) |
1,730.1 |
| |||
|
Income (loss) before income taxes |
|
(157.8 |
) |
88.6 |
|
(69.2 |
) | |||
|
Benefit (provision) for taxes on income |
|
11.0 |
|
12.5 |
(f) |
23.5 |
| |||
|
Net income (loss) |
|
(146.8 |
) |
101.1 |
|
(45.7 |
) | |||
|
Less: Net income attributable to noncontrolling interest |
|
(3.6 |
) |
— |
|
(3.6 |
) | |||
|
Net income (loss) attributable to Hertz Global Holdings, Inc. and Subsidiaries’ common stockholders |
|
$ |
(150.4 |
) |
$ |
101.1 |
|
$ |
(49.3 |
) |
(a) Represents the increase in amortization of other intangible assets, depreciation of property and equipment and accretion of certain revalued liabilities relating to purchase accounting. For the three months ended March 31, 2011 and 2010, also includes restructuring and restructuring related charges of $4.5 million and $11.4 million, respectively.
(b) Represents the increase in depreciation of revenue earning equipment based upon its revaluation relating to purchase accounting.
(c) Represents an increase in depreciation of property and equipment relating to purchase accounting. For the three months ended March 31, 2011and 2010, also includes restructuring and restructuring related charges of $0.8 million and $4.6 million, respectively. For all periods presented, also includes other adjustments which are detailed in Table 5.
(d) Represents non-cash debt charges relating to the amortization of deferred debt financing costs and debt discounts. For the three months ended March 31, 2010, also includes $20.9 million associated with the amortization of amounts pertaining to the de-designation of our interest rate swaps as effective hedging instruments.
(e) Represents premiums paid to redeem our 10.5% Senior Subordinated Notes and a portion of our 8.875% Senior Notes.
(f) Represents a provision for income taxes derived utilizing a normalized income tax rate (34% for 2011 and 2010).
Table 3
HERTZ GLOBAL HOLDINGS, INC.
SEGMENT AND OTHER INFORMATION
(In millions, except per share amounts)
Unaudited
|
|
|
Three Months Ended |
| ||||
|
|
|
March 31, |
| ||||
|
|
|
2011 |
|
2010 |
| ||
|
Revenues: |
|
|
|
|
| ||
|
Car Rental |
|
$ |
1,510.3 |
|
$ |
1,421.7 |
|
|
Equipment Rental |
|
268.2 |
|
237.0 |
| ||
|
Other reconciling items |
|
1.5 |
|
2.2 |
| ||
|
|
|
$ |
1,780.0 |
|
$ |
1,660.9 |
|
|
|
|
|
|
|
| ||
|
Depreciation of property and equipment: |
|
|
|
|
| ||
|
Car Rental |
|
$ |
27.5 |
|
$ |
29.2 |
|
|
Equipment Rental |
|
8.3 |
|
8.9 |
| ||
|
Other reconciling items |
|
1.9 |
|
1.5 |
| ||
|
|
|
$ |
37.7 |
|
$ |
39.6 |
|
|
|
|
|
|
|
| ||
|
Amortization of other intangible assets: |
|
|
|
|
| ||
|
Car Rental |
|
$ |
7.6 |
|
$ |
7.8 |
|
|
Equipment Rental |
|
8.9 |
|
8.3 |
| ||
|
Other reconciling items |
|
0.3 |
|
0.3 |
| ||
|
|
|
$ |
16.8 |
|
$ |
16.4 |
|
|
|
|
|
|
|
| ||
|
Income (loss) before income taxes: |
|
|
|
|
| ||
|
Car Rental |
|
$ |
41.0 |
|
$ |
(30.1 |
) |
|
Equipment Rental |
|
(7.8 |
) |
(23.4 |
) | ||
|
Other reconciling items |
|
(192.1 |
) |
(104.3 |
) | ||
|
|
|
$ |
(158.9 |
) |
$ |
(157.8 |
) |
|
|
|
|
|
|
| ||
|
Corporate EBITDA (a): |
|
|
|
|
| ||
|
Car Rental |
|
$ |
92.6 |
|
$ |
54.4 |
|
|
Equipment Rental |
|
91.5 |
|
80.0 |
| ||
|
Other reconciling items |
|
(17.7 |
) |
(13.0 |
) | ||
|
|
|
$ |
166.4 |
|
$ |
121.4 |
|
|
|
|
|
|
|
| ||
|
Adjusted pre-tax income (loss) (a): |
|
|
|
|
| ||
|
Car Rental |
|
$ |
61.3 |
|
$ |
27.1 |
|
|
Equipment Rental |
|
10.2 |
|
(5.0 |
) | ||
|
Other reconciling items |
|
(87.5 |
) |
(91.3 |
) | ||
|
|
|
$ |
(16.0 |
) |
$ |
(69.2 |
) |
|
|
|
|
|
|
| ||
|
Adjusted net income (loss) (a): |
|
|
|
|
| ||
|
Car Rental |
|
$ |
40.5 |
|
$ |
17.9 |
|
|
Equipment Rental |
|
6.7 |
|
(3.3 |
) | ||
|
Other reconciling items |
|
(61.4 |
) |
(63.9 |
) | ||
|
|
|
$ |
(14.2 |
) |
$ |
(49.3 |
) |
|
|
|
|
|
|
| ||
|
Adjusted diluted number of shares outstanding (a) |
|
413.0 |
|
410.0 |
| ||
|
|
|
|
|
|
| ||
|
Adjusted diluted loss per share (a) |
|
$ |
(0.03 |
) |
$ |
(0.12 |
) |
|
(a) |
Represents a non-GAAP measure, see the accompanying reconciliations and definitions. |
|
Note: |
“Other Reconciling Items” includes general corporate expenses, certain interest expense (including net interest on corporate debt), as well as other business activities such as our third-party claim management services. See Tables 5 and 6. |
Table 4
HERTZ GLOBAL HOLDINGS, INC.
SELECTED OPERATING AND FINANCIAL DATA
Unaudited
|
|
|
Three |
|
Percent |
| |
|
|
|
Months |
|
change |
| |
|
|
|
Ended, or as |
|
from |
| |
|
|
|
of Mar. 31, |
|
prior year |
| |
|
|
|
2011 |
|
period |
| |
|
|
|
|
|
|
| |
|
Selected Car Rental Operating Data |
|
|
|
|
| |
|
|
|
|
|
|
| |
|
Worldwide number of transactions (in thousands) |
|
6,028 |
|
2.9 |
% | |
|
U.S. |
|
4,479 |
|
1.8 |
% | |
|
International |
|
1,549 |
|
6.2 |
% | |
|
|
|
|
|
|
| |
|
Worldwide transaction days (in thousands) |
|
29,648 |
|
5.4 |
% | |
|
U.S. |
|
20,821 |
|
4.4 |
% | |
|
International |
|
8,827 |
|
8.0 |
% | |
|
|
|
|
|
|
| |
|
Worldwide rental rate revenue per transaction day (a) |
|
$ |
42.26 |
|
(1.0 |
)% |
|
U.S. |
|
$ |
41.34 |
|
(1.5 |
)% |
|
International (b) |
|
$ |
44.41 |
|
(0.2 |
)% |
|
|
|
|
|
|
| |
|
Worldwide average number of company-operated cars during period |
|
427,400 |
|
2.3 |
% | |
|
U.S. |
|
295,700 |
|
0.7 |
% | |
|
International |
|
131,700 |
|
6.2 |
% | |
|
|
|
|
|
|
| |
|
Worldwide revenue earning equipment, net (in millions) |
|
$ |
7,714.2 |
|
3.3 |
% |
|
|
|
|
|
|
| |
|
Selected Worldwide Equipment Rental Operating Data |
|
|
|
|
| |
|
|
|
|
|
|
| |
|
Rental and rental related revenue (in millions) (a) (b) |
|
$ |
243.1 |
|
12.8 |
% |
|
Same store revenue growth (decline), including initiatives (a) (b) |
|
10.6 |
% |
N/M |
| |
|
Average acquisition cost of revenue earning equipment operated during period (in millions) |
|
$ |
2,756.8 |
|
(0.8 |
)% |
|
Worldwide revenue earning equipment, net (in millions) |
|
$ |
1,687.1 |
|
(3.2 |
)% |
|
|
|
|
|
|
| |
|
Other Financial Data (in millions) |
|
|
|
|
| |
|
|
|
|
|
|
| |
|
Cash flows provided by operating activities |
|
$ |
165.6 |
|
(41.8 |
)% |
|
Corporate cash flow (a) |
|
(353.6 |
) |
(118.5 |
)% | |
|
EBITDA (a) |
|
523.6 |
|
(1.9 |
)% | |
|
Corporate EBITDA (a) |
|
166.4 |
|
37.1 |
% | |
Selected Balance Sheet Data (in millions)
|
|
|
March 31, |
|
December 31, |
| ||
|
|
|
2011 |
|
2010 |
| ||
|
Cash and cash equivalents |
|
$ |
1,365.8 |
|
$ |
2,374.2 |
|
|
Total revenue earning equipment, net |
|
9,401.3 |
|
8,939.4 |
| ||
|
Total assets |
|
16,827.6 |
|
17,332.2 |
| ||
|
Total debt |
|
10,750.0 |
|
11,306.4 |
| ||
|
Net corporate debt (a) |
|
3,755.7 |
|
3,364.5 |
| ||
|
Net fleet debt (a) |
|
5,437.6 |
|
5,360.1 |
| ||
|
Total net debt (a) |
|
9,193.3 |
|
8,724.6 |
| ||
|
Total equity |
|
2,034.7 |
|
2,131.3 |
| ||
|
(a) |
Represents a non-GAAP measure, see the accompanying reconciliations and definitions. |
|
(b) |
Based on 12/31/10 foreign exchange rates. |
|
N/M |
Percentage change not meaningful. |
Table 5
HERTZ GLOBAL HOLDINGS, INC.
RECONCILIATION OF GAAP TO NON-GAAP EARNINGS MEASURES
(In millions, except per share amounts)
Unaudited
ADJUSTED PRE-TAX INCOME (LOSS), ADJUSTED NET INCOME (LOSS) AND
ADJUSTED DILUTED EARNINGS (LOSS) PER SHARE
|
|
|
Three Months Ended March 31, 2011 |
| ||||||||||
|
|
|
|
|
|
|
Other |
|
|
| ||||
|
|
|
Car |
|
Equipment |
|
Reconciling |
|
|
| ||||
|
|
|
Rental |
|
Rental |
|
Items |
|
Total |
| ||||
|
Total revenues: |
|
$ |
1,510.3 |
|
$ |
268.2 |
|
$ |
1.5 |
|
$ |
1,780.0 |
|
|
Expenses: |
|
|
|
|
|
|
|
|
| ||||
|
Direct operating and selling, general and administrative |
|
1,026.4 |
|
197.7 |
|
31.8 |
|
1,255.9 |
| ||||
|
Depreciation of revenue earning equipment and lease charges |
|
368.9 |
|
67.2 |
|
— |
|
436.1 |
| ||||
|
Interest expense |
|
75.4 |
|
11.1 |
|
110.4 |
|
196.9 |
| ||||
|
Interest income |
|
(1.4 |
) |
(0.1 |
) |
(0.4 |
) |
(1.9 |
) | ||||
|
Other (income) expense, net |
|
— |
|
0.1 |
|
51.8 |
|
51.9 |
| ||||
|
Total expenses |
|
1,469.3 |
|
276.0 |
|
193.6 |
|
1,938.9 |
| ||||
|
Income (loss) before income taxes |
|
41.0 |
|
(7.8 |
) |
(192.1 |
) |
(158.9 |
) | ||||
|
Adjustments: |
|
|
|
|
|
|
|
|
| ||||
|
Purchase accounting (a): |
|
|
|
|
|
|
|
|
| ||||
|
Direct operating and selling, general and administrative |
|
8.1 |
|
9.4 |
|
0.9 |
|
18.4 |
| ||||
|
Depreciation of revenue earning equipment |
|
— |
|
2.2 |
|
— |
|
2.2 |
| ||||
|
Non-cash debt charges (b) |
|
10.2 |
|
2.5 |
|
47.2 |
|
59.9 |
| ||||
|
Restructuring charges (c) |
|
1.0 |
|
3.9 |
|
— |
|
4.9 |
| ||||
|
Restructuring related charges (c) |
|
0.5 |
|
— |
|
— |
|
0.5 |
| ||||
|
Derivative (gains) losses (c) |
|
0.5 |
|
— |
|
(0.5 |
) |
— |
| ||||
|
Acquisition related costs (d) |
|
— |
|
— |
|
2.8 |
|
2.8 |
| ||||
|
Management transition costs (d) |
|
— |
|
— |
|
2.5 |
|
2.5 |
| ||||
|
Premiums paid on debt (e) |
|
— |
|
— |
|
51.7 |
|
51.7 |
| ||||
|
Adjusted pre-tax income (loss) |
|
61.3 |
|
10.2 |
|
(87.5 |
) |
(16.0 |
) | ||||
|
Assumed (provision) benefit for income taxes of 34% |
|
(20.8 |
) |
(3.5 |
) |
29.8 |
|
5.5 |
| ||||
|
Noncontrolling interest |
|
— |
|
— |
|
(3.7 |
) |
(3.7 |
) | ||||
|
Adjusted net income (loss) |
|
$ |
40.5 |
|
$ |
6.7 |
|
$ |
(61.4 |
) |
$ |
(14.2 |
) |
|
Adjusted diluted number of shares outstanding |
|
|
|
|
|
|
|
413.0 |
| ||||
|
|
|
|
|
|
|
|
|
|
| ||||
|
Adjusted diluted loss per share |
|
|
|
|
|
|
|
$ |
(0.03 |
) | |||
|
|
|
Three Months Ended March 31, 2010 |
| ||||||||||
|
|
|
|
|
|
|
Other |
|
|
| ||||
|
|
|
Car |
|
Equipment |
|
Reconciling |
|
|
| ||||
|
|
|
Rental |
|
Rental |
|
Items |
|
Total |
| ||||
|
Total revenues: |
|
$ |
1,421.7 |
|
$ |
237.0 |
|
$ |
2.2 |
|
$ |
1,660.9 |
|
|
Expenses: |
|
|
|
|
|
|
|
|
| ||||
|
Direct operating and selling, general and administrative |
|
976.3 |
|
179.3 |
|
25.1 |
|
1,180.7 |
| ||||
|
Depreciation of revenue earning equipment and lease charges |
|
388.3 |
|
70.9 |
|
— |
|
459.2 |
| ||||
|
Interest expense |
|
89.3 |
|
10.2 |
|
81.6 |
|
181.1 |
| ||||
|
Interest income |
|
(2.1 |
) |
— |
|
(0.2 |
) |
(2.3 |
) | ||||
|
Total expenses |
|
1,451.8 |
|
260.4 |
|
106.5 |
|
1,818.7 |
| ||||
|
Loss before income taxes |
|
(30.1 |
) |
(23.4 |
) |
(104.3 |
) |
(157.8 |
) | ||||
|
Adjustments: |
|
|
|
|
|
|
|
|
| ||||
|
Purchase accounting (a): |
|
|
|
|
|
|
|
|
| ||||
|
Direct operating and selling, general and administrative |
|
9.8 |
|
8.8 |
|
0.8 |
|
19.4 |
| ||||
|
Depreciation of revenue earning equipment |
|
— |
|
2.7 |
|
— |
|
2.7 |
| ||||
|
Non-cash debt charges (b) |
|
37.0 |
|
1.9 |
|
9.9 |
|
48.8 |
| ||||
|
Restructuring charges (c) |
|
5.3 |
|
4.9 |
|
0.5 |
|
10.7 |
| ||||
|
Restructuring related charges (c) |
|
5.1 |
|
0.1 |
|
0.1 |
|
5.3 |
| ||||
|
Derivative losses (c) |
|
— |
|
— |
|
1.7 |
|
1.7 |
| ||||
|
Adjusted pre-tax income (loss) |
|
27.1 |
|
(5.0 |
) |
(91.3 |
) |
(69.2 |
) | ||||
|
Assumed (provision) benefit for income taxes of 34% |
|
(9.2 |
) |
1.7 |
|
31.0 |
|
23.5 |
| ||||
|
Noncontrolling interest |
|
— |
|
— |
|
(3.6 |
) |
(3.6 |
) | ||||
|
Adjusted net income (loss) |
|
$ |
17.9 |
|
$ |
(3.3 |
) |
$ |
(63.9 |
) |
$ |
(49.3 |
) |
|
Adjusted diluted number of shares outstanding |
|
|
|
|
|
|
|
410.0 |
| ||||
|
|
|
|
|
|
|
|
|
|
| ||||
|
Adjusted diluted loss per share |
|
|
|
|
|
|
|
$ |
(0.12 |
) | |||
(a) Represents the purchase accounting effects of the acquisition of all of Hertz’s common stock on December 21, 2005 on our results of operations relating to increased depreciation and amortization of tangible and intangible assets and accretion of workers’ compensation and public liability and property damage liabilities. Also represents the purchase accounting effects of subsequent acquisitions on our results of operations relating to increased amortization of intangible assets.
(b) Represents non-cash debt charges relating to the amortization of deferred debt financing costs and debt discounts. For the three months ended March 31, 2010, also includes $20.9 million associated with the amortization of amounts pertaining to the de-designation of our interest rate swaps as effective hedging instruments.
(c) Amounts are included within direct operating and selling, general and administrative expense in our statement of operations.
(d) Amounts are included within selling, general and administrative expense in our statement of operations.
(e) Represents premiums paid to redeem our 10.5% Senior Subordinated Notes and a portion of our 8.875% Senior Notes. These costs are included within other (income) expense, net in our statement of operations.
Table 6
HERTZ GLOBAL HOLDINGS, INC.
RECONCILIATION OF GAAP TO NON-GAAP EARNINGS MEASURES
(In millions)
Unaudited
EBITDA, CORPORATE EBITDA, UNLEVERED PRE-TAX CASH FLOW,
LEVERED AFTER-TAX CASH FLOW BEFORE FLEET GROWTH AND CORPORATE CASH FLOW
|
|
|
Three Months Ended March 31, 2011 |
| ||||||||||
|
|
|
|
|
|
|
Other |
|
|
| ||||
|
|
|
Car |
|
Equipment |
|
Reconciling |
|
|
| ||||
|
|
|
Rental |
|
Rental |
|
Items |
|
Total |
| ||||
|
|
|
|
|
|
|
|
|
|
| ||||
|
Income (loss) before income taxes |
|
$ |
41.0 |
|
$ |
(7.8 |
) |
$ |
(192.1 |
) |
$ |
(158.9 |
) |
|
Depreciation, amortization and other purchase accounting |
|
404.3 |
|
84.4 |
|
2.5 |
|
491.2 |
| ||||
|
Interest, net of interest income |
|
74.0 |
|
11.0 |
|
110.0 |
|
195.0 |
| ||||
|
Noncontrolling interest |
|
— |
|
— |
|
(3.7 |
) |
(3.7 |
) | ||||
|
EBITDA |
|
519.3 |
|
87.6 |
|
(83.3 |
) |
523.6 |
| ||||
|
Adjustments: |
|
|
|
|
|
|
|
|
| ||||
|
Car rental fleet interest |
|
(69.7 |
) |
— |
|
— |
|
(69.7 |
) | ||||
|
Car rental fleet depreciation |
|
(368.9 |
) |
— |
|
— |
|
(368.9 |
) | ||||
|
Non-cash expenses and charges (a) |
|
10.4 |
|
— |
|
8.6 |
|
19.0 |
| ||||
|
Extraordinary, unusual or non-recurring gains and losses (b) |
|
1.5 |
|
3.9 |
|
57.0 |
|
62.4 |
| ||||
|
Corporate EBITDA |
|
$ |
92.6 |
|
$ |
91.5 |
|
$ |
(17.7 |
) |
166.4 |
| |
|
Non-fleet capital expenditures, net |
|
|
|
|
|
|
|
(42.3 |
) | ||||
|
Changes in working capital: |
|
|
|
|
|
|
|
|
| ||||
|
Receivables, excluding car rental fleet receivables |
|
|
|
|
|
|
|
(10.9 |
) | ||||
|
Accounts payable |
|
|
|
|
|
|
|
247.2 |
| ||||
|
Accrued liabilities and other |
|
|
|
|
|
|
|
(200.3 |
) | ||||
|
Acquisition and other investing activities |
|
|
|
|
|
|
|
(8.6 |
) | ||||
|
Other financing activities, excluding debt |
|
|
|
|
|
|
|
(72.2 |
) | ||||
|
Foreign exchange impact on cash and cash equivalents |
|
|
|
|
|
|
|
21.7 |
| ||||
|
Unlevered pre-tax cash flow |
|
|
|
|
|
|
|
101.0 |
| ||||
|
Corporate net cash interest |
|
|
|
|
|
|
|
(135.8 |
) | ||||
|
Corporate cash taxes |
|
|
|
|
|
|
|
(11.6 |
) | ||||
|
Levered after-tax cash flow before fleet growth |
|
|
|
|
|
|
|
(46.4 |
) | ||||
|
Equipment rental revenue earning equipment expenditures, net of disposal proceeds |
|
|
|
|
|
|
|
(34.1 |
) | ||||
|
Car rental fleet equity requirement |
|
|
|
|
|
|
|
(273.1 |
) | ||||
|
Corporate cash flow |
|
|
|
|
|
|
|
$ |
(353.6 |
) | |||
|
|
|
Three Months Ended March 31, 2010 |
| ||||||||||
|
|
|
|
|
|
|
Other |
|
|
| ||||
|
|
|
Car |
|
Equipment |
|
Reconciling |
|
|
| ||||
|
|
|
Rental |
|
Rental |
|
Items |
|
Total |
| ||||
|
|
|
|
|
|
|
|
|
|
| ||||
|
Income (loss) before income taxes |
|
$ |
(30.1 |
) |
$ |
(23.4 |
) |
$ |
(104.3 |
) |
$ |
(157.8 |
) |
|
Depreciation, amortization and other purchase accounting |
|
426.2 |
|
88.2 |
|
2.2 |
|
516.6 |
| ||||
|
Interest, net of interest income |
|
87.2 |
|
10.2 |
|
81.4 |
|
178.8 |
| ||||
|
Noncontrolling interest |
|
— |
|
— |
|
(3.6 |
) |
(3.6 |
) | ||||
|
EBITDA |
|
483.3 |
|
75.0 |
|
(24.3 |
) |
534.0 |
| ||||
|
Adjustments: |
|
|
|
|
|
|
|
|
| ||||
|
Car rental fleet interest |
|
(87.9 |
) |
— |
|
— |
|
(87.9 |
) | ||||
|
Car rental fleet depreciation |
|
(388.3 |
) |
— |
|
— |
|
(388.3 |
) | ||||
|
Non-cash expenses and charges (a) |
|
36.9 |
|
— |
|
10.7 |
|
47.6 |
| ||||
|
Extraordinary, unusual or non-recurring gains and losses (b) |
|
10.4 |
|
5.0 |
|
0.6 |
|
16.0 |
| ||||
|
Corporate EBITDA |
|
$ |
54.4 |
|
$ |
80.0 |
|
$ |
(13.0 |
) |
121.4 |
| |
|
Non-fleet capital expenditures, net |
|
|
|
|
|
|
|
(44.6 |
) | ||||
|
Changes in working capital: |
|
|
|
|
|
|
|
|
| ||||
|
Receivables, excluding car rental fleet receivables |
|
|
|
|
|
|
|
(37.9 |
) | ||||
|
Accounts payable |
|
|
|
|
|
|
|
456.9 |
| ||||
|
Accrued liabilities and other |
|
|
|
|
|
|
|
(78.8 |
) | ||||
|
Acquisition and other investing activities |
|
|
|
|
|
|
|
3.7 |
| ||||
|
Other financing activities, excluding debt |
|
|
|
|
|
|
|
(8.2 |
) | ||||
|
Foreign exchange impact on cash and cash equivalents |
|
|
|
|
|
|
|
(32.7 |
) | ||||
|
Unlevered pre-tax cash flow |
|
|
|
|
|
|
|
379.8 |
| ||||
|
Corporate net cash interest |
|
|
|
|
|
|
|
(124.6 |
) | ||||
|
Corporate cash taxes |
|
|
|
|
|
|
|
(24.6 |
) | ||||
|
Levered after-tax cash flow before fleet growth |
|
|
|
|
|
|
|
230.6 |
| ||||
|
Equipment rental revenue earning equipment expenditures, net of disposal proceeds |
|
|
|
|
|
|
|
12.6 |
| ||||
|
Car rental fleet equity requirement |
|
|
|
|
|
|
|
(405.0 |
) | ||||
|
Corporate cash flow |
|
|
|
|
|
|
|
$ |
(161.8 |
) | |||
(a) As defined in the credit agreements for the senior credit facilities, Corporate EBITDA excludes the impact of certain non-cash expenses and charges. The adjustments reflect the following:
NON-CASH EXPENSES AND CHARGES
|
|
|
Three Months Ended March 31, 2011 |
| ||||||||||
|
|
|
|
|
|
|
Other |
|
|
| ||||
|
|
|
Car |
|
Equipment |
|
Reconciling |
|
|
| ||||
|
|
|
Rental |
|
Rental |
|
Items |
|
Total |
| ||||
|
|
|
|
|
|
|
|
|
|
| ||||
|
Non-cash amortization of debt costs included in car rental fleet interest |
|
$ |
9.9 |
|
$ |
— |
|
$ |
— |
|
$ |
9.9 |
|
|
Non-cash stock-based employee compensation charges |
|
— |
|
— |
|
9.1 |
|
9.1 |
| ||||
|
Derivative (gains) losses |
|
0.5 |
|
— |
|
(0.5 |
) |
— |
| ||||
|
Total non-cash expenses and charges |
|
$ |
10.4 |
|
$ |
— |
|
$ |
8.6 |
|
$ |
19.0 |
|
NON-CASH EXPENSES AND CHARGES
|
|
|
Three Months Ended March 31, 2010 |
| ||||||||||
|
|
|
|
|
|
|
Other |
|
|
| ||||
|
|
|
Car |
|
Equipment |
|
Reconciling |
|
|
| ||||
|
|
|
Rental |
|
Rental |
|
Items |
|
Total |
| ||||
|
|
|
|
|
|
|
|
|
|
| ||||
|
Non-cash amortization of debt costs included in car rental fleet interest |
|
$ |
36.9 |
|
$ |
— |
|
$ |
— |
|
$ |
36.9 |
|
|
Non-cash stock-based employee compensation charges |
|
— |
|
— |
|
9.0 |
|
9.0 |
| ||||
|
Derivative losses |
|
— |
|
— |
|
1.7 |
|
1.7 |
| ||||
|
Total non-cash expenses and charges |
|
$ |
36.9 |
|
$ |
— |
|
$ |
10.7 |
|
$ |
47.6 |
|
(b) As defined in the credit agreements for the senior credit facilities, Corporate EBITDA excludes the impact of extraordinary, unusual or non-recurring gains or losses or charges or credits. The adjustments reflect the following:
EXTRAORDINARY, UNUSUAL OR NON-RECURRING ITEMS
|
|
|
Three Months Ended March 31, 2011 |
| ||||||||||
|
|
|
|
|
|
|
Other |
|
|
| ||||
|
|
|
Car |
|
Equipment |
|
Reconciling |
|
|
| ||||
|
|
|
Rental |
|
Rental |
|
Items |
|
Total |
| ||||
|
|
|
|
|
|
|
|
|
|
| ||||
|
Restructuring charges |
|
$ |
1.0 |
|
$ |
3.9 |
|
$ |
— |
|
$ |
4.9 |
|
|
Restructuring related charges |
|
0.5 |
|
— |
|
— |
|
0.5 |
| ||||
|
Acquisition related costs |
|
— |
|
— |
|
2.8 |
|
2.8 |
| ||||
|
Management transition costs |
|
— |
|
— |
|
2.5 |
|
2.5 |
| ||||
|
Premiums paid on debt |
|
— |
|
— |
|
51.7 |
|
51.7 |
| ||||
|
Total extraordinary, unusual or non-recurring items |
|
$ |
1.5 |
|
$ |
3.9 |
|
$ |
57.0 |
|
$ |
62.4 |
|
EXTRAORDINARY, UNUSUAL OR NON-RECURRING ITEMS
|
|
|
Three Months Ended March 31, 2010 |
| ||||||||||
|
|
|
|
|
|
|
Other |
|
|
| ||||
|
|
|
Car |
|
Equipment |
|
Reconciling |
|
|
| ||||
|
|
|
Rental |
|
Rental |
|
Items |
|
Total |
| ||||
|
|
|
|
|
|
|
|
|
|
| ||||
|
Restructuring charges |
|
$ |
5.3 |
|
$ |
4.9 |
|
$ |
0.5 |
|
$ |
10.7 |
|
|
Restructuring related charges |
|
5.1 |
|
0.1 |
|
0.1 |
|
5.3 |
| ||||
|
Total extraordinary, unusual or non-recurring items |
|
$ |
10.4 |
|
$ |
5.0 |
|
$ |
0.6 |
|
$ |
16.0 |
|
Table 7
HERTZ GLOBAL HOLDINGS, INC.
RECONCILIATION OF GAAP TO NON-GAAP EARNINGS MEASURES
(In millions, except as noted)
Unaudited
RECONCILIATION FROM OPERATING CASH FLOWS TO EBITDA:
|
|
|
Three Months Ended |
| ||||
|
|
|
March 31, |
| ||||
|
|
|
2011 |
|
2010 |
| ||
|
|
|
|
|
|
| ||
|
Net cash provided by operating activities |
|
$ |
165.6 |
|
$ |
284.7 |
|
|
Amortization of debt costs |
|
(59.9 |
) |
(27.9 |
) | ||
|
Provision for losses on doubtful accounts |
|
(6.4 |
) |
(5.1 |
) | ||
|
Derivative gains (losses) |
|
6.9 |
|
(9.8 |
) | ||
|
Gain (loss) on sale of property and equipment |
|
2.3 |
|
0.4 |
| ||
|
Amortization of cash flow hedges |
|
— |
|
(20.9 |
) | ||
|
Stock-based compensation charges |
|
(9.1 |
) |
(9.0 |
) | ||
|
Asset writedowns |
|
(0.7 |
) |
(0.7 |
) | ||
|
Lease charges |
|
23.6 |
|
16.5 |
| ||
|
Noncontrolling interest |
|
(3.7 |
) |
(3.6 |
) | ||
|
Deferred income taxes |
|
26.5 |
|
(32.2 |
) | ||
|
Provision (benefit) for taxes on income |
|
(30.0 |
) |
(11.0 |
) | ||
|
Interest expense, net of interest income |
|
195.0 |
|
178.8 |
| ||
|
Changes in assets and liabilities |
|
213.5 |
|
173.8 |
| ||
|
EBITDA |
|
$ |
523.6 |
|
$ |
534.0 |
|
NET CORPORATE DEBT, NET FLEET DEBT AND TOTAL NET DEBT
|
|
|
March 31, |
|
December 31, |
|
March 31, |
| |||
|
|
|
2011 |
|
2010 |
|
2010 |
| |||
|
|
|
|
|
|
|
|
| |||
|
Total Corporate Debt |
|
$ |
5,202.2 |
|
$ |
5,830.7 |
|
$ |
4,674.7 |
|
|
Total Fleet Debt |
|
5,547.8 |
|
5,475.7 |
|
5,713.2 |
| |||
|
Total Debt |
|
$ |
10,750.0 |
|
$ |
11,306.4 |
|
$ |
10,387.9 |
|
|
|
|
|
|
|
|
|
| |||
|
Corporate Restricted Cash |
|
|
|
|
|
|
| |||
|
Restricted Cash, less: |
|
$ |
190.9 |
|
$ |
207.6 |
|
$ |
221.3 |
|
|
Restricted Cash Associated with Fleet Debt |
|
(110.2 |
) |
(115.6 |
) |
(129.6 |
) | |||
|
Corporate Restricted Cash |
|
$ |
80.7 |
|
$ |
92.0 |
|
$ |
91.7 |
|
|
|
|
|
|
|
|
|
| |||
|
Net Corporate Debt |
|
|
|
|
|
|
| |||
|
Corporate Debt, less: |
|
$ |
5,202.2 |
|
$ |
5,830.7 |
|
$ |
4,674.7 |
|
|
Cash and Cash Equivalents |
|
(1,365.8 |
) |
(2,374.2 |
) |
(800.7 |
) | |||
|
Corporate Restricted Cash |
|
(80.7 |
) |
(92.0 |
) |
(91.7 |
) | |||
|
Net Corporate Debt |
|
$ |
3,755.7 |
|
$ |
3,364.5 |
|
$ |
3,782.3 |
|
|
|
|
|
|
|
|
|
| |||
|
Net Fleet Debt |
|
|
|
|
|
|
| |||
|
Fleet Debt, less: |
|
$ |
5,547.8 |
|
$ |
5,475.7 |
|
$ |
5,713.2 |
|
|
Restricted Cash Associated with Fleet Debt |
|
(110.2 |
) |
(115.6 |
) |
(129.6 |
) | |||
|
Net Fleet Debt |
|
$ |
5,437.6 |
|
$ |
5,360.1 |
|
$ |
5,583.6 |
|
|
|
|
|
|
|
|
|
| |||
|
Total Net Debt |
|
$ |
9,193.3 |
|
$ |
8,724.6 |
|
$ |
9,365.9 |
|
NET CORPORATE DEBT, NET FLEET DEBT AND TOTAL NET DEBT
|
|
|
December 31, |
|
March 31, |
| ||
|
|
|
2009 |
|
2009 |
| ||
|
|
|
|
|
|
| ||
|
Total Corporate Debt |
|
$ |
4,689.4 |
|
$ |
4,500.8 |
|
|
Total Fleet Debt |
|
5,675.0 |
|
5,191.8 |
| ||
|
Total Debt |
|
$ |
10,364.4 |
|
$ |
9,692.6 |
|
|
|
|
|
|
|
| ||
|
Corporate Restricted Cash |
|
|
|
|
| ||
|
Restricted Cash, less: |
|
$ |
365.2 |
|
$ |
323.4 |
|
|
Restricted Cash Associated with Fleet Debt |
|
(295.0 |
) |
(233.4 |
) | ||
|
Corporate Restricted Cash |
|
$ |
70.2 |
|
$ |
90.0 |
|
|
|
|
|
|
|
| ||
|
Net Corporate Debt |
|
|
|
|
| ||
|
Corporate Debt, less: |
|
$ |
4,689.4 |
|
$ |
4,500.8 |
|
|
Cash and Cash Equivalents |
|
(985.6 |
) |
(557.1 |
) | ||
|
Corporate Restricted Cash |
|
(70.2 |
) |
(90.0 |
) | ||
|
Net Corporate Debt |
|
$ |
3,633.6 |
|
$ |
3,853.7 |
|
|
|
|
|
|
|
| ||
|
Net Fleet Debt |
|
|
|
|
| ||
|
Fleet Debt, less: |
|
$ |
5,675.0 |
|
$ |
5,191.8 |
|
|
Restricted Cash Associated with Fleet Debt |
|
(295.0 |
) |
(233.4 |
) | ||
|
Net Fleet Debt |
|
$ |
5,380.0 |
|
$ |
4,958.4 |
|
|
|
|
|
|
|
| ||
|
Total Net Debt |
|
$ |
9,013.6 |
|
$ |
8,812.1 |
|
CAR RENTAL RATE REVENUE PER TRANSACTION DAY (a)
|
|
|
Three Months Ended |
| ||||
|
|
|
March 31, |
| ||||
|
|
|
2011 |
|
2010 |
| ||
|
|
|
|
|
|
| ||
|
Car rental segment revenues (b) |
|
$ |
1,510.3 |
|
$ |
1,421.7 |
|
|
Non-rental rate revenue |
|
(248.0 |
) |
(222.9 |
) | ||
|
Foreign currency adjustment |
|
(9.5 |
) |
1.5 |
| ||
|
Rental rate revenue |
|
$ |
1,252.8 |
|
$ |
1,200.3 |
|
|
Transactions days (in thousands) |
|
29,648 |
|
28,116 |
| ||
|
Rental rate revenue per transaction day (in whole dollars) |
|
$ |
42.26 |
|
$ |
42.69 |
|
EQUIPMENT RENTAL AND RENTAL RELATED REVENUE (a)
|
|
|
Three Months Ended |
| ||||
|
|
|
March 31, |
| ||||
|
|
|
2011 |
|
2010 |
| ||
|
|
|
|
|
|
| ||
|
Equipment rental segment revenues |
|
$ |
268.2 |
|
$ |
237.0 |
|
|
Equipment sales and other revenue |
|
(23.4 |
) |
(22.1 |
) | ||
|
Foreign currency adjustment |
|
(1.7 |
) |
0.7 |
| ||
|
Rental and rental related revenue |
|
$ |
243.1 |
|
$ |
215.6 |
|
(a) Based on 12/31/10 foreign exchange rates.
(b) Includes U.S. off-airport revenues of $262.1 million and $231.7 million for the three months ended March 31, 2011 and 2010, respectively.
Exhibit 1
Non-GAAP Measures: Definitions and Use/Importance
Hertz Global Holdings, Inc. (“Hertz Holdings”) is our top-level holding company. The Hertz Corporation (“Hertz”) is our primary operating company. The term “GAAP” refers to accounting principles generally accepted in the United States of America.
Definitions of non-GAAP measures utilized in Hertz Holdings’ April 26, 2011 Press Release are set forth below. Also set forth below is a summary of the reasons why management of Hertz Holdings and Hertz believes that the presentation of the non-GAAP financial measures included in the Press Release provide useful information regarding Hertz Holdings’ and Hertz’s financial condition and results of operations and additional purposes, if any, for which management of Hertz Holdings and Hertz utilize the non-GAAP measures.
1. Earnings Before Interest, Taxes, Depreciation and Amortization (“EBITDA”) and Corporate EBITDA
EBITDA is defined as net income before net interest expense, income taxes and depreciation (which includes revenue earning equipment lease charges) and amortization. Corporate EBITDA, as presented herein, represents EBITDA as adjusted for car rental fleet interest, car rental fleet depreciation and certain other items, as described in more detail in the accompanying tables.
Management uses EBITDA and Corporate EBITDA as operating performance and liquidity metrics for internal monitoring and planning purposes, including the preparation of our annual operating budget and monthly operating reviews, as well as to facilitate analysis of investment decisions, profitability and performance trends. Further, EBITDA enables management and investors to isolate the effects on profitability of operating metrics such as revenue, operating expenses and selling, general and administrative expenses, which enables management and investors to evaluate our two business segments that are financed differently and have different depreciation characteristics and compare our performance against companies with different capital structures and depreciation policies. We also present Corporate EBITDA as a supplemental measure because such information is utilized in the calculation of financial covenants under Hertz’s senior credit facilities.
EBITDA and Corporate EBITDA are not recognized measurements under GAAP. When evaluating our operating performance or liquidity, investors should not consider EBITDA and Corporate EBITDA in isolation of, or as a substitute for, measures of our financial performance and liquidity as determined in accordance with GAAP, such as net income, operating income or net cash provided by operating activities.
2. Adjusted Pre-Tax Income
Adjusted pre-tax income is calculated as income before income taxes plus non-cash purchase accounting charges, non-cash debt charges relating to the amortization of debt financing costs and debt discounts and certain one-time charges and non-operational items. Adjusted pre-tax income is important to management because it allows management to assess operational performance of our business, exclusive of the items mentioned above. It also allows management to assess the performance of the entire business on the same basis as the segment measure of profitability. Management believes that it is important to investors for the same reasons it is important to management and because it allows them to assess the operational performance of the Company on the same basis that management uses internally.
3. Adjusted Net Income
Adjusted net income is calculated as adjusted pre-tax income less a provision for income taxes derived utilizing a normalized income tax rate (34% in 2011 and 2010) and noncontrolling interest. The normalized income tax rate is management’s estimate of our long-term tax rate. Adjusted net income is important to management and investors because it represents our operational performance exclusive of the effects of purchase accounting, non-cash debt charges, one-time charges and items that are not operational in nature or comparable to those of our competitors.
4. Adjusted Diluted Earnings Per Share
Adjusted diluted earnings per share is calculated as adjusted net income divided by, for 2011, 413.0 million which represents the approximate number of shares outstanding at March 31, 2011 and for 2010, 410.0 million which represents the approximate number of shares outstanding at December 31, 2009. Adjusted diluted earnings per share is important to management and investors because it represents a measure of our operational performance exclusive of the effects of purchase accounting adjustments, non-cash debt charges, one-time charges and items that are not operational in nature or comparable to those of our competitors.
5. Transaction Days
Transaction days represent the total number of days that vehicles were on rent in a given period.
6. Car Rental Rate Revenue, Rental Rate Revenue Per Transaction Day and Rental Rate Revenue Per Transaction
Car rental rate revenue consists of all revenue, net of discounts, associated with the rental of cars including charges for optional insurance products, but excluding revenue derived from fueling and concession and other expense pass-throughs, NeverLost units in the U.S. and certain ancillary revenue. Rental rate revenue per transaction day is calculated as total rental rate revenue, divided by the total number of transaction days, with all periods adjusted to eliminate the effect of fluctuations in foreign currency. Rental rate revenue per transaction is calculated as total rental rate revenue, divided by the total number of transactions, with all periods adjusted to eliminate the effects of fluctuations in foreign currency. Our management believes eliminating the effect of fluctuations in foreign currency is appropriate so as not to affect the comparability of underlying trends. These statistics are important to management and investors as they represent the best measurements of the changes in underlying pricing in the car rental business and encompass the elements in car rental pricing that management has the ability to control. The optional insurance products are packaged within certain negotiated corporate, government and membership programs and within certain retail rates being charged. Based upon these existing programs and rate packages, management believes that these optional insurance products should be consistently included in the daily pricing of car rental transactions. On the other hand, non-rental rate revenue items such as refueling and concession pass-through expense items are driven by factors beyond the control of management (i.e. the price of fuel and the concession fees charged by airports). Additionally, NeverLost units are an optional revenue product which management does not consider to be part of their daily pricing of car rental transactions.
7. Equipment Rental and Rental Related Revenue
Equipment rental and rental related revenue consists of all revenue, net of discounts, associated with the rental of equipment including charges for delivery, loss damage waivers and fueling, but excluding revenue arising from the sale of equipment, parts and supplies and certain other ancillary revenue. Rental and rental related revenue is adjusted in all periods to eliminate the effect of fluctuations in foreign currency. Our management believes eliminating the effect of fluctuations in foreign currency is appropriate so as not to affect the comparability of underlying trends. This statistic is important to our management and to investors as it is utilized in the measurement of rental revenue generated per dollar invested in fleet on an annualized basis and is comparable with the reporting of other industry participants.
8. Same Store Revenue Growth/Decline
Same store revenue growth or decline is calculated as the year over year change in revenue for locations that are open at the end of the period reported and have been operating under our direction for more than twelve months. The same store revenue amounts are adjusted in all periods to eliminate the effect of fluctuations in foreign currency. Our management believes eliminating the effect of fluctuations in foreign currency is appropriate so as not to affect the comparability of underlying trends.
9. Unlevered Pre-Tax Cash Flow
Unlevered pre-tax cash flow is calculated as Corporate EBITDA less non-fleet capital expenditures, net of non-fleet disposals, plus changes in working capital (receivables, excluding car rental receivables, inventories, prepaid expenses, accounts payable and accrued liabilities), cash used for acquisitions, cash used for / provided by other investing activities, cash used / provided by non-debt financing activities and the foreign exchange impact on cash and cash equivalents. Unlevered pre-tax cash flow is important to management and investors as it represents funds available to pay corporate interest and taxes and to grow our fleet or reduce debt.
10. Levered After-Tax Cash Flow Before Fleet Growth
Levered after-tax cash flow before fleet growth is calculated as Unlevered Pre-Tax Cash Flow less corporate net cash interest and corporate cash taxes. Levered after-tax cash flow before fleet growth is important to management and investors as it represents the funds available to grow our fleet or reduce our debt.
11. Corporate Net Cash Interest (used in the calculation of Levered After-Tax Cash Flow Before Fleet Growth)
Corporate net cash interest represents cash paid by the Company during the period for interest expense relating to Corporate Debt. Corporate net cash interest helps management and investors measure the ongoing costs of financing the business exclusive of the costs associated with the fleet financing.
12. Corporate Cash Taxes (used in the calculation of Levered After-Tax Cash Flow Before Fleet Growth)
Corporate cash taxes represents cash paid by the Company during the period for income taxes.
13. Corporate Cash Flow
Corporate cash flow is calculated as Levered After-Tax Cash Flow Before Fleet Growth less equipment rental fleet growth capital expenditures, net of disposal proceeds and less the car rental fleet equity requirement. Corporate cash flow is important to management and investors as it represents the cash available for the reduction of corporate debt.
14. Net Corporate Debt
Net corporate debt is calculated as total debt excluding fleet debt less cash and equivalents and corporate restricted cash. Corporate debt consists of our Senior Term Facility; Senior ABL Facility; Senior Notes; Convertible Senior Notes; and certain other indebtedness of our domestic and foreign subsidiaries. Net Corporate Debt is important to management, investors and ratings agencies as it helps measure our leverage. Net Corporate Debt also assists in the evaluation of our ability to service our non-fleet-related debt without reference to the expense associated with the fleet debt, which is fully collateralized by assets not available to lenders under the non-fleet debt facilities.
15. Corporate Restricted Cash (used in the calculation of Net Corporate Debt)
Total restricted cash includes cash and cash equivalents that are not readily available for our normal disbursements. Total restricted cash and equivalents are restricted for the purchase of revenue earning vehicles and other specified uses under our Fleet Debt facilities, our like-kind exchange programs and to satisfy certain of our self insurance regulatory reserve requirements. Corporate restricted cash is calculated as total restricted cash less restricted cash associated with fleet debt.
16. Net Fleet Debt
Net fleet debt is calculated as total fleet debt less restricted cash associated with fleet debt. As of March 31, 2011, fleet debt consists of U.S. Fleet Variable Funding Notes, U.S. Fleet Medium Term Notes, U.S. Fleet Financing Facility, European Revolving Credit Facility, European Fleet Notes, European Securitization, Canadian Securitization, Australian Securitization Brazilian Fleet Financing and Capitalized Leases relating to revenue earning equipment. This measure is important to management, investors and ratings agencies as it helps measure our leverage.
17. Restricted Cash Associated with Fleet Debt (used in the calculation of Net Fleet Debt and Corporate Restricted Cash)
Restricted cash associated with fleet debt is restricted for the purchase of revenue earning vehicles and other specified uses under our Fleet Debt facilities and our car rental like-kind exchange program.
18. Total Net Debt
Total net debt is calculated as net corporate debt plus net fleet debt. This measure is important to management, investors and ratings agencies as it helps measure our leverage.