Attached files
| file | filename |
|---|---|
| 8-K - FORM 8-K - MOSAIC CO | d8k.htm |
Exhibit 99.1


Market Mosaic is a quarterly newsletter published for our customers, suppliers and stakeholders by the Market and Strategic Analysis group of The Mosaic Company. The spring and fall issues recap our assessment of the near term outlook for agricultural and crop nutrient markets. The summer and winter issues provide an in-depth look at a topic of special interest to our readers.
Michael R. Rahm
Vice President Market and Strategic Analysis
mike.rahm@mosaicco.com
Luis F. Dowling
Manager Market and Strategic Analysis
luis.dowling@mosaicco.com
Joseph Fung
Sr. Market Analyst
joseph.fung@mosaicco.com
Mathew Philippi
Data Analyst
matt.philippi@mosaicco.com
The positive outlook for agricultural commodity and crop nutrient markets remains intact despite the historic events of the last few months. Agricultural commodity prices traded off sharply in mid-March in response to the political upheavals in North Africa and the Mideast, the devastating earthquake, tsunami and nuclear disaster in Japan and the simmering debt crisis in Europe. Traders liquidated long positions based on fears that these events would spike petroleum prices, cripple global economic growth and bridle the demand for soft commodities.
Agricultural commodity prices quickly recovered from this sell-off as the drop in prices brought buyers to the table and markets realized that a record harvest still is required this year just to maintain inventories at current low levels. Fear struck out on this at bat. Fear will step up to the plate a few more times before this year’s crop is in the bin, but we expect that it will swing and miss each time.
Fundamentals have dug into the batter’s box. Agricultural commodity markets today are pricing a long list of potential supply and demand developments including the quantity and quality of the Southern Hemisphere crop, the size of U.S. corn and soybean stockpiles at the end of the current crop year, U.S. winter wheat conditions, planting progress throughout the Northern Hemisphere, the strength and coverage of the Indian monsoon, China’s corn import appetite, petroleum prices and value of the U.S. dollar.
Weather looms large in the on-deck circle. Agricultural commodity markets are expected to be hypersensitive to weather events during the next six months due to low global and North American inventories. If history is any guide, Mother Nature likely will toss a curve ball or two at a few geographies during the upcoming growing season.
Futures markets are flashing signs to farmers to swing for the fences this year. A second disappointing harvest would shrink global inventories to dangerously low levels by the end of the 2011/12 crop year. High agricultural commodity prices and outstanding farm economics worldwide underpin record crop nutrient demand forecasts and the positive outlook for global crop nutrient markets.
Speculative Herd Spooked
Tight fundamentals and sustained price rallies have attracted large speculative interest in agricultural commodities during the last nine months. Several analysts have warned of the dangers of large speculative positions and events during the last few months clearly spooked the speculative herd and caused a stampede out of agricultural commodities in mid-March.
– continued inside
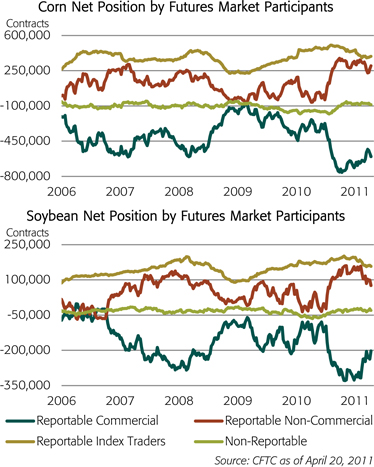
In the case of corn, commodity index traders and large speculators reduced their net long corn positions almost 72,000 contracts or 360 million bushels during the week ending March 15. The nearby corn contract dropped 82 cents per bushel at roughly the same time. In the case of soybeans, these speculative traders sold almost 38,000 contracts or 188 million bushels and the nearby soybean contract lost $1.06 per bushel during the same week.
Agricultural Fundamentals Intact
The drop in agricultural commodity prices was short lived. Most prices recovered quickly from the mid-March selloff and a few even climbed to record highs by mid-April. The drop in prices immediately brought buyers to the table and markets quickly realized that, given continued strong demand prospects, a bin-busting harvest is required this year in order to prevent another large drawdown of global inventories in 2011/12.
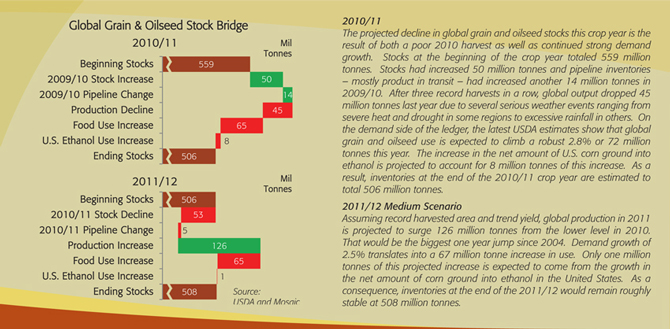
Statistics released by the U.S. Department of Agriculture (USDA) on April 8 showed that global inventories for 16 leading grain and oilseed crops are expected to decline 53 million tonnes to 506 million tonnes or 18.9% of use by the end of the 2010/11 crop year. The charts show our estimate of the range of possibilities for the 2011/12 crop year. The medium scenario assumes that farmers grow a record crop of 2.75 billion tonnes based on record harvested area of 902 million hectares and a record average yield equal to the 11-year trend of 3.05 tonnes per hectare. This crop would easily top the previous peak of 2.67 billion tonnes in 2009. Global grain and oilseed use is assumed to increase 2.5% to 2.74 million tonnes. As a result, grain and oilseed inventories at the end of 2011/12 would remain nearly unchanged at 508 million tonnes or 18.5% of projected use.
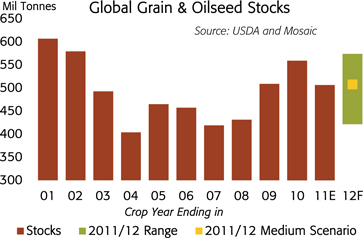
The low scenario for 2011/12 assumes that farmers harvest a crop of 2.66 billion tonnes based on harvested area of 900 million hectares and an average yield of 2.95 tonnes per hectare. The average yield is equal to the 11-year trend less the largest negative deviation from trend since 2000/01. Both the average yield and harvest still would rank as the second largest ever! Global grain and oilseed use is assumed to increase 2.2% to 2.73 billion tonnes due to likely increases in agricultural commodity prices in this scenario. Grain and oilseed inventories drop to just 417 million tonnes or 15.2% of use at the end of the 2011/12 crop year. The only lower percentages in modern history occurred at the end of the 1972/73 and 1973/74 crop years.
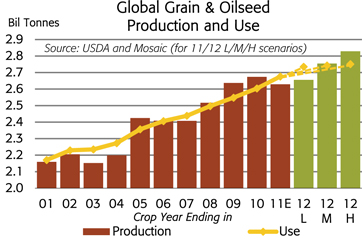

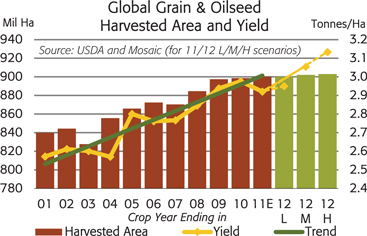
The high scenario assumes that farmers harvest a record-shattering crop of 2.83 billion tonnes based on harvested area of 903 million hectares and an average yield of 3.13 tonnes per hectare. The average yield is equal to the 11-year trend plus the largest positive deviation from trend since 2000/01. This crop would exceed the 2009 record harvest by 155 million tonnes! Global grain and oilseed use is assumed to increase 2.8% to 2.75 million tonnes due to a likely moderation in agricultural commodity prices in this scenario. Grain and oilseed inventories climb to 574 million tonnes or 20.9% of use at the end of the 2011/12 crop year and replenish the large drawdown that occurred in 2010/11.
Extremely Tight U.S. Corn and Soybean Stocks
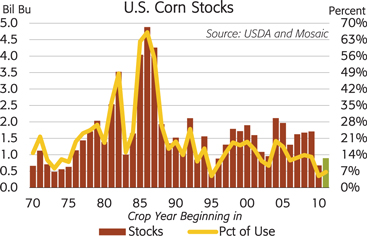
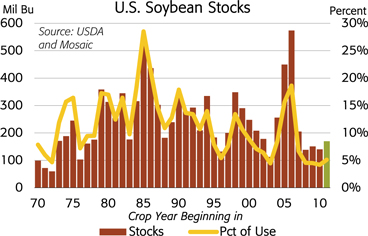
U.S. corn and soybean inventories are projected to decline to extremely low levels by the end of the 2010/11 crop year. Corn stocks are projected to drop to just 5.0% of use, equal to the lowest percentage in modern history, and soybean inventories are projected to drop to just 4.2% of use, the lowest percentage in modern history.
A mammoth corn crop is required this year just to keep the market in balance. For example, if U.S. farmers plant 92.2 million acres of corn (as indicated in the Prospective Plantings survey), if the average yield equals the 11-year trend of 162.3 bushels per acre and if demand remains flat at 13.5 billion bushels, then inventories grow from 675 million bushels at the end of 2010/11 to about 900 million bushels or 6.7% of use at the end of 2011/12. These assumptions would result in a record-smashing harvest of 13.7 billion bushels this year, shattering the previous mark of 13.1 billion bushels in 2009. The modest projected increase in U.S. corn inventories illustrates the thin margin for error this growing season and the likely need for large acreage and record yields again in 2012.
In the case of soybeans, if farmers plant 76.6 million acres this spring (also as indicated in the Prospective Plantings survey), if the average yield equals the 11-year trend of 44.2 bushels per acre and if demand remains at about 3.3 billion bushels, then stocks increase from 140 million bushels at the end of 2010/11 to 170 million bushels or 5.1% of projected use at the end of 2011/12. These assumptions would produce a U.S. soybean crop of 3.34 billion bushels this year or just a whisker less than the record crop of 3.36 billion bushels in 2009.
The Grain Stocks report released by the USDA on March 31 showed lower than expected corn and soybean inventories on March 1 and ignited a powerful rally in the corn market. The closing price of the nearby corn contract surged to $7.60 per bushel on April 4, eclipsing the previous record close of $7.55 per bushel on June 27, 2008.

Markets are sending extremely strong signals to farmers this spring. Both 2011 and 2012 new crop prices for corn, soybeans and wheat are trading at high levels today. In addition, unlike three years ago, prices for nearly all other agricultural commodities such as sugar, cotton, coffee and fruits and vegetables also are trading at high levels and intensifying the competition for acreage this spring.
Record Crop Nutrient Demand Prospects
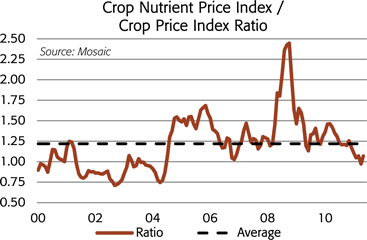
High agricultural commodity prices, profitable farm economics and moderate input costs underpin record crop nutrient demand forecasts. In fact, the ratio of an index of leading crop nutrient prices to an index of major grain and oilseed prices indicates that crop nutrient products are very affordable today. The current ratio of 1.1 is less than the average since 2000 and is far below the peak of almost 2.5 in 2008 when crop nutrient prices surged to extremely high levels relative to grain and oilseed prices.
These strong drivers are evident in the latest demand forecasts from the International Fertilizer Industry Association (IFA). For example, global phosphate use is projected to increase to 41.7 million tonnes P2O5 this year, up 5% or 1.9 million tonnes from last year and up 8% or 3.2 million tonnes from the high level of 2007. Demand growth since the 2007 peak is the equivalent of more than two Ma’aden facilities. World potash use is projected to climb to 29.4 million tonnes this year, up 1% or 400,000 tonnes K2O from the previous record set in 2007. IFA published these forecasts last December and we expect upward revisions in its May forecasts.
In the United States, we project that crop nutrient use will climb 12% in 2010/11 and rival the previous high marks set in 2003/04 and in 2006/07. Phosphate use is projected to increase 14% to 4.8 million tons P2O5 , within spitting distance of recent peaks and up 1.6 million tons P2O5 or the equivalent of almost 3.5 million tons of DAP from the steep drop in 2008/09. Potash use is forecast to jump 35% to 5.4 million tons this year, also in the same neighborhood as peak usage during the past 15 years.
| U.S. Planted Acreage and Nutrient Demand | ||||||||||||||||||||||||||||||||||||
| CropYr Begin |
Planted Acres (million) | (million tons) | ||||||||||||||||||||||||||||||||||
| Corn | Wheat | Beans | Cotton | Other | Total | N | P | K | ||||||||||||||||||||||||||||
| 2004 |
80.9 | 59.6 | 75.2 | 13.7 | 92.9 | 322.3 | 13.0 | 4.8 | 5.5 | |||||||||||||||||||||||||||
| 2005 |
81.8 | 57.2 | 72.0 | 14.2 | 92.4 | 317.6 | 12.3 | 4.6 | 5.2 | |||||||||||||||||||||||||||
| 2006 |
78.3 | 57.3 | 75.5 | 15.3 | 89.2 | 315.6 | 12.0 | 4.5 | 4.7 | |||||||||||||||||||||||||||
| 2007 |
93.5 | 60.5 | 64.7 | 10.8 | 90.8 | 320.4 | 13.2 | 4.6 | 5.1 | |||||||||||||||||||||||||||
| 2008 |
86.0 | 63.2 | 75.7 | 9.5 | 90.6 | 325.0 | 12.6 | 4.2 | 4.7 | |||||||||||||||||||||||||||
| 2009 |
86.4 | 59.2 | 77.5 | 9.1 | 87.1 | 319.3 | 11.4 | 3.2 | 3.1 | |||||||||||||||||||||||||||
| 2010E |
88.2 | 53.6 | 77.4 | 11.0 | 86.5 | 316.7 | 12.6 | 4.2 | 4.0 | |||||||||||||||||||||||||||
| 2011F |
92.2 | 58.0 | 76.6 | 12.6 | 84.5 | 323.8 | 13.1 | 4.8 | 5.4 | |||||||||||||||||||||||||||
Source: USDA, AAPFCO and Mosaic
These forecasts are based on acreage estimates from the Prospective Plantings report and the assumption of above-average P&K application rates this year. A number of reports suggest that many farmers are rebuilding P&K levels in their soils this year after letting them slip particularly when crop nutrient prices were high relative to crop prices.
We asked more than 240 representatives from leading North American crop nutrient distribution companies who attended Mosaic AgCollege last January whether farmers were applying below replacement, replacement or above replacement rates of phosphorus and potassium during the outstanding application season last fall. In the case of phosphate, respondents indicated that 39% of farmer customers were applying more than replacement rates and 51% were applying replacement rates. In the case of potash, respondents indicated that 35% of farmer customers were applying more than replacement rates and 54% were applying replacement rates.
P: Surging Demand – Uncertain Supply
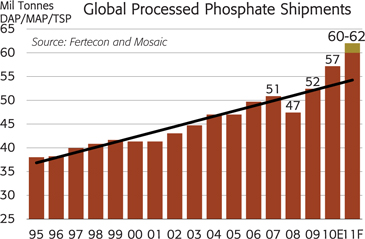
Surging demand once again has tightened the global market and pulled up prices of the leading phosphate products. Global shipments of finished phosphate products (DAP/MAP/MES/TSP) are forecast to increase to a record 60 to 62 million tonnes in 2011, up from 57 million tonnes last year. World trade is forecast to increase 6% or 1.5 million tonnes to a record 27 million tonnes in 2011.
Indian consumption and imports are projected to remain at high levels this year. India is expected to account for about 30% of global trade, but other Asian countries, Oceania and Latin America are projected to account for most of the projected growth in global trade in 2011.
In India, DAP consumption is forecast to increase to a record 11.6 million tonnes in 2011/12, up 5% from 11.1 million tonnes in 2010/11. DAP imports are projected to total between 7.6 and 7.8 million tonnes in 2011/12, up slightly from 7.5 million tonnes in 2010/11. PhosChem commenced shipments to Indian customers in April following settlement of 2011/12 contract prices at $612 per tonne c&f Indian port. Three vessels had shipped by the end of the month.
While prospects in India look stable, imports by other countries in Asia and Oceania are expected to increase significantly this year due to favorable agronomic conditions and profitable farm economics for key crops grown in this region. Imports by these countries are projected to climb to 4.7 to 4.9 million tonnes in 2011, up from 4.5 million tonnes in 2010.
In Latin America, imports also are forecast to increase to 6.0 to 6.2 million tonnes this year, up from 5.6 million tonnes in 2010. In Brazil, total fertilizer shipments are projected to climb to a record 26.0 million tonnes and phosphate imports are expected to increase to 3.3 to 3.5 million tonnes, up from 2.8 million tonnes last year.
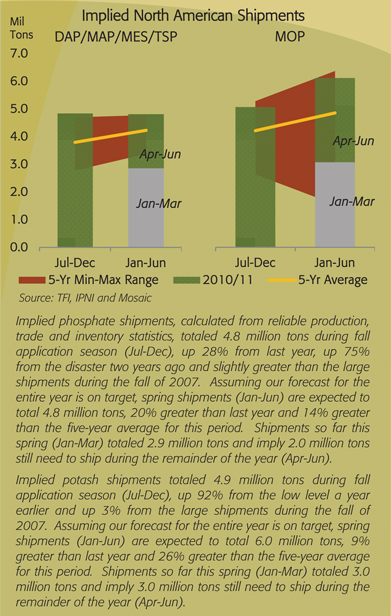
In North America, DAP/MAP/MES/TSP shipments are expected to climb to 9.7 million tons during the fertilizer year that will end on June 30, 2011. The chart shows that movement last fall (Jul-Dec) was outstanding and that large shipments also are required this spring (Jan-Jun). Shipments are forecast to remain close to this level again in 2011/12.
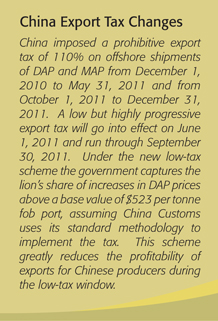
On the supply side, several uncertainties still overhang the global phosphate market. The first is the quantity of DAP/MAP/ TSP exports from China this year. China provided the surge capacity to meet the large jump in import demand in 2010. In fact, China exported a record 6.1 million tonnes in 2010, up 2.5 million tonnes from 2009 and up 1.1 million tonnes from the previous record of 5.0 million tonnes in 2007. China supplied two-thirds of the 3.8 million tonne surge in global import demand last year. Global import demand is forecast to grow another 1.5 million tonnes in 2011 and it is not clear how much product Chinese producers will export this summer due to the narrower low-tax window as well as the new highly progressive rates during the low-tax window.
A second uncertainty is the start-up of the Ma’aden facility in Saudi Arabia. Ma’aden has pushed back commercial start-up of this facility to the last half of 2011. The market expects significant tonnage from this new facility during the second half of this year so further delays will surprise the market.
Finally, the political turmoil in several North African and Mideast countries has reduced the availability of phosphate rock and finished phosphate products from significant suppliers including Tunisia, Egypt and Syria during the first half of 2011. How the political situations play out in these and other countries in the region could continue to impact phosphate production and exports this year.

Record Demand Tests Potash Supply Capabilities
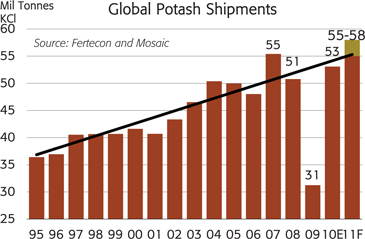
Demand growth once again is expected to test the supply capabilities of potash producers in 2011. Global muriate of potash (MOP) shipments are forecast to increase to a record 55 to 58 million tonnes this year, up from 53 million tonnes last year. Global MOP trade is projected to climb to 35 to 37 million tonnes in 2011, up from 35 million tonnes in 2010.
In Brazil, MOP imports are projected to increase to 6.6 to 7.0 million tonnes, up from 6.0 million tonnes last year. Imports this year are expected to exceed the previous record of 6.7 million tonnes in 2007. High soybean and sugar prices as well as thin channel inventories boost demand and shipment prospects this year.
In India, MOP imports are forecast to remain at high levels despite the recent announcement that the government and crop nutrient industry were prepared to take a potash holiday if they could not achieve their price objective for 2011/12 contracts. We estimate that India will import 6.2 to 6.7 million tonnes of MOP in 2011, in line with imports of 6.3 million tonnes in 2010. Farm economics here remain as strong as anywhere in the world due to the combination of high commodity prices and low retail crop nutrient prices.
In China, MOP imports are forecast to total 5.8 to 6.2 million tonnes this year, up from 5.2 million tonnes last year and up from just 1.5 million tonnes in 2009. However, imports remain far below previous peaks of 9.4 million tonnes in 2007 and 8.7 million tonnes in 2005.
In Indonesia and Malaysia, MOP imports are projected to climb to a record 4.0 to 4.2 million tonnes this year, up from 3.9 million tonnes in 2010. Highly profitable palm oil economics are the key demand driver.
In North America, MOP shipments are projected to climb 36% to 10.9 million tons in 2010/11 and remain close to this level in 2011/12. The 10-year Olympic average is 10.2 million tons. Above average shipments are projected this year due to the expected increase in planted acreage as well as higher application rates. Statistics for the first nine months of the crop nutrient year indicate that North American potash shipments are on track to reach this forecast.
Producers have ramped up production to meet robust domestic and offshore demand this year. For example, North American MOP production during the first nine months of the crop nutrient year totaled 14.5 million tons, up 62% from the lower levels a year earlier. Inventories held by North American producers on March 31 were down 7% from a year earlier and off 26% from a five-year average for this date. Strong demand prospects coupled with low inventories is expected to test the production and logistical capabilities of potash producers in 2011.