Attached files
| file | filename |
|---|---|
| 8-K - FORM 8-K - OMNICARE INC | form8k-q1.htm |
| EX-99.1 - EXHIBIT 99.1 - OMNICARE INC | exhibit99-1.htm |

First Quarter 2011
Financial Results
Financial Results
Supplemental Slides
Exhibit 99.2

Forward-Looking Statements
Except for historical information discussed, the statements made today and
listed within the following presentation slides are forward-looking statements
that involve risks and uncertainties. Investors are cautioned that such
statements are only predictions and that actual events or results may differ
materially.
listed within the following presentation slides are forward-looking statements
that involve risks and uncertainties. Investors are cautioned that such
statements are only predictions and that actual events or results may differ
materially.
These forward-looking statements speak only as of the date this
presentation was originally given. We undertake no obligation to publicly
release the results of any revisions to the forward-looking statements made
today, to reflect events or circumstances after today or to reflect the
occurrence of unanticipated events.
presentation was originally given. We undertake no obligation to publicly
release the results of any revisions to the forward-looking statements made
today, to reflect events or circumstances after today or to reflect the
occurrence of unanticipated events.
To facilitate comparisons and enhance understanding of core operating
performance, certain financial measures have been adjusted from the
comparable amount under Generally Accepted Accounting Principles
(GAAP). A detailed reconciliation of adjusted numbers to GAAP is posted
the Investor Relations section of our Web site at http://ir.omnicare.com.
Additionally, all amounts are presented on a continuing operations basis,
unless otherwise stated.
2

Table of Contents
First Quarter 2011 Highlights…………………………………………..……..
Operating Metrics - Script Data……………………………………………….
Operating Metrics - Bed Data…………………………………………………
Adjusted Gross Profit………………...…………………………………..…...
Adjusted Net Income………………………………………………..…………
Cash Flows………………………………………………………………..……
Cash Deployment……….………..……………………………………………
Capital Structure……………………………………………………………….
2011 Guidance………..…...…………………………………………………..
Longer-Term Targets………………………………………………….....……
Appendix……………………………………………………………….………..
Working Capital Management………………………………………………..
Selected Branded Drug Patent Expirations…………………………….......
Regulatory Environment…………………………….…………………………
4
5
6
7
8
9
10
11
12
13
14
15
16
17
3

First Quarter 2011 Highlights
• Scripts increased 1.5% over 1Q10; sequential scripts slightly lower due to
fewer days in the period
fewer days in the period
– Utilization increased sequentially while census was stable
– Generic dispensing rate increased120 basis points sequentially
• Qtr. ending number of beds served(1) up 4,000 sequentially
– Patient assistance programs up 9,000; Long Term Care beds 4,000 lower
– 9,000 organic net bed loss in Long Term Care, excluding acquisitions, was
favorable to 4Q10 organic loss of 16,000
favorable to 4Q10 organic loss of 16,000
• Gross profit slightly higher sequentially to $337.9M and gross margin
increased 20 bps on relatively even sales
increased 20 bps on relatively even sales
• Adjusted EPS(2) of $0.52 as compared to 4Q10 of $0.54 and 1Q10 of $0.59
• Operating cash flows from continuing operations up 44.3% sequentially,
22.3% year-over-year to $143.9M, benefiting from lower inventory than at
year end
22.3% year-over-year to $143.9M, benefiting from lower inventory than at
year end
• $32.4 million returned to shareholders by share repurchases and dividends
4
(1) Includes patients served under patient assistance programs
(2) Excludes special items. A reconciliation of non-GAAP information has been attached to our press release and is also available on our Web site under
‘Supplemental Financial Information’ from the ‘Investors’ page.
‘Supplemental Financial Information’ from the ‘Investors’ page.
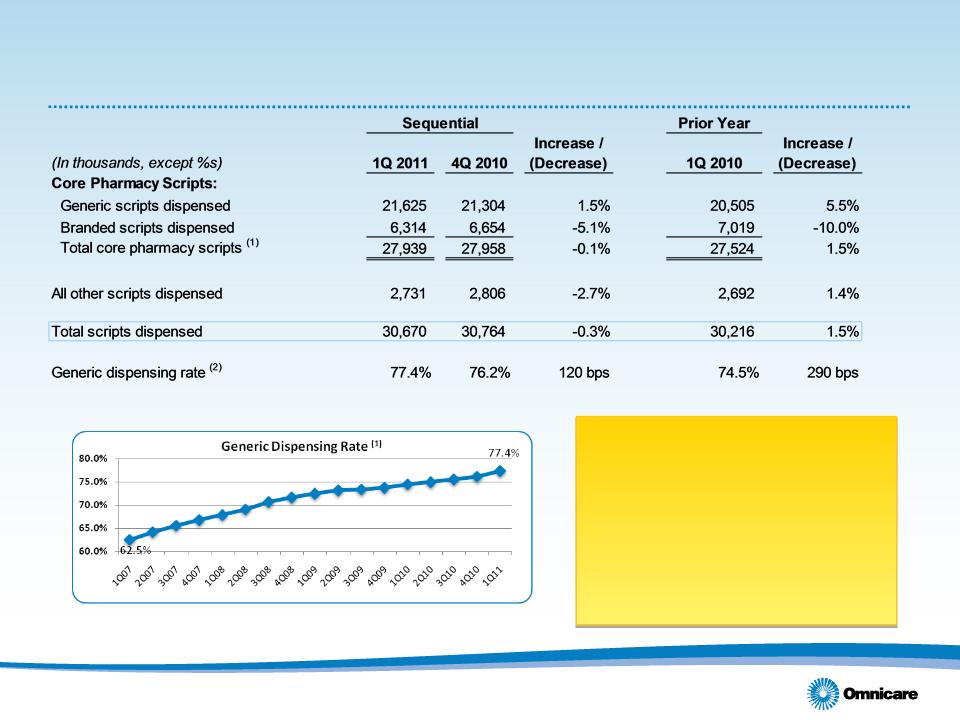
Operating Metrics
Script Data
Script Data
5
(1) Excludes scripts dispensed in Omnicare’s specialty businesses and other non-institutional settings.
(2) Generic prescriptions dispensed as a percentage of institutional pharmacy scripts.
• Scripts up 1.5% as compared with 1Q10 as
the result of increased utilization
the result of increased utilization
• Sequentially, scripts were 0.3% lower due
to fewer days in 1Q11 vs. 4Q10
to fewer days in 1Q11 vs. 4Q10
• Census was relatively even with 4Q10
• Generic dispensing rate climbed 120 bps
sequentially to 77.4% due largely to
conversion of branded Aricept to generic
Donepezil
sequentially to 77.4% due largely to
conversion of branded Aricept to generic
Donepezil

Operating Metrics
Bed Data
Bed Data
6
(1) Beds reported as capacity in institutional settings and unique patients serviced in non-institutional settings (clinic, retail, hospice)
(2) PAP programs served by Omnicare’s specialty pharmacy business.
• Organic additions increased compared to 4Q10. Overall additions lower
sequentially due to decline in beds added by acquisitions on a sequential basis
sequentially due to decline in beds added by acquisitions on a sequential basis
• 11.5% sequential improvement in bed losses, 50 bps sequential improvement in
customer retention rate to 92.4%
customer retention rate to 92.4%
• Beds added by acquisition:
• 1Q11 - 3,000
• 4Q10 - 12,000
• 1Q10 - 3,000

Adjusted Gross Profit (1)
7
(1) Each amount is reported independently. The sum of the individual amounts may not equal the sum of the separately presented amounts due to rounding.
(2) Excludes special items. A reconciliation of non-GAAP information has been attached to our press release and is also available on our Web site under
‘Supplemental Financial Information’ from the ‘Investors’ page.
‘Supplemental Financial Information’ from the ‘Investors’ page.
(3) Includes all scripts dispensed in the Company’s Pharmacy Services.

Adjusted Net Income (1),(2)
8
(1) All numbers shown exclude special items and discontinued operations. A reconciliation of non-GAAP information has been attached to our press release
and is also available on our Web site under ‘Supplemental Financial Information’ from the ‘Investors’ page.
and is also available on our Web site under ‘Supplemental Financial Information’ from the ‘Investors’ page.
(2) Each amount is reported independently. The sum of the individual amounts may not equal the sum of the separately presented amounts due to rounding.
(3) The 4Q 2010 period has been computed using basic weighted average shares outstanding due to the GAAP net loss incurred in the period.

Cash Flows(1)
9
• Sequential increase in operating cash flow reflects decreases in working capital (primarily driven by a decrease
in inventory levels and a decrease in DSOs of approximately 2 days)
in inventory levels and a decrease in DSOs of approximately 2 days)
(1) Each amount is reported independently. The sum of individual amounts may not equal the sum of the separately presented amounts due to rounding.

Cash Deployment
10
(1) During the first quarter of 2011, Omnicare repurchased $125 million of 6.125% senior subordinated notes due 2013. During the first quarter of 2010,
Omnicare repurchased $75 million of senior term A loans due 2010.
Omnicare repurchased $75 million of senior term A loans due 2010.
(2) Cumulative % Returned = (Dividends Paid + Share Repurchases) / 12/31/10 Market Capitalization of $2,961.0 million.
• Repurchased an additional 1.0
million shares ($28.7 million) during
1Q11 (in addition to 4.4 million
shares repurchased in 2010)
million shares ($28.7 million) during
1Q11 (in addition to 4.4 million
shares repurchased in 2010)
• $68.4 million of authorization
remaining under current share
repurchase program as of Mar. 31,
2011.
remaining under current share
repurchase program as of Mar. 31,
2011.
• 1Q11 dividend of $0.0325 per
share
share

(1) Assumes convertible debentures due 2035 are put to the company in 2015 with related tax recapture included and debt
amounts shown are exclusive of unamortized debt discount.
amounts shown are exclusive of unamortized debt discount.
Capital Structure
Recent capital restructuring initiatives have extended maturities,
providing more flexibility for capital allocation strategies
11

2011 Guidance
12
(1) Guidance provided on February 24, 2011
(2) Guidance provided on April 28, 2011.
(3) Excludes special items and discontinued operations.
|
|
Previous Guidance
(1) |
Current Guidance (2)
|
|
• Revenues
|
$6.0B to $6.1B
|
$6.0B to $6.1B
|
|
• Adjusted Diluted EPS (3)
|
$2.05 to $2.15
|
$2.05 to $2.15
|
|
• Cash Flow from Operations (3)
|
$375M to $425M
|
$375M to $425M
|
Reaffirming full-year earnings per diluted share guidance(1) of $2.05 to $2.15(3)
with stronger financial performance expected in the 2nd half of the year

Longer-Term Targets (1)
13
We believe investments made in 2011 will position the
company to begin achieving some of these targets in 2012
company to begin achieving some of these targets in 2012
(1) Not intended to represent expectations for any given year.
(2) Board approval required for share repurchases and/or dividends. The number could vary by year based on available acquisitions and capital
expenditure plans.
expenditure plans.
|
|
Target
|
|
• Adjusted Diluted EPS
|
Double digit three-year CAGR
for the year ending 2013
|
|
• Cash Flow from Operations
|
$450 million annually
|
|
• Capital Returned to Shareholders
|
Approximately 25% per year (2)
|
|
• Capital Structure
|
Focus on continued debt reduction,
management of maturity schedules
|

Appendix
14

15
16
(1) All generic launches are subject to change due to litigation or pediatric exclusivity.
(2) Drugs already launched shown in gray and italics
|
1Q 2011
|
2Q-4Q 2011
|
FY 2012
|
|
Lotrel
|
Aromasin
|
Actos
|
|
Rythymol SR
|
Concerta
|
Diovan
|
|
Vfend
|
Fazaclo
|
Geodon
|
|
Tricor
|
Femara
|
Invega
|
|
Xalatan
|
Ferrlecit
|
Lexapro
|
|
Neurontin
|
Gabitril
|
Lidoderm
|
|
|
Levaquin
|
Plavix
|
|
|
Lipitor
|
Seroquel
|
|
|
Nasacort AQ
|
Singulair
|
|
|
Primaxin
|
Xopenex
|
|
|
Uroxatrol
|
|
|
|
Zyprexa
|
|
Selected Branded Drug Patent Expirations (1),(2)

Regulatory Environment
Current Issues
Current Issues
• Short-cycle dispensing
– Final rule issued on April 4, 2011, requiring 14-day dispensing for branded drugs
dispensed under Medicare Part D beginning January 1, 2013
dispensed under Medicare Part D beginning January 1, 2013
– Pertains only to SNFs (assisted living and other chronic care facilities excluded)
– Oral solids only (exclusion of liquids, creams, gels, ointments, etc.)
– Expected to result in an additional 2.3 million scripts dispensed
• Federal Upper Limit (“FUL”) definitions
– No less than 175% of the weighted average manufacturer’s price (“AMP”)
– Effective 10/1/10 (the first FUL list has not yet been published)
– Could potentially impact some Medicaid reimbursement, facility pricing
– Nearly all Part D contracts restructured to another reimbursement benchmark
– In most cases, new FULs would have to be lower than MACs to impact
reimbursement for relevant payers
reimbursement for relevant payers
Anticipate small negative to Omnicare beginning in 2013
17
Anticipate small negative to Omnicare in 2011

First Quarter 2011
Financial Results
Financial Results
Supplemental Slides