Attached files
| file | filename |
|---|---|
| 8-K - KAI FORM 8-K 4-28-2011 - KADANT INC | kaiform8k4282011.htm |

First Quarter 2011 Business Review
Jonathan W. Painter, President & CEO
Thomas M. O’Brien, Executive Vice President & CFO

© 2011 Kadant Inc. KAI 1Q11 Business Review - April 28, 2011
Forward-Looking Statements
The following constitutes a “Safe Harbor” statement under the Private Securities Litigation
Reform Act of 1995: This presentation contains forward-looking statements that involve a
number of risks and uncertainties, including forward-looking statements about our expected
future financial and operating performance, demand for our products, and industry and
economic outlook. Important factors that could cause actual results to differ materially from
those indicated by such statements are set forth under the heading “Risk Factors” in
Kadant’s annual report on Form 10-K for the period ended January 1, 2011. These include
risks and uncertainties relating to our dependence on the pulp and paper industry;
significance of sales and operation of manufacturing facilities in China; our ability to expand
capacity in China to meet demand; commodity and component price increases or
shortages; international sales and operations; competition; soundness of suppliers and
customers; our effective tax rate; future restructurings; soundness of financial institutions;
our debt obligations; restrictions in our credit agreement; litigation and warranty costs
related to our discontinued operation; our acquisition strategy; protection of patents and
proprietary rights; fluctuations in our share price; and anti-takeover provisions. We
undertake no obligation to publicly update any forward-looking statement, whether as a
result of new information, future events, or otherwise.
2

© 2011 Kadant Inc. KAI 1Q11 Business Review - April 28, 2011
Use of Non-GAAP Financial Measures
In addition to the financial measures prepared in accordance with generally accepted
accounting principles (GAAP), we use certain non-GAAP financial measures, including
increases or decreases in revenues excluding the effect of foreign currency translation,
adjusted operating income, earnings before interest, taxes, depreciation, and amortization
(EBITDA), and adjusted EBITDA.
accounting principles (GAAP), we use certain non-GAAP financial measures, including
increases or decreases in revenues excluding the effect of foreign currency translation,
adjusted operating income, earnings before interest, taxes, depreciation, and amortization
(EBITDA), and adjusted EBITDA.
A reconciliation of those numbers to the most directly comparable U.S. GAAP financial
measures is shown in our 2011 first quarter earnings press release issued April 27, 2011,
which is available in the Investors section of our website at www.kadant.com under the
heading Investors News.
measures is shown in our 2011 first quarter earnings press release issued April 27, 2011,
which is available in the Investors section of our website at www.kadant.com under the
heading Investors News.
3

© 2011 Kadant Inc. KAI 1Q11 Business Review - April 28, 2011
Financial Classifications
All geographic revenues and bookings data are attributed to regions based on selling
locations. For North America and China, this also approximates revenues and bookings
based on where the equipment is shipped to and installed. Our European geographic data,
however, includes revenues and bookings that may be shipped to and installed outside
Europe, including South America, Africa, the Middle East, and certain countries in Asia
(excluding China).
Prior period amounts for Parts and Consumables revenues and bookings have been
reclassified to include amounts from our “other” category within the Papermaking Systems
segment and Fiber-based products.
reclassified to include amounts from our “other” category within the Papermaking Systems
segment and Fiber-based products.
Our Accessories product line is now being reported as Doctoring.
4

© 2011 Kadant Inc. KAI 1Q11 Business Review - April 28, 2011
Business Review
Jonathan W. Painter
President & CEO
5

© 2011 Kadant Inc. KAI 1Q11 Business Review - April 28, 2011
Q1 2011 Financial Highlights: Revenues
• $71.7 million, up 17% compared to Q1 2010
• All product lines saw increases compared to Q1 2010
– Stock-Preparation up 31%
– Fluid-Handling up 13%
– Doctoring up 13%
– Water-Management up 5%
– Fiber-based Products up 14%
• All product lines except Stock-Preparation were up
sequentially over Q4 2010
sequentially over Q4 2010
6

© 2011 Kadant Inc. KAI 1Q11 Business Review - April 28, 2011
Financial Highlights
Q1 2011 Q1 2010
Revenues $71.7 million $61.1 million
Gross margins 47.6% 44.0%
Diluted EPS $0.47 $0.29
Adjusted EBITDA $10.2 million $6.0 million
Adjusted EBITDA/Sales 14% 10%
7

© 2011 Kadant Inc. KAI 1Q11 Business Review - April 28, 2011
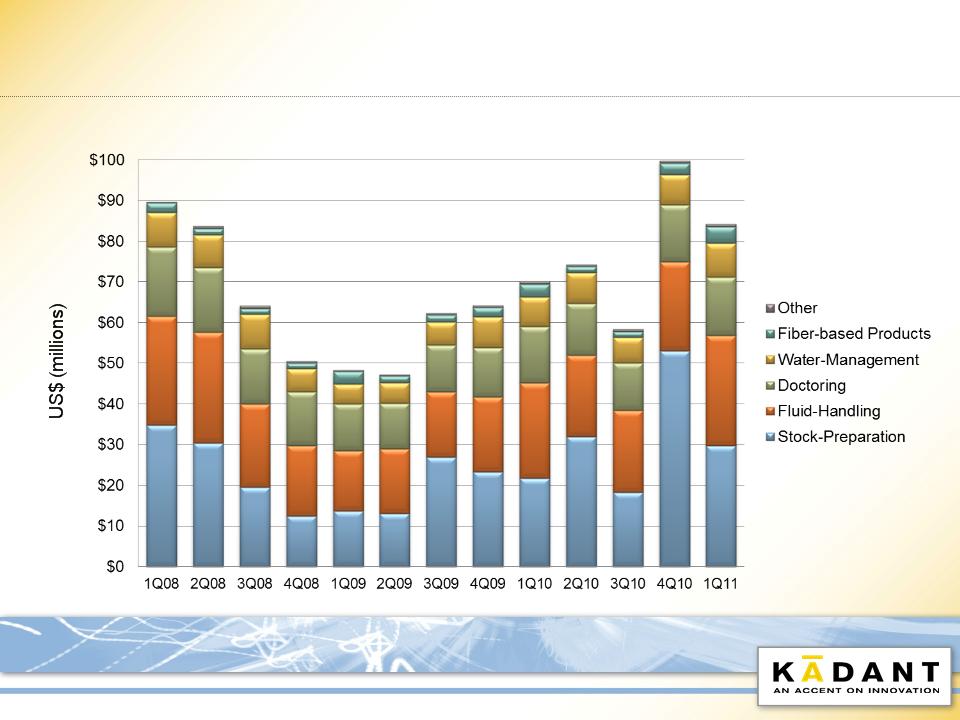
Q1 2011 Financial Highlights: Bookings
• $84.3 million, up 20% compared to Q1 2010
• Q1 booking performance
– Stock-Preparation up 37%
– Fluid-Handling up 15%
– Water-Management up 15%
– Doctoring up 4%
– Fiber-based Products up 25%
8
© 2011 Kadant Inc. KAI 1Q11 Business Review - April 28, 2011
Quarterly Bookings Trend
9
© 2011 Kadant Inc. KAI 1Q11 Business Review - April 28, 2011
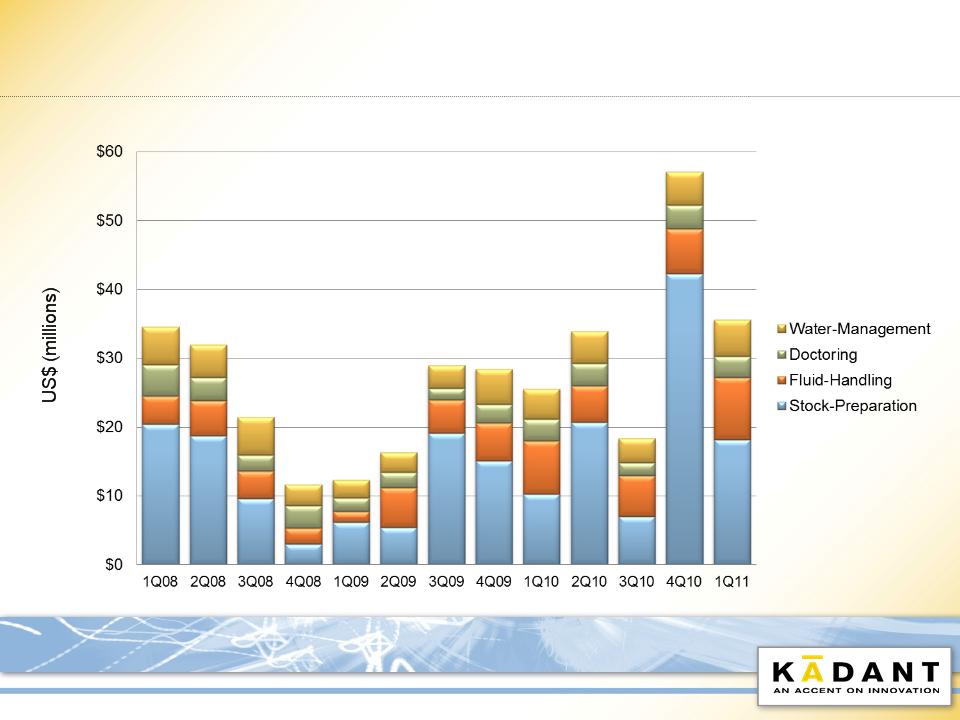
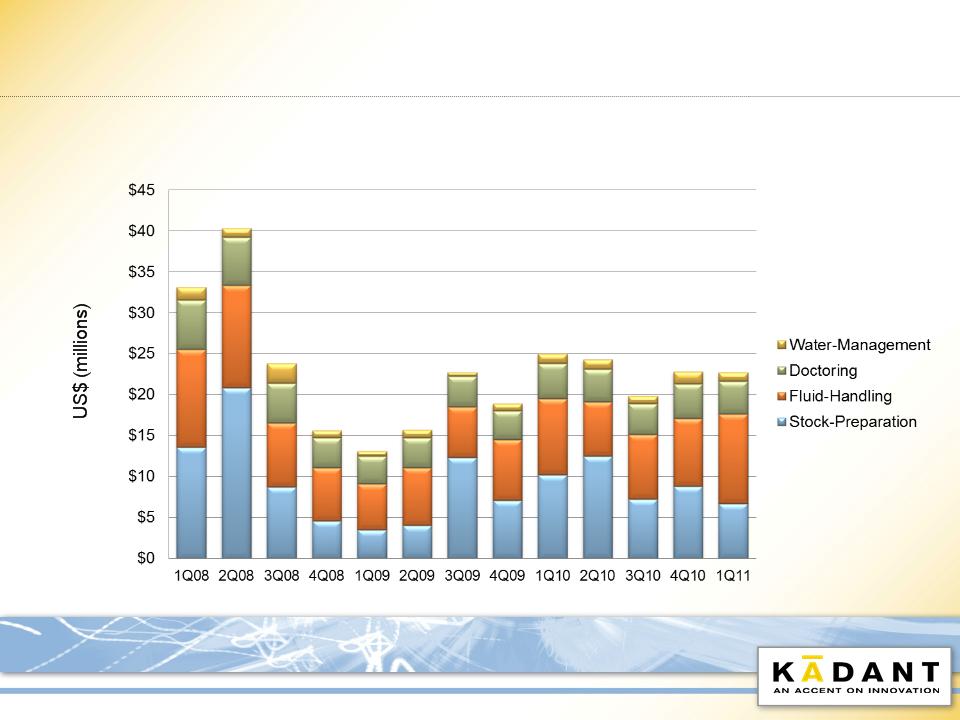
Capital Bookings
10
© 2011 Kadant Inc. KAI 1Q11 Business Review - April 28, 2011
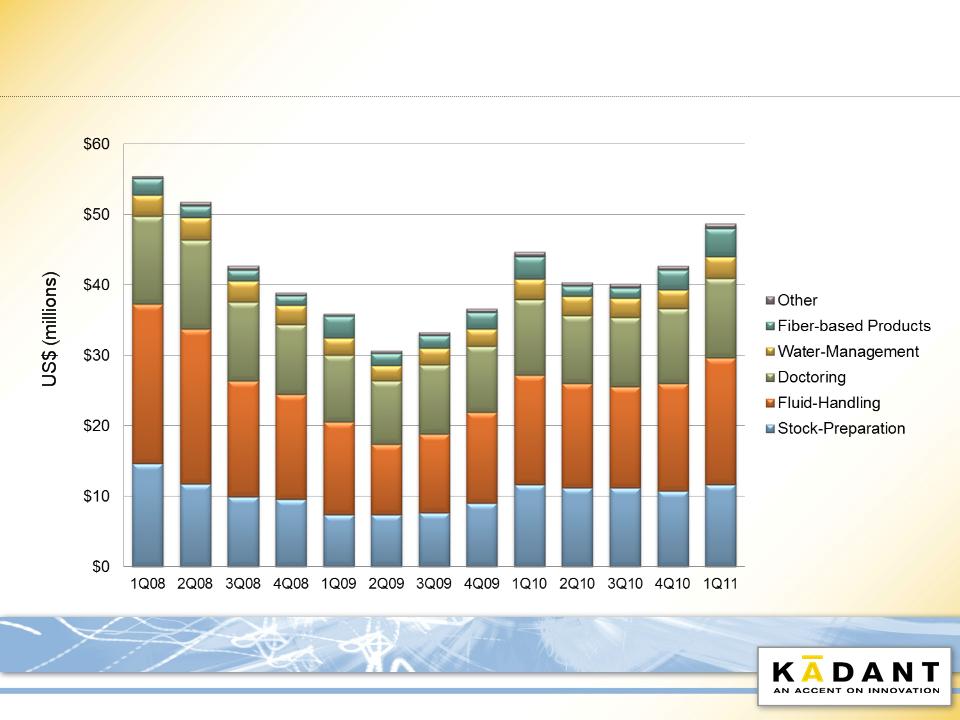
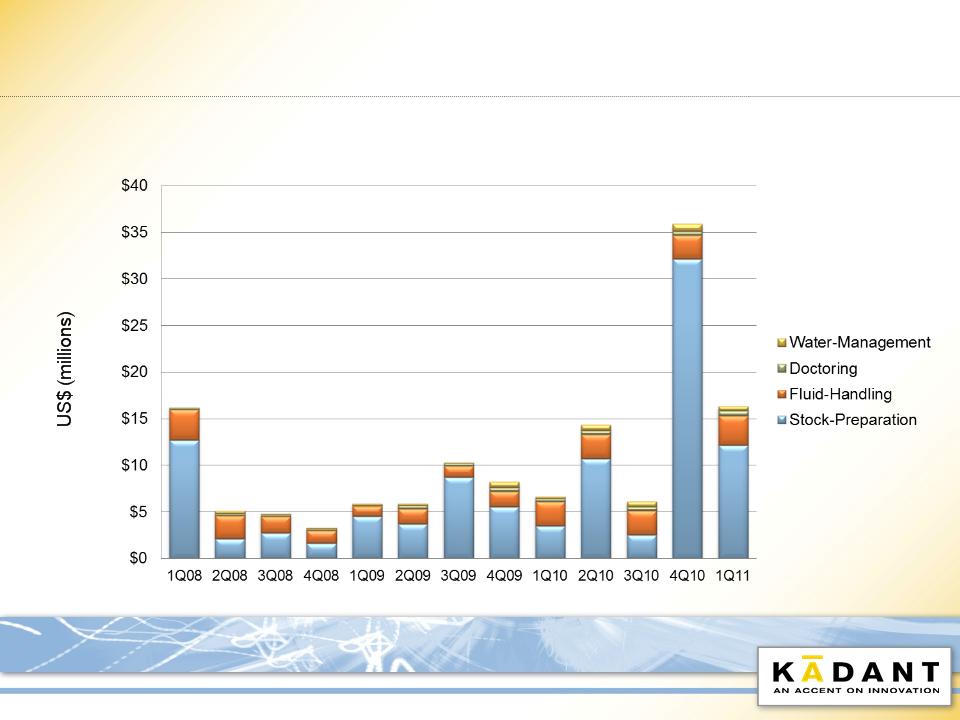
Parts and Consumables Bookings
11

© 2011 Kadant Inc. KAI 1Q11 Business Review - April 28, 2011
Market Review
12

© 2011 Kadant Inc. KAI 1Q11 Business Review - April 28, 2011
North America Paper Industry Trends
• Q1 operating rates remained high in Containerboard
• Printing & Writing grades continue to be under pressure
• Rising energy, freight, and fiber cost
• Capital spending up from 2010, energy-driven projects
high on project list
high on project list
13
© 2011 Kadant Inc. KAI 1Q11 Business Review - April 28, 2011
North America Bookings
$42.4 million, up 16% compared to Q1 2010
14
© 2011 Kadant Inc. KAI 1Q11 Business Review - April 28, 2011
Highlighted Q1 North America Bookings
• OCC system upgrade for
containerboard producer in the
Southeastern U.S.
containerboard producer in the
Southeastern U.S.
• Steam system rebuild for
packaging producer in Ontario,
Canada
packaging producer in Ontario,
Canada
• Multiple doctor systems sold to
a leading U.S. steel producer in
the Midwest
a leading U.S. steel producer in
the Midwest
15

© 2011 Kadant Inc. KAI 1Q11 Business Review - April 28, 2011
Europe Paper Industry Trends
• Containerboard inventories remained at historically low levels
• Pricing remains relatively high
• Demand for packaging grades still strong, but could weaken
if industrial production or exports soften
if industrial production or exports soften
• Operating rates expected to be negatively impacted by
proactive supply side management
proactive supply side management
16
© 2011 Kadant Inc. KAI 1Q11 Business Review - April 28, 2011
European Bookings
$22.7 million, down 9% compared to Q1 2010
17

© 2011 Kadant Inc. KAI 1Q11 Business Review - April 28, 2011
Highlighted Q1 European Bookings
• Creping blade holders order for six
tissue machines from a Europe-
based OEM
tissue machines from a Europe-
based OEM
• Steam system and related drying
hardware for a corrugated board
machine in Finland
hardware for a corrugated board
machine in Finland
• Dryer system rebuild and drying
equipment for a corrugated board
mill in Ukraine
equipment for a corrugated board
mill in Ukraine
18

© 2011 Kadant Inc. KAI 1Q11 Business Review - April 28, 2011
China Paper Industry Trends
• Price movements are mixed due to oversupply and input costs
• Demand has weakened, but outlook remains relatively strong
• Machine start-ups being “strategically” delayed by a few months
• Capacity additions continue to be announced
19
© 2011 Kadant Inc. KAI 1Q11 Business Review - April 28, 2011
China Bookings
$16.3 million, up 146% compared to Q1 2010
20
© 2011 Kadant Inc. KAI 1Q11 Business Review - April 28, 2011
Highlighted Q1 China Bookings
• Eight stock prep systems orders from
China with a combined value of $11.5
million for OCC and approach flow
equipment
China with a combined value of $11.5
million for OCC and approach flow
equipment
• Drying and showering equipment for five
new paper machines from China-based
paper machine OEM
new paper machines from China-based
paper machine OEM
• 13 doctor systems for a boxboard
producer in Jiangsu Province in
eastern China
producer in Jiangsu Province in
eastern China
21

© 2011 Kadant Inc. KAI 1Q11 Business Review - April 28, 2011
Guidance for Continuing Operations
• FY 2011 revenues of $315 to $325 million
• FY 2011 GAAP diluted EPS of $2.15 to $2.25
• Q2 2011 revenues of $78 to $80 million
• Q2 2011 GAAP diluted EPS of $0.54 to $0.56
22

© 2011 Kadant Inc. KAI 1Q11 Business Review - April 28, 2011
Financial Review
Thomas M. O’Brien
Executive Vice President and
Chief Financial Officer
Chief Financial Officer
23

© 2011 Kadant Inc. KAI 1Q11 Business Review - April 28, 2011
1Q11 Revenues Summary
• Consolidated Revenues = $71.7 million
– 17% increase vs. 1Q10
– Includes 2% favorable foreign currency translation
• Revenue Guidance = $71 to $73 million
– Higher Doctoring, Fiber-based Products and Fluid-Handling
revenues
revenues
– Lower Stock-Preparation and Water-Management revenues
24
© 2011 Kadant Inc. KAI 1Q11 Business Review - April 28, 2011
1Q11 and 1Q10 Revenues by Product Line
* Percent change excluding the effect of currency translation
|
|
|
|
% Change
|
|
|
|
|
|
Qtr to
|
Excl.
|
|
($ Millions)
|
1Q11
|
1Q10
|
Qtr
|
FX*
|
|
Stock-Preparation
|
$ 23.3
|
$ 17.8
|
31%
|
30%
|
|
Doctoring
|
14.1
|
12.5
|
13%
|
11%
|
|
Water-Management
|
6.8
|
6.5
|
5%
|
3%
|
|
Other
|
0.7
|
0.6
|
8%
|
2%
|
|
Papermaking Systems Segment
|
67.5
|
57.5
|
18%
|
16%
|
|
Fiber-based Products
|
4.2
|
3.6
|
14%
|
14%
|
|
Total
|
$ 71.7
|
$ 61.1
|
17%
|
16%
|
25

© 2011 Kadant Inc. KAI 1Q11 Business Review - April 28, 2011
1Q11 and 4Q10 Revenues by Product Line
* Percent change excluding the effect of currency translation
|
|
|
|
% Change
|
|
|
|
|
|
Qtr to
|
Excl.
|
|
($ Millions)
|
1Q11
|
4Q10
|
Qtr
|
FX*
|
|
Stock-Preparation
|
$ 23.3
|
$ 28.9
|
-19%
|
-19%
|
|
Doctoring
|
14.1
|
13.8
|
2%
|
1%
|
|
Water-Management
|
6.8
|
6.6
|
4%
|
3%
|
|
Other
|
0.7
|
0.6
|
16%
|
13%
|
|
Papermaking Systems Segment
|
67.5
|
71.5
|
-6%
|
-6%
|
|
Fiber-based Products
|
4.2
|
1.8
|
136%
|
136%
|
|
Total
|
$ 71.7
|
$ 73.3
|
-2%
|
-3%
|
26
© 2011 Kadant Inc. KAI 1Q11 Business Review - April 28, 2011
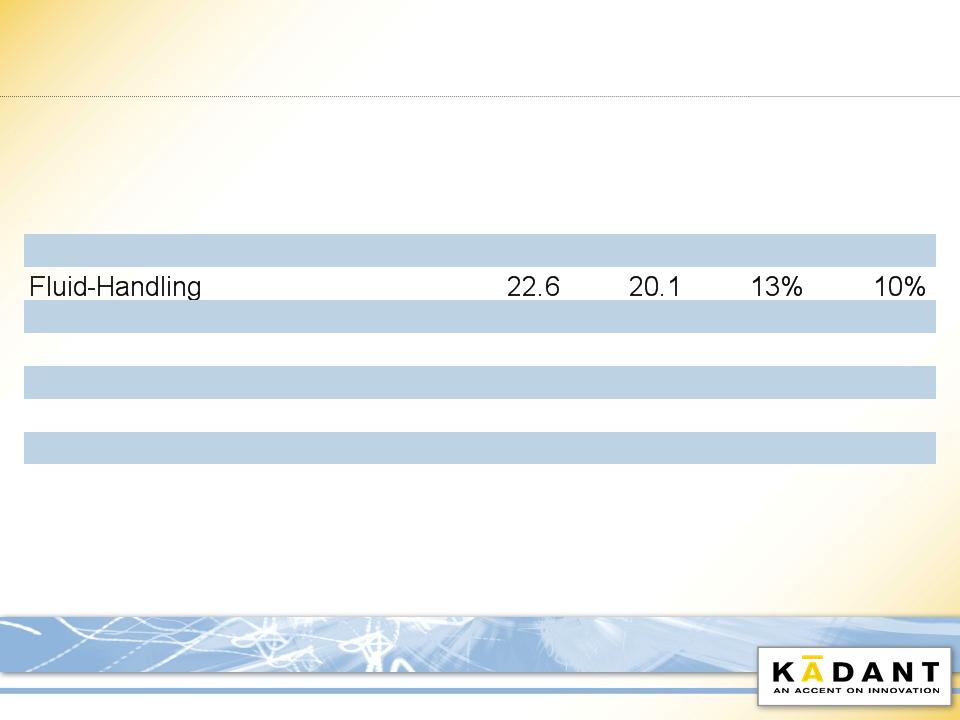
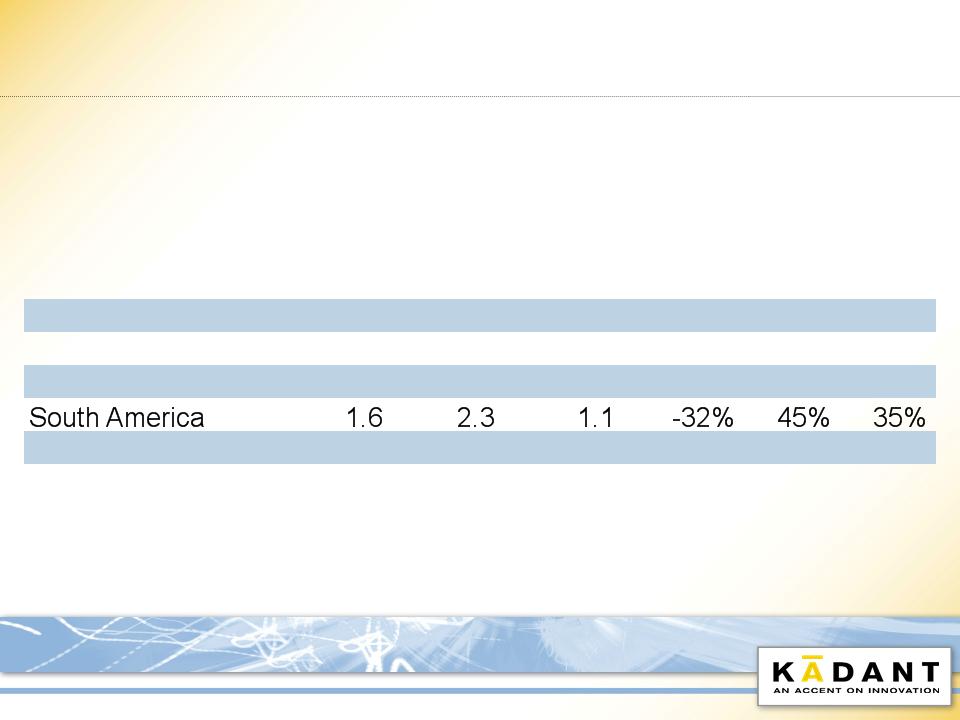
Revenues by Geography
(Papermaking Systems Segment Only)
(Papermaking Systems Segment Only)
* Percent change excluding the effect of currency translation
|
|
|
|
|
|
% Change
|
||
|
|
|
|
|
|
|
|
Excl.
|
|
|
|
|
|
|
|
|
FX*
|
|
($ Millions)
|
1Q11
|
4Q10
|
1Q10
|
|
4Q10
|
1Q10
|
1Q10
|
|
North America
|
$ 35.1
|
$ 33.4
|
$ 29.7
|
|
5%
|
18%
|
17%
|
|
Europe
|
21.2
|
23.0
|
21.0
|
|
-8%
|
1%
|
1%
|
|
China
|
8.8
|
12.3
|
5.4
|
|
-29%
|
64%
|
56%
|
|
|
|||||||
|
Australia
|
0.8
|
0.5
|
0.3
|
|
71%
|
122%
|
99%
|
|
Total
|
$ 67.5
|
$ 71.5
|
$ 57.5
|
|
-6%
|
18%
|
16%
|
27
© 2011 Kadant Inc. KAI 1Q11 Business Review - April 28, 2011
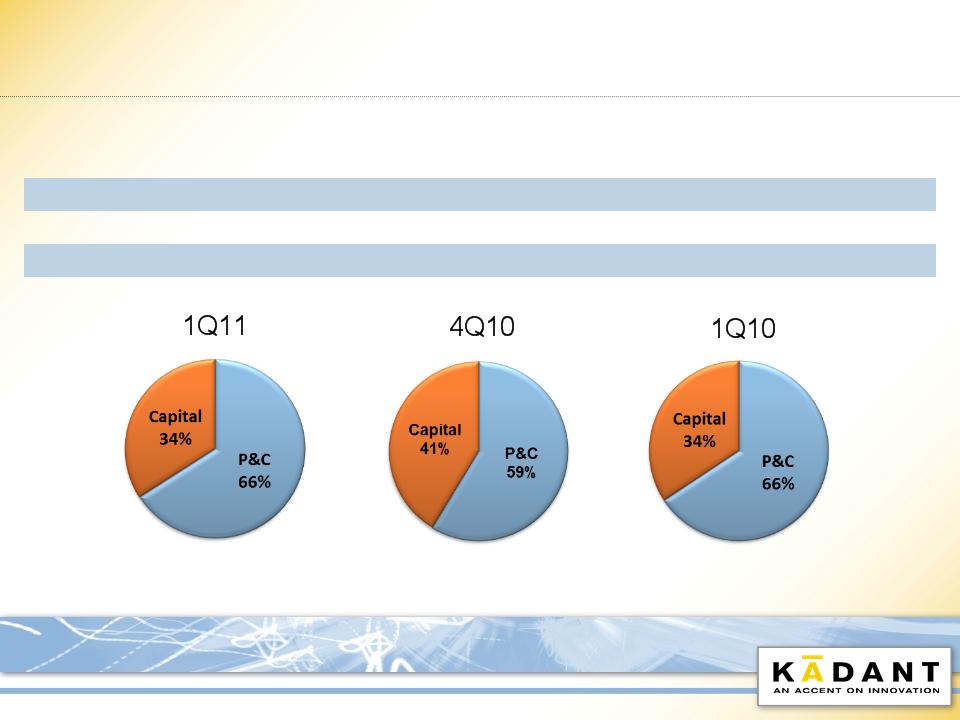
Revenue Detail
|
|
|
|
|
% Change
|
|
|
($ Millions)
|
1Q11
|
4Q10
|
1Q10
|
4Q10
|
1Q10
|
|
Parts & Consumables
|
$ 47.3
|
$ 43.0
|
$ 40.1
|
10%
|
18%
|
|
Capital
|
24.4
|
30.3
|
21.0
|
-19%
|
17%
|
|
Total
|
$ 71.7
|
$ 73.3
|
$ 61.1
|
-2%
|
17%
|
28
© 2011 Kadant Inc. KAI 1Q11 Business Review - April 28, 2011
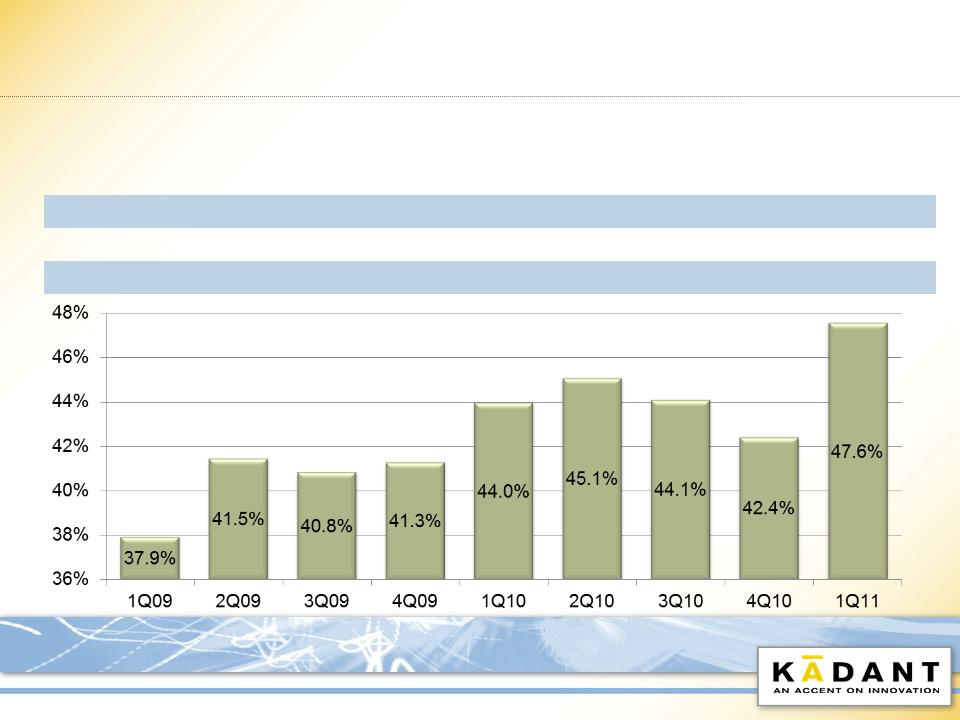
Gross Margin Percentages
|
|
|
|
|
|
% Point
|
|
|
|
|
|
|
|
Change
|
|
|
Quarter
|
1Q11
|
4Q10
|
1Q10
|
4Q10
|
1Q10
|
|
|
|
Papermaking Systems Segment
|
47.4
|
42.4
|
43.5
|
5.0%
|
3.9%
|
|
|
Fiber-based Products
|
50.8
|
41.8
|
50.7
|
9.0%
|
0.1%
|
|
|
Total
|
47.6
|
42.4
|
44.0
|
5.2%
|
3.6%
|
29
© 2011 Kadant Inc. KAI 1Q11 Business Review - April 28, 2011
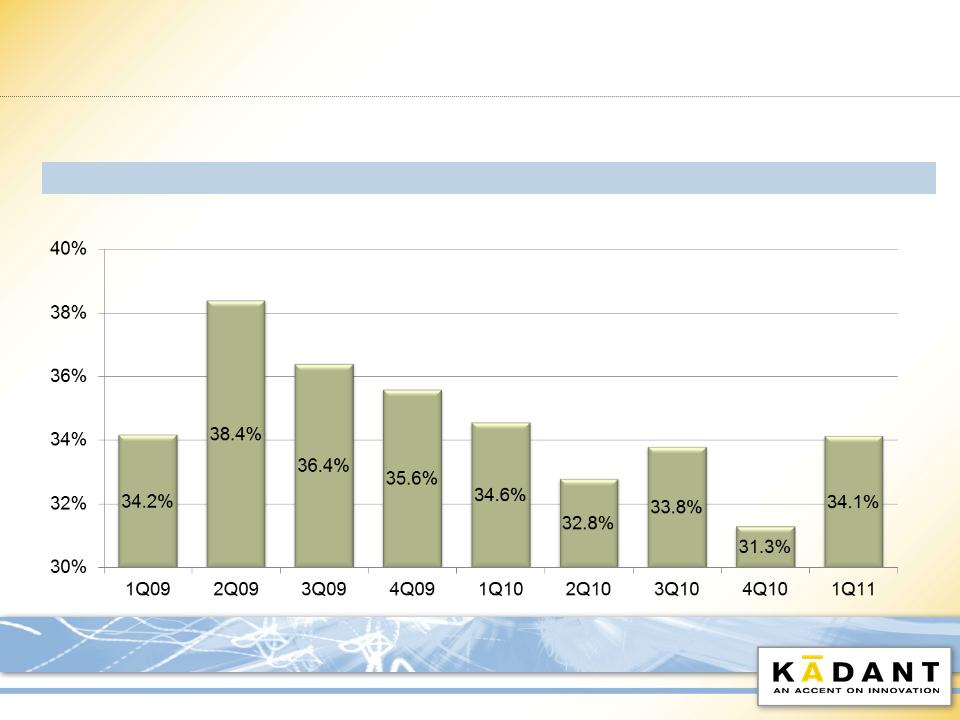
SG&A
|
Quarter
|
|
|
|
Change
|
||
|
|
($ Millions)
|
1Q11
|
4Q10
|
1Q10
|
4Q10
|
1Q10
|
|
|
SG&A
|
$ 24.5
|
$ 22.9
|
$ 21.1
|
$ 1.6
|
$ 3.4
|
|
|
% Revenues
|
34.1%
|
31.3%
|
34.6%
|
2.8%
|
-0.5%
|
30
© 2011 Kadant Inc. KAI 1Q11 Business Review - April 28, 2011
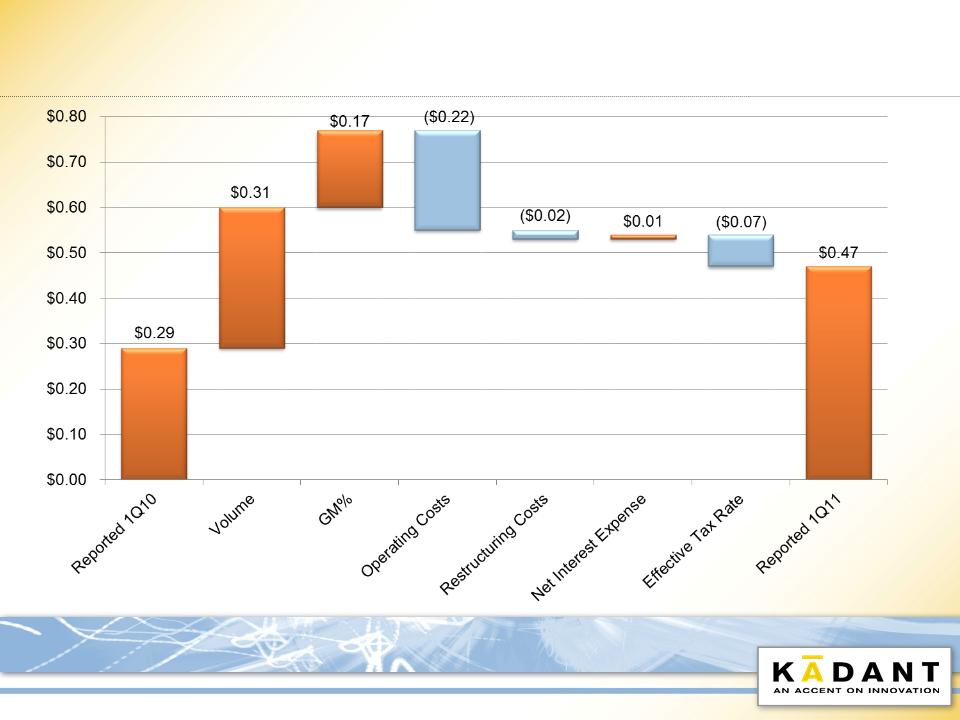
1Q11 to 1Q10 Diluted EPS
31

© 2011 Kadant Inc. KAI 1Q11 Business Review - April 28, 2011
Cash Flow
|
($ Millions)
|
1Q11
|
1Q10
|
|
Income from Continuing Operations
|
$ 5.9
|
$ 3.6
|
|
Depreciation and Amortization
|
1.9
|
1.6
|
|
Stock-Based Compensation
|
0.8
|
0.5
|
|
Other Items
|
0.5
|
(0.7)
|
|
Change in Current Assets &
|
|
|
|
Liabilities, Excluding Acquisitions
|
(8.7)
|
(5.6)
|
|
Cash from Continuing Operations
|
$ 0.4
|
$ (0.6)
|
32
© 2011 Kadant Inc. KAI 1Q11 Business Review - April 28, 2011
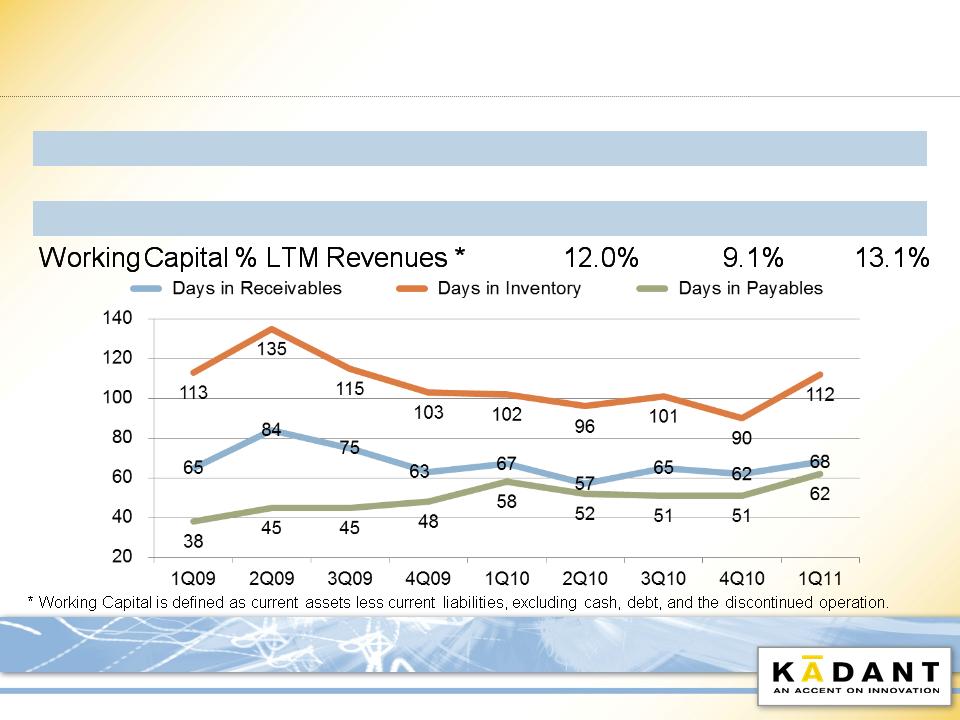
Key Working Capital Metrics
|
($ Millions)
|
1Q11
|
4Q10
|
1Q10
|
|
Days in Receivables
|
68
|
62
|
67
|
|
Days in Payables
|
62
|
51
|
58
|
|
Days in Inventory
|
112
|
90
|
102
|
33
© 2011 Kadant Inc. KAI 1Q11 Business Review - April 28, 2011
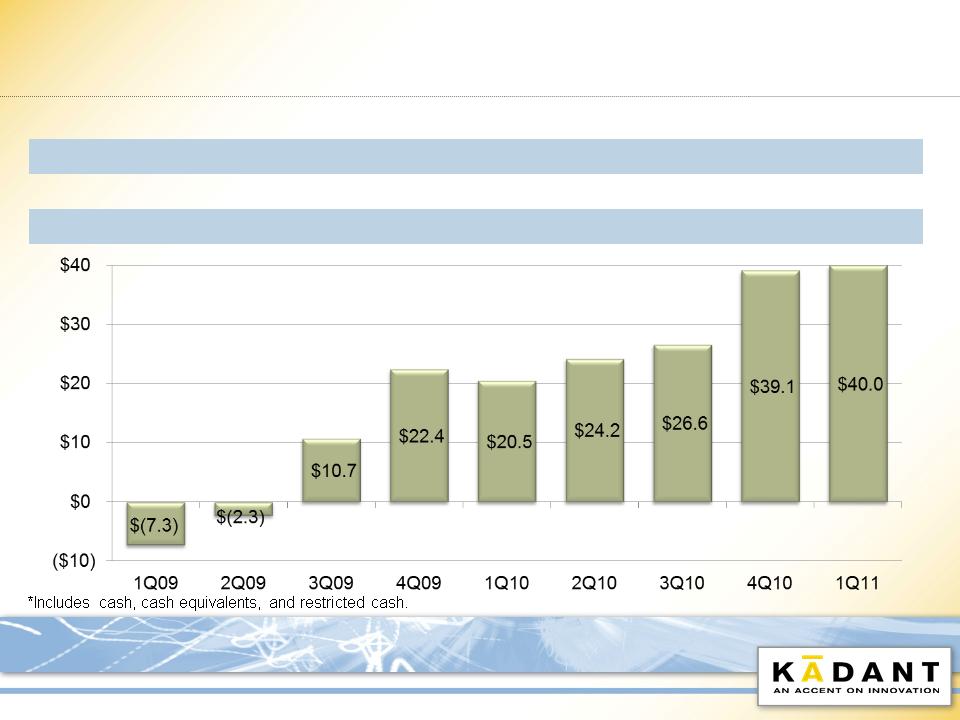
Cash and Debt
|
($ Millions)
|
1Q11
|
4Q10
|
1Q10
|
|
Cash *
|
$ 57.6
|
$ 61.8
|
$ 43.6
|
|
Debt
|
(17.6)
|
(22.7)
|
(23.1)
|
|
Net Cash
|
$ 40.0
|
$ 39.1
|
$ 20.5
|
34
© 2011 Kadant Inc. KAI 1Q11 Business Review - April 28, 2011
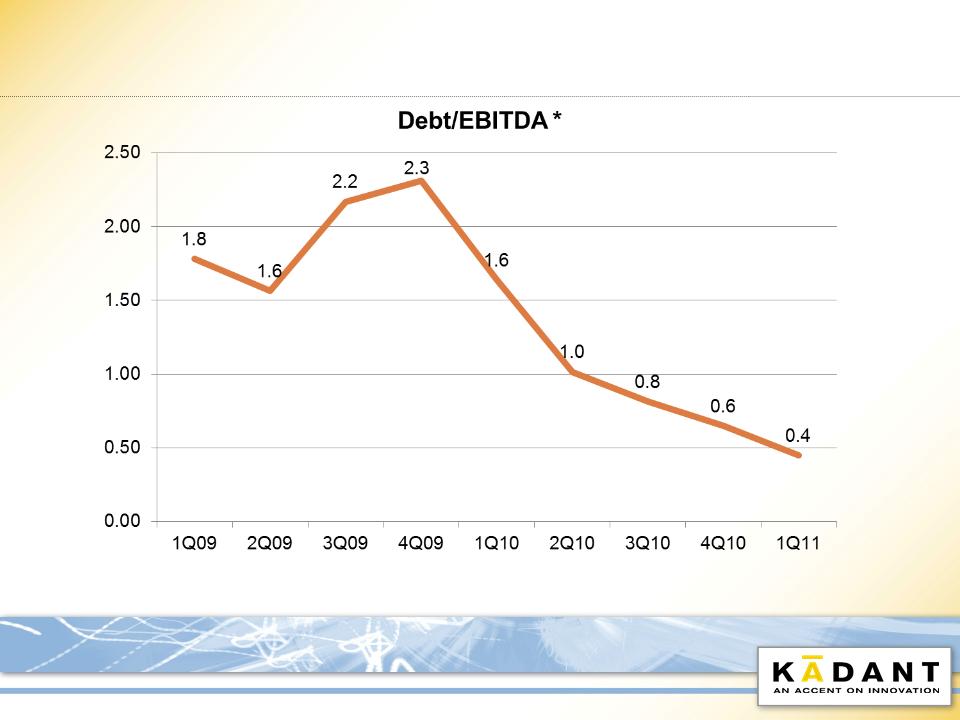
Leverage Ratio
* Calculated by adding or subtracting certain items, as defined in our Credit Facility, from Adjusted EBITDA reported externally.
35

© 2011 Kadant Inc. KAI 1Q11 Business Review - April 28, 2011
Questions & Answers
To ask a question, please call 866-804-6926 within the U.S. or
+1-857-350-1672 outside the U.S. and reference 83375884.
+1-857-350-1672 outside the U.S. and reference 83375884.
Please mute the audio on your computer.
36

First Quarter 2011 Business Review
Jonathan W. Painter, President & CEO
Thomas M. O’Brien, Executive Vice President & CFO
37