Attached files
| file | filename |
|---|---|
| EX-99.1 - PRESS RELEASE OF INTERNATIONAL PAPER COMPANY - INTERNATIONAL PAPER CO /NEW/ | dex991.htm |
| 8-K - FORM 8-K - INTERNATIONAL PAPER CO /NEW/ | d8k.htm |
 First Quarter
2011 Review
April 28, 2011
First Quarter
2011 Review
April 28, 2011
John V. Faraci
Chairman &
Chief Executive Officer
Tim S. Nicholls
Senior Vice President &
Chief Financial Officer
Exhibit 99.2 |
 2
Forward-Looking Statements
Forward-Looking Statements
These slides and statements made during this presentation contain
forward-looking statements. These statements reflect management's
current views and are subject to risks and uncertainties that could cause
actual results to differ materially from those expressed or
implied
in
these
statements.
Factors
which
could
cause
actual
results
to
differ
relate
to:
(i) increases in interest rates; (ii) industry conditions, including but not
limited to changes in the cost or availability of raw materials, energy and
transportation costs, competition we face, cyclicality and changes in
consumer preferences, demand and pricing for our products; (iii) global
economic conditions and political changes, including but not limited to the
impairment of financial institutions, changes in currency exchange rates, credit ratings
issued by recognized credit rating organizations, the amount of our future pension
funding obligation, changes in tax laws and pension and health care costs;
(iv) unanticipated expenditures
related
to
the
cost
of
compliance
with
existing
and
new
environmental
and
other governmental regulations and to actual or potential litigation; and (v)
whether we experience a material disruption at one of our manufacturing
facilities and risks inherent in conducting business through a joint
venture. We undertake no obligation to publicly update any
forward-looking statements, whether as a result of new information, future events or
otherwise. These and other factors that could cause or contribute to actual results
differing materially
from
such
forward
looking
statements
are
discussed
in
greater
detail
in
the
company's Securities and Exchange Commission filings.
|
 3
Statements Relating to Non-GAAP
Financial Measures
Statements Relating to Non-GAAP
Financial Measures
During the course of this presentation, certain
non-U.S. GAAP financial information will be
presented.
A reconciliation of those numbers to U.S. GAAP
financial measures is available on the
company’s
website
at
internationalpaper.com
under Investors. |
 4
First Quarter 2011
Strong Global Operations & Free Cash Flow
First Quarter 2011
Strong Global Operations & Free Cash Flow
Robust Sales Growth
Continued Demand Recovery
Higher Exit Rates
Improving Margins
Strong Operations
Significant Input Cost Increases
Continued Solid Free Cash Flow
Increased Ilim JV Earnings
Announced 3
rd
Dividend Increase
Announced Strategic Entry into India
Earnings from continuing operations
before special items |
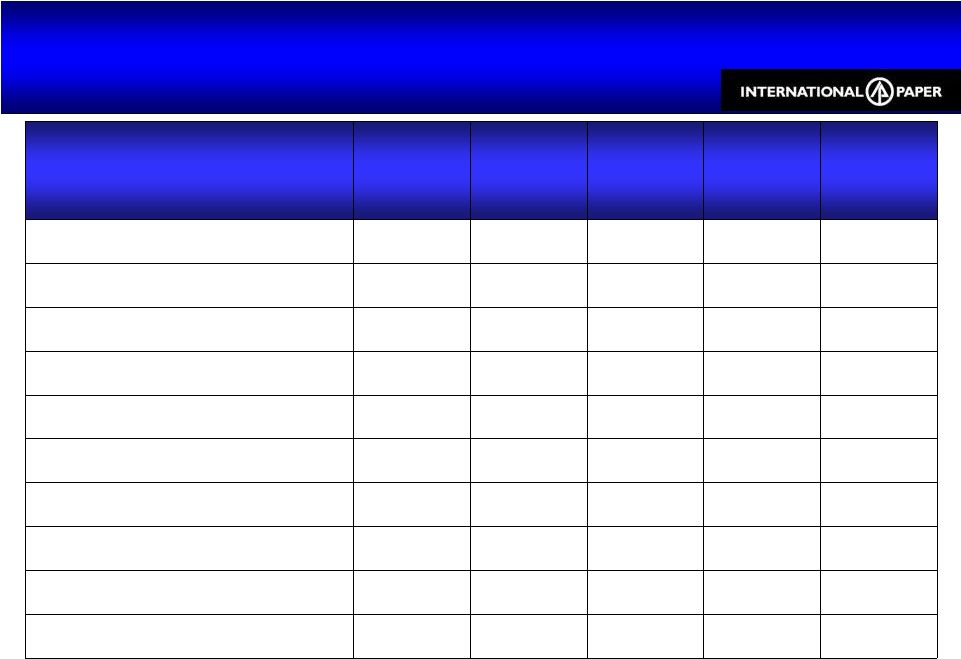
 5
1Q11 Financial Snapshot
1Q11 Financial Snapshot
1Q10
4Q10
1Q11
Sales ($B)
$5.8
$6.5
$6.4
EBITDA
1
($MM)
$560
$872
$897
EBITDA Margin
10%
13%
14%
Free Cash Flow
2
($MM)
$39
$601
$419
Debt ($B)
$9.0
$8.7
$8.5
Cash Balance
3
($B)
$1.7
$2.1
$2.0
1
Earnings from continuing operations before special items
2
4Q10
excludes
cash
received
from
cellulosic
biofuel
credits
of
$17
MM;
See
slide
#27
for
a
reconciliation
of
4Q10
and
1Q11
free cash flows
3
1Q11
includes
impact
of
$0.1
B
cash
paid
into
escrow
arrangement
for
purchase
of
APPM
shares |
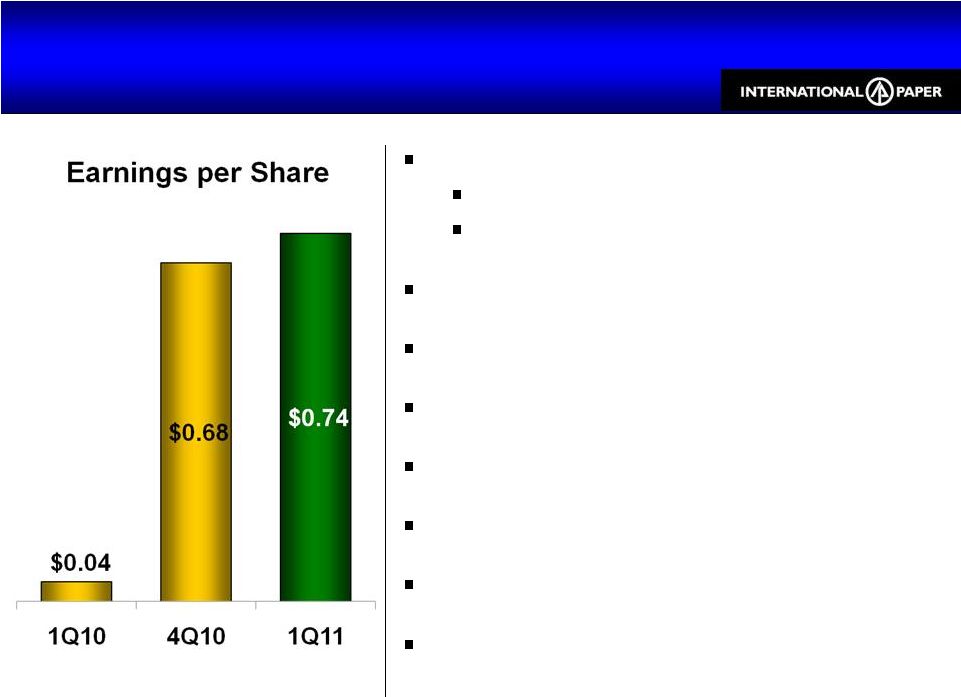
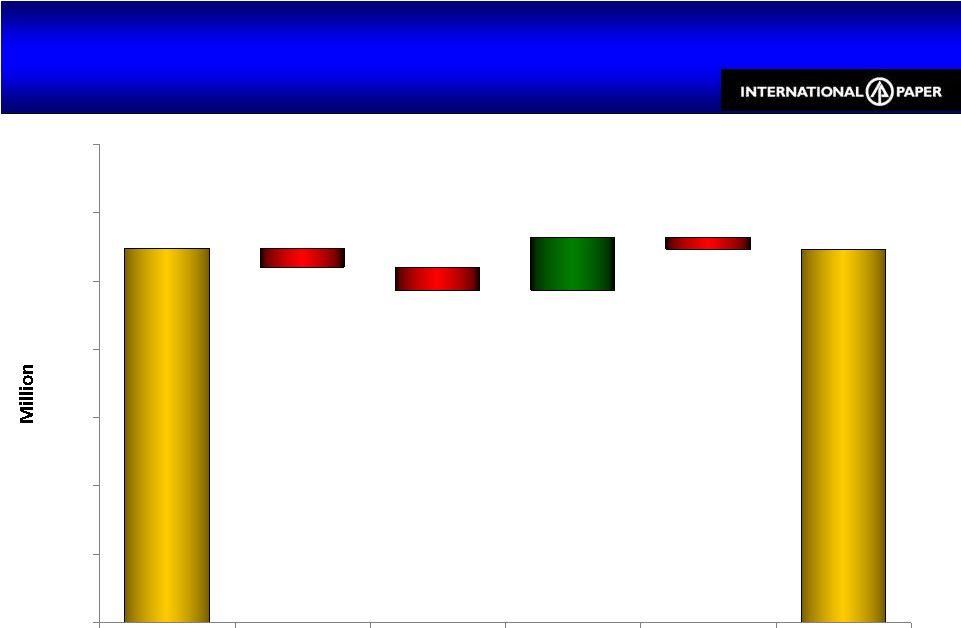
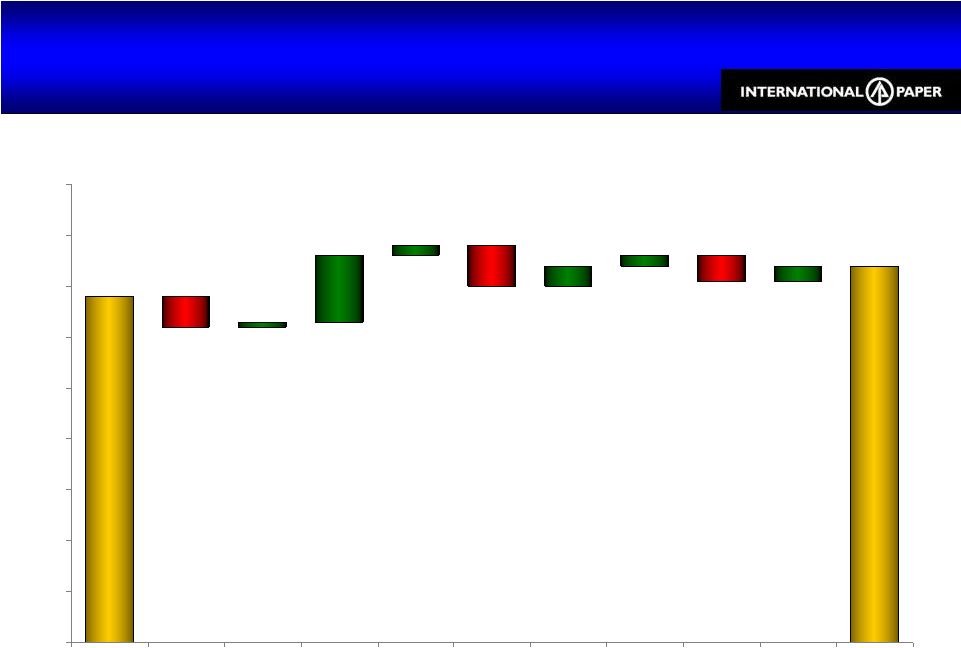 6
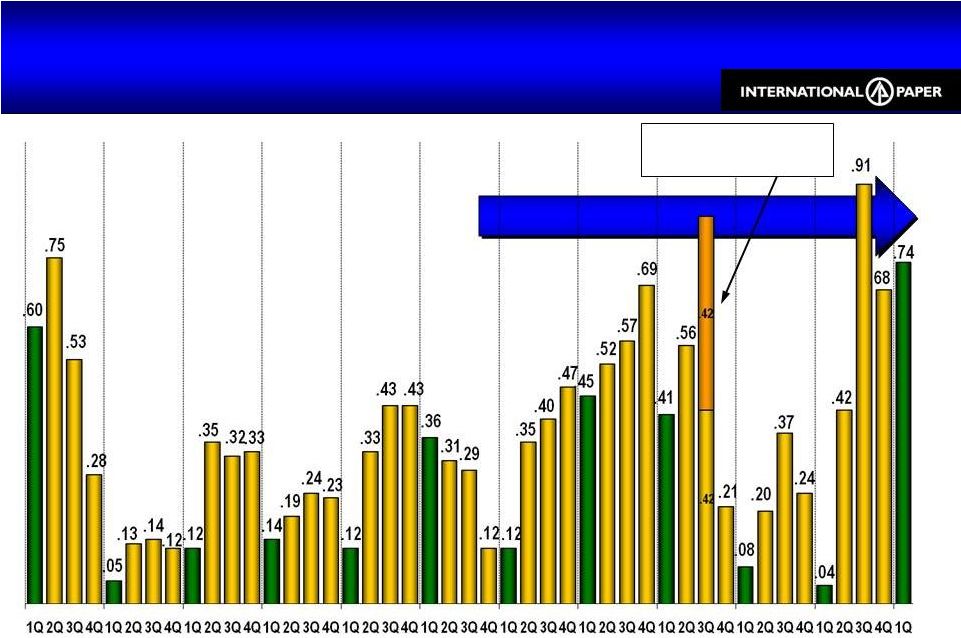
Earnings before special items
1Q11 vs. 4Q10 EPS
1Q11 vs. 4Q10 EPS
.68
.74
(.06)
(.08)
(.05)
.01
.13
.02
.04
.02
.03
$0.00
$0.10
$0.20
$0.30
$0.40
$0.50
$0.60
$0.70
$0.80
$0.90
4Q10
Volume
Price
Operations
& Costs
Maintenance
Outages
Input
Costs
Corporate
& Other
Interest
Tax
Ilim JV
1Q11 |
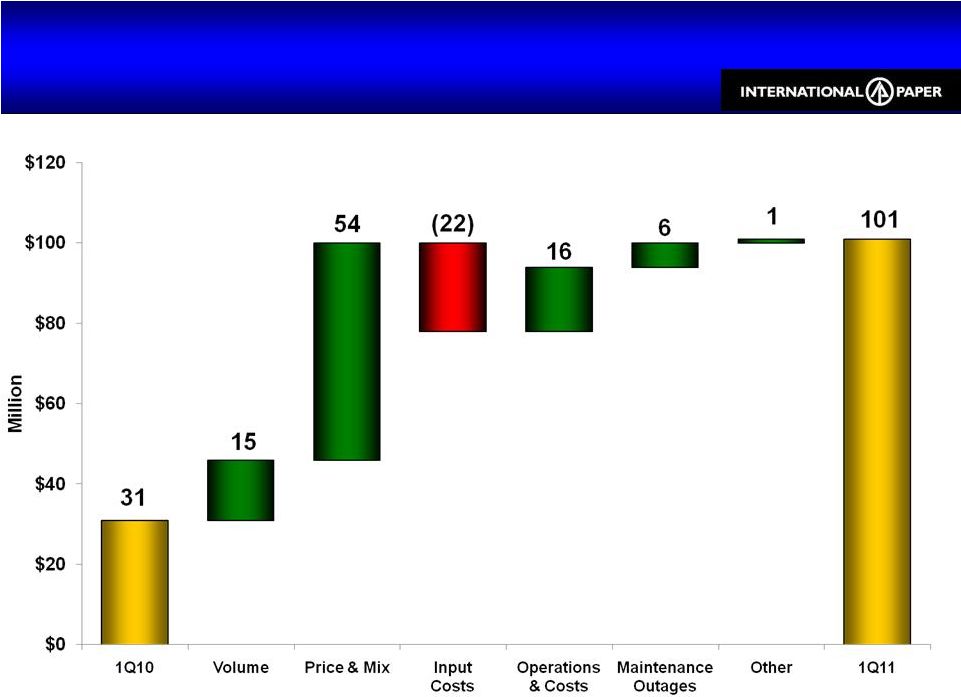
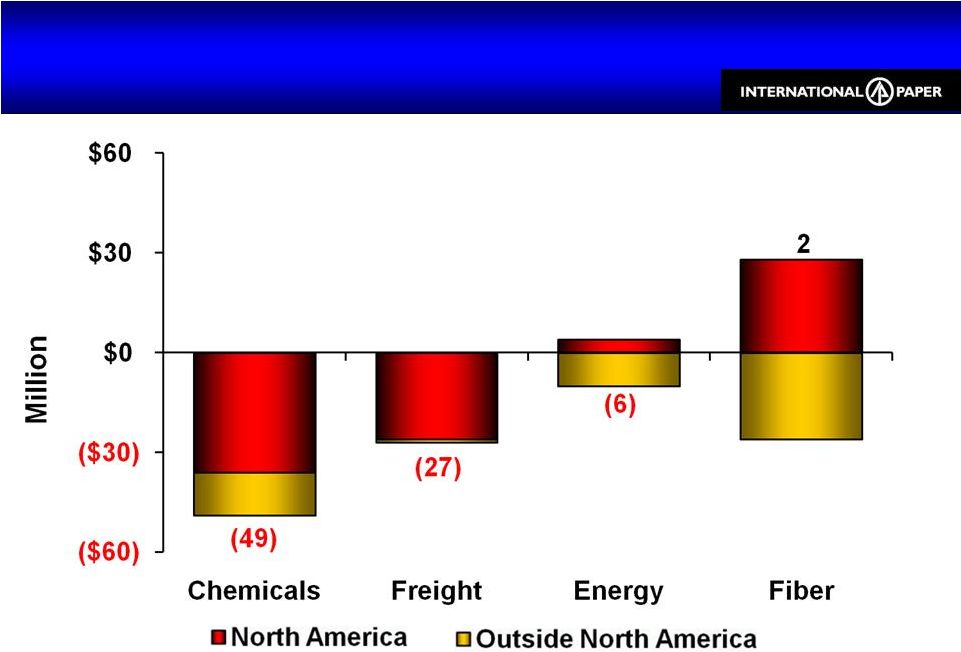
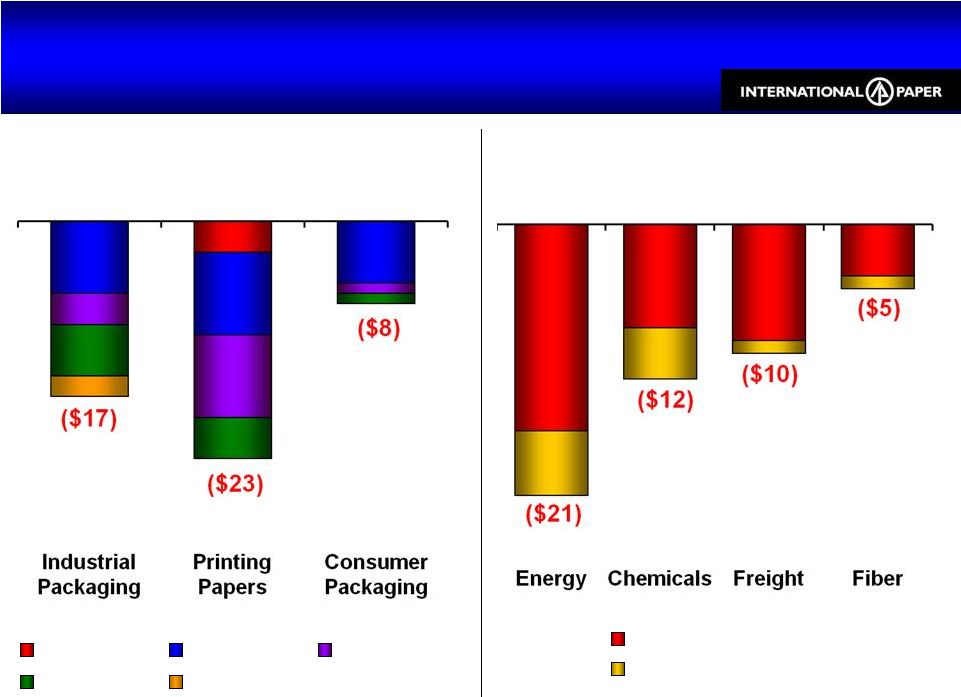 Global
Input Costs vs. 4Q10 $48 MM Unfavorable, or $0.08/Share
Global Input Costs vs. 4Q10
$48 MM Unfavorable, or $0.08/Share
By Business
By Input Type
7
Wood
Energy
Chemicals
Freight
OCC
Outside North America
North America |
 8
Industrial Packaging Earnings
1Q11 vs. 4Q10
Industrial Packaging Earnings
1Q11 vs. 4Q10
Earnings before special items
274
274
(14)
(17)
(9)
40
$0
$50
$100
$150
$200
$250
$300
$350
4Q10
Volume
Input
Costs
Operations
& Costs
Maintenance
Outages
1Q11 |
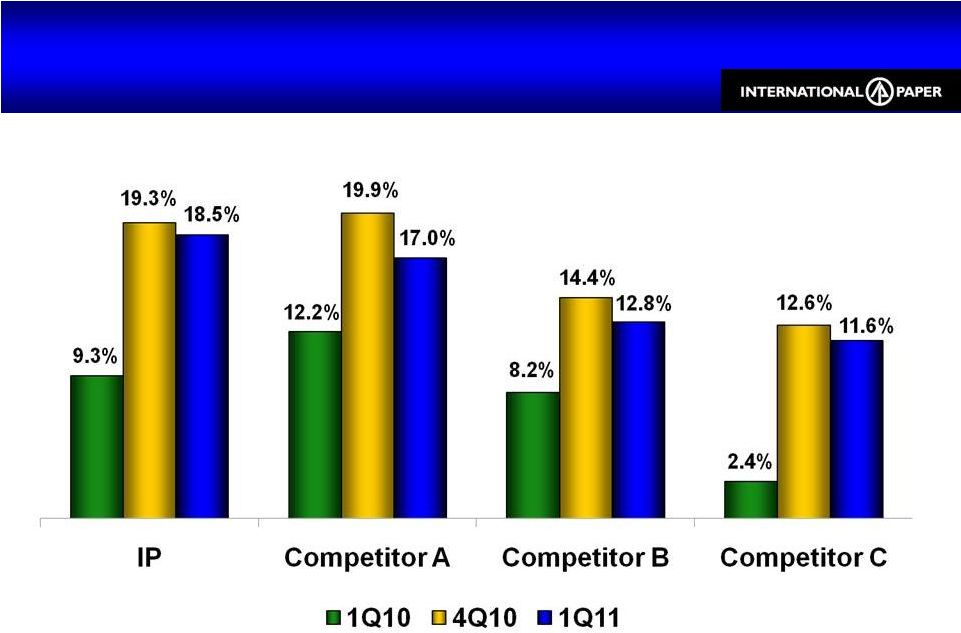 9
N.A. Industrial Packaging Relative EBITDA Margins
N.A. Industrial Packaging Relative EBITDA Margins
IP EBITDA margins based on North American Industrial Packaging operating profit
before special items. Competitor EBITDA margin estimates obtained from
public filings and IP analysis Excludes revenue from trade volumes
|
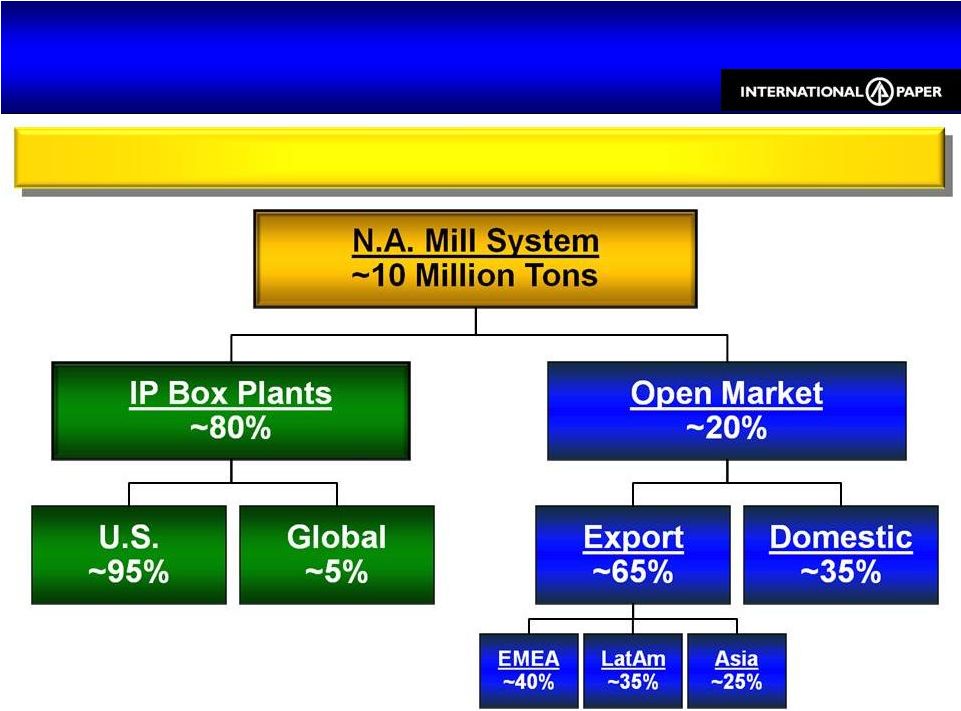 North
American Industrial Packaging Balanced Global Strategy
North American Industrial Packaging
Balanced Global Strategy
IP’s market access provides choices for maximizing value
Source: IP analysis, 1Q11 run rate
10 |
 11
North American Industrial Packaging
1Q11
North American Industrial Packaging
1Q11
•
Continued year-over-year box demand growth
•
Industry shipments up 2%
•
IP up 1%
•
Industry-leading margins
•
Cost-of-capital ROI
Box demand on an FBA reporting basis
1Q11 Average Box Price vs.
$/Ton
1Q10
$91
4Q10
$6 |
 12
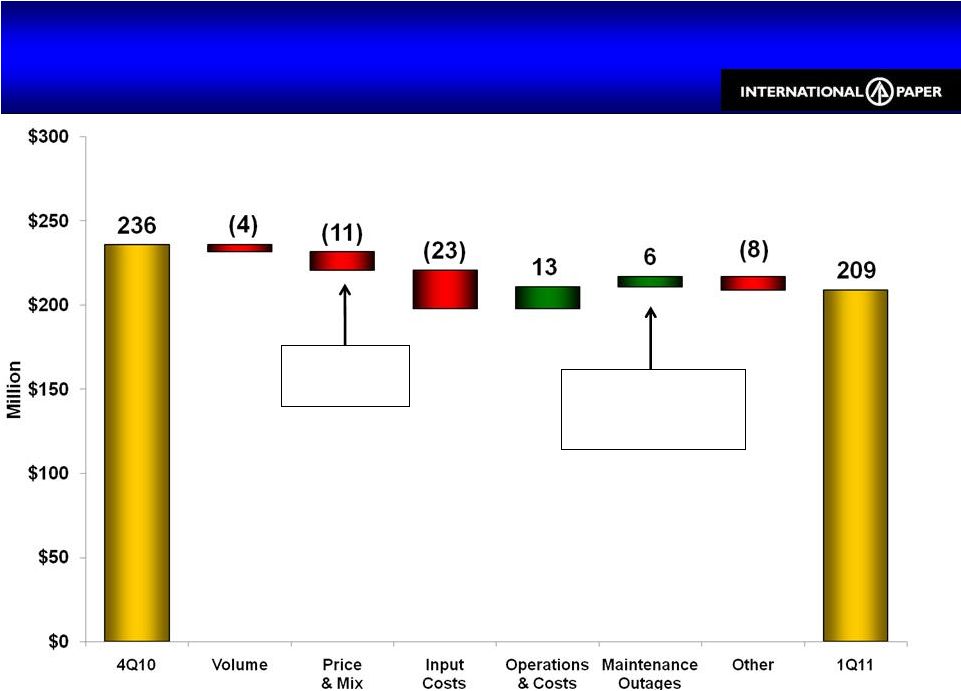
Printing Papers Earnings
1Q11 vs. 4Q10
Printing Papers Earnings
1Q11 vs. 4Q10
Earnings before special items
N.A. Papers 10
N.A. Pulp (20)
Europe 16
Price (5)
Mix (6) |
 13
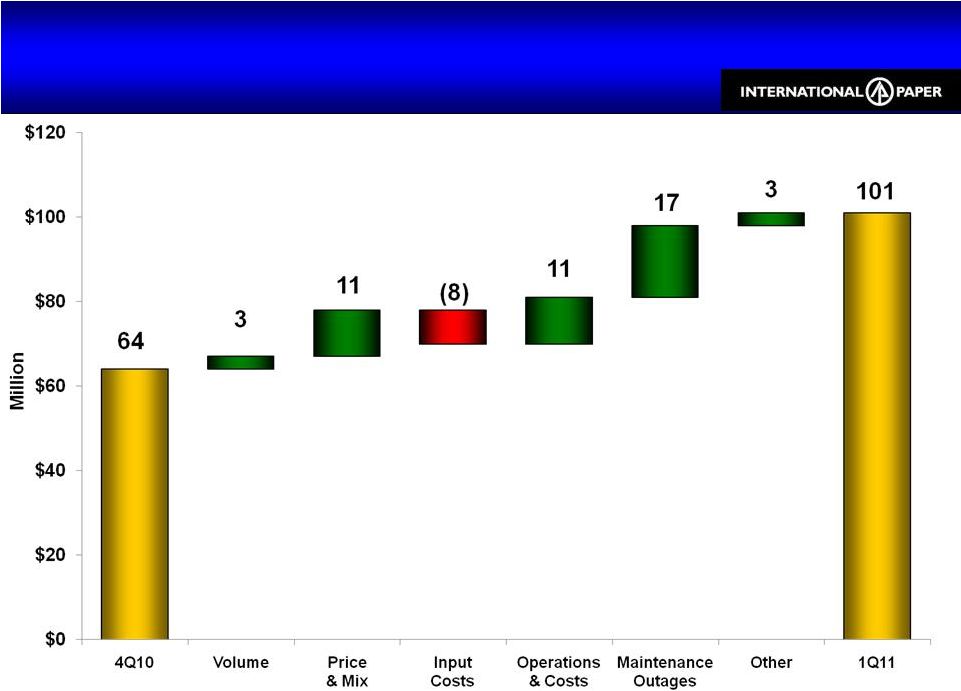
Consumer Packaging Earnings
1Q11 vs. 4Q10
Consumer Packaging Earnings
1Q11 vs. 4Q10
Earnings before special items |
 14
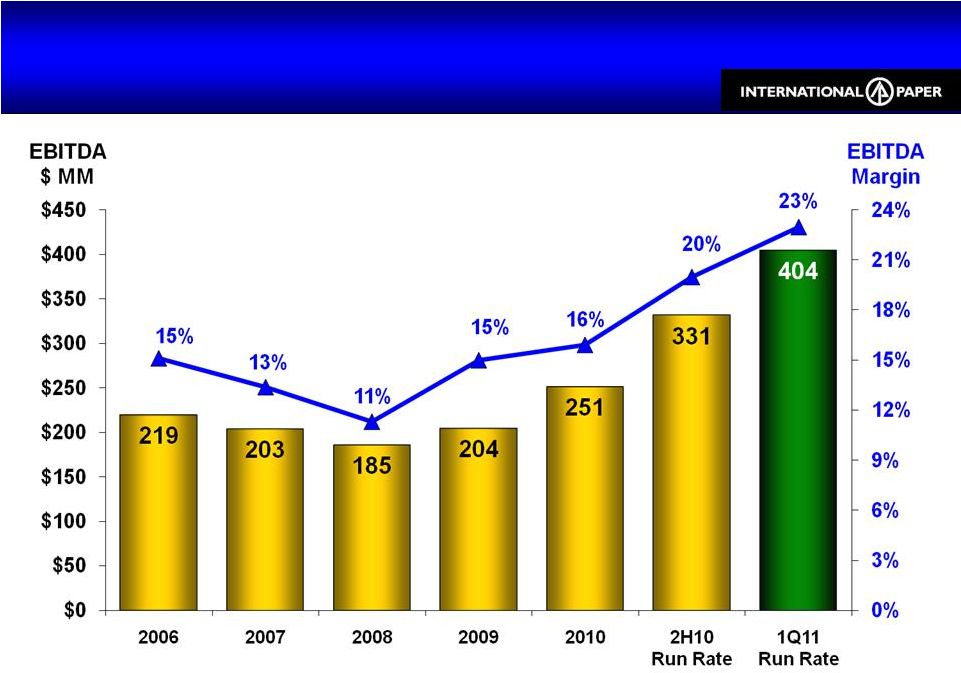
N.A. Coated Paperboard
Consistent Improvement
N.A. Coated Paperboard
Consistent Improvement |
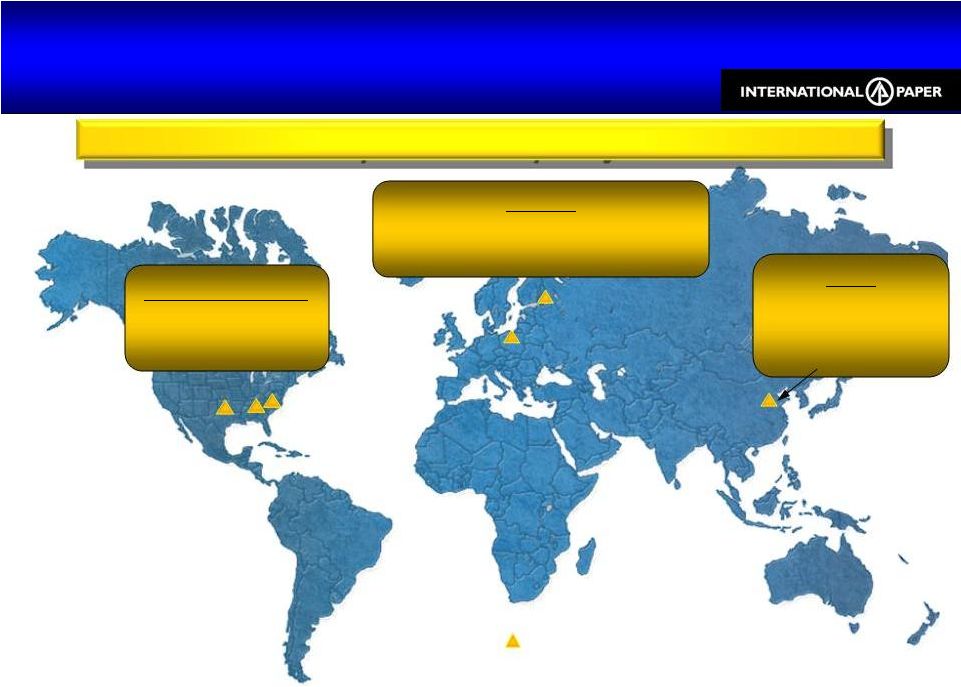 15
North America
1.7 Million Tons
23% Margin
Coated paperboard mill
EMEA
345,000 Tons
34% Margin
Asia
Sun Paper JV
915,000 Tons
11% Margin
Global Coated Paperboard
3 MM Tons at Cost-of-Capital Returns
Global Coated Paperboard
3 MM Tons at Cost-of-Capital Returns
Global Coated Paperboard Capacity of 3 Million Tons |
 16
$ Million
1Q10
4Q10
1Q11
Sales
$1,580
$1,770
$1,640
Earnings
$21
$9
$12
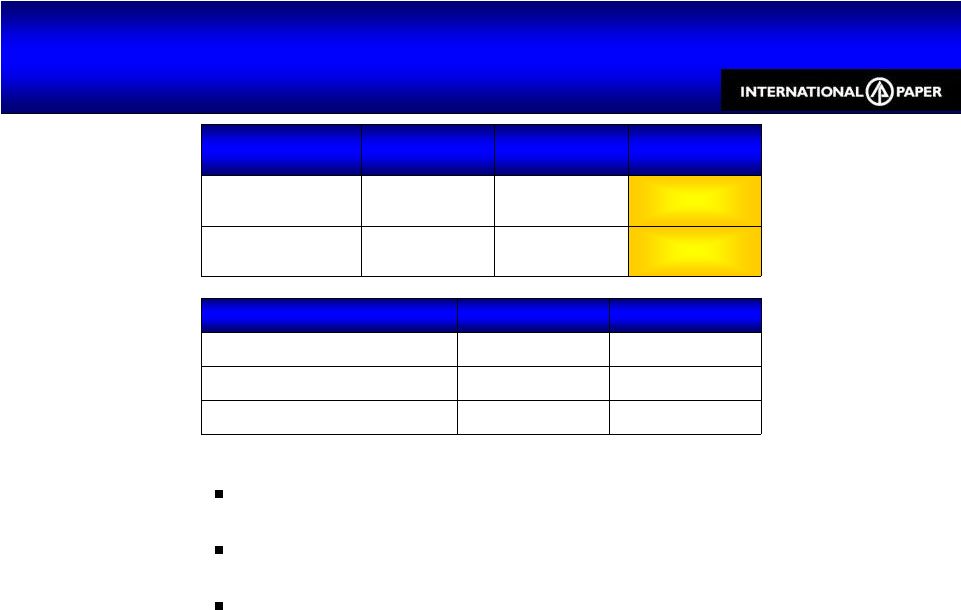
xpedx
1Q11 vs. 4Q10
xpedx
1Q11 vs. 4Q10
Seasonal demand decline
Average daily sales rate up 2% vs. 1Q10
Higher transportation costs
Daily Sales Change
vs. 1Q10
vs. 4Q10
Printing
(5%)
(13%)
Packaging
6%
(7%)
Facility Supplies
(17%)
1
(9%)
Earnings before special items
1
Sales increased 5%, excluding the impact of the loss of one large national accounts
customer in 1H10. |
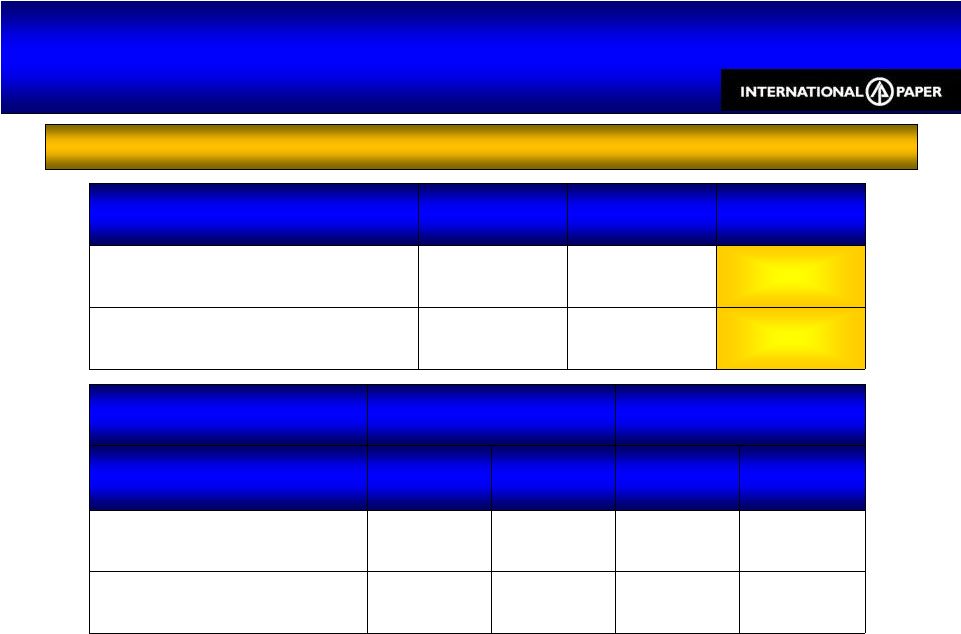
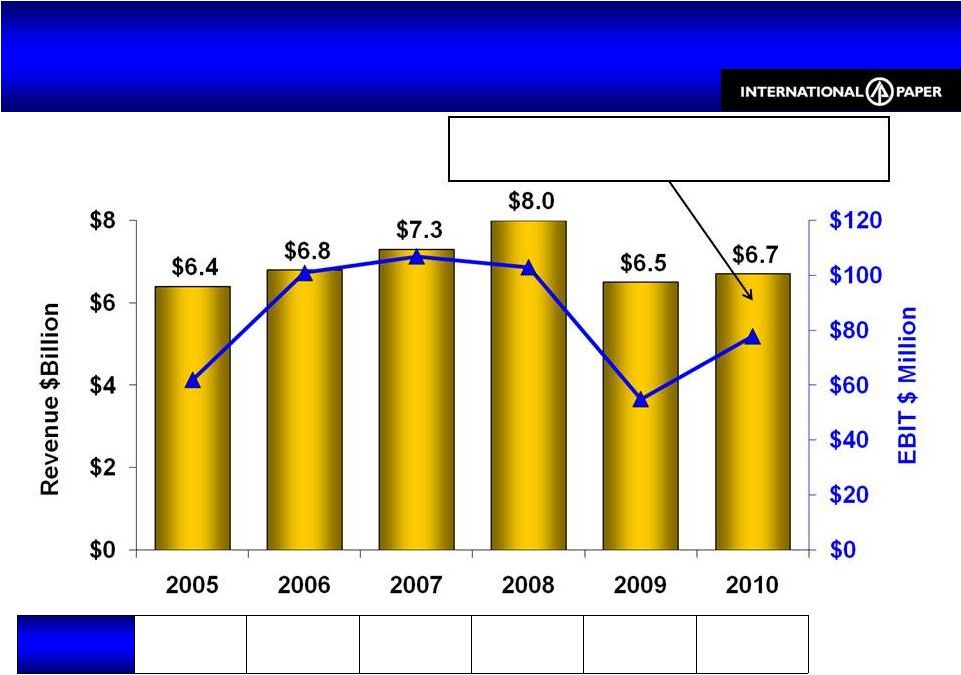 17
xpedx
Current Situation
xpedx
Current Situation
2005 EBIT
excludes
$20 MM of restructuring and other one-time charges
ROI
4%
6%
6%
5%
3%
4%
Recession drove 16% decline in revenue
and 24% decline in earnings |
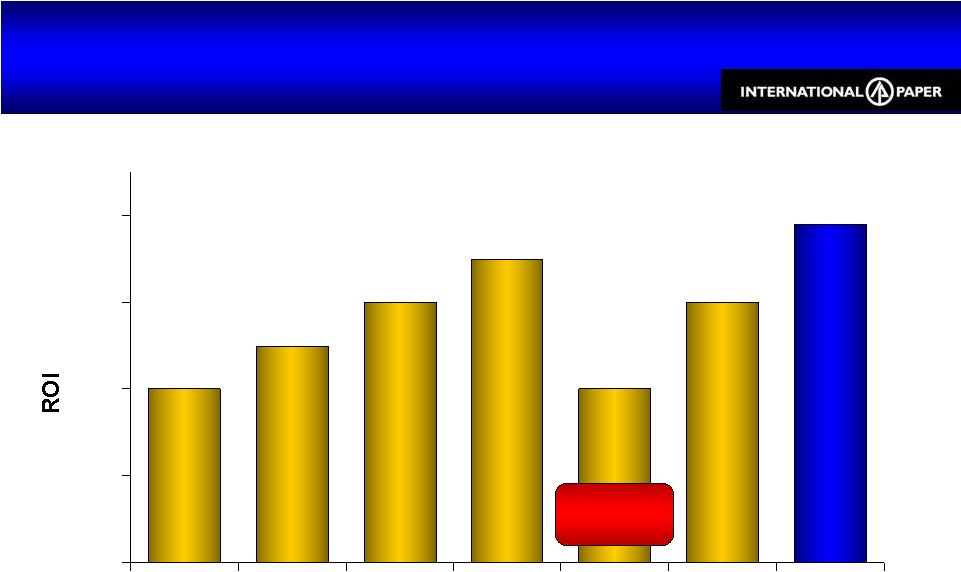
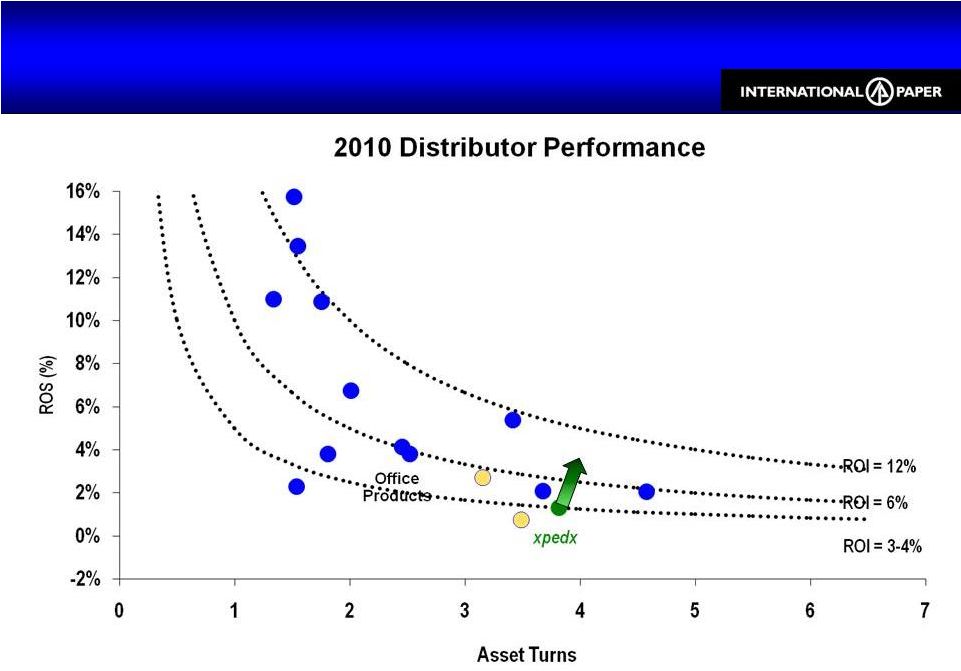 18
xpedx
Distribution Benchmarks
xpedx
Distribution Benchmarks
ROS = EBIT / Revenue
Asset Turns = Revenue / Assets
Industrial
Industrial
Industrial
Industrial
Industrial
Medical
Medical
Foodservice
Technology
Automotive
Technology
Paper
Paper
*Paper distributor data are xpedx estimates
|
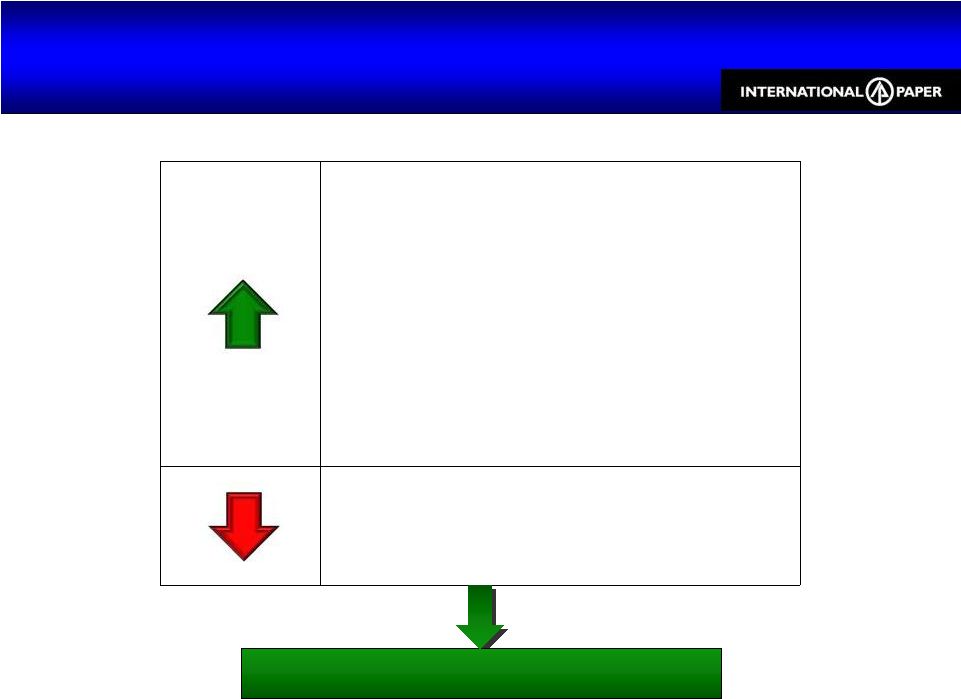
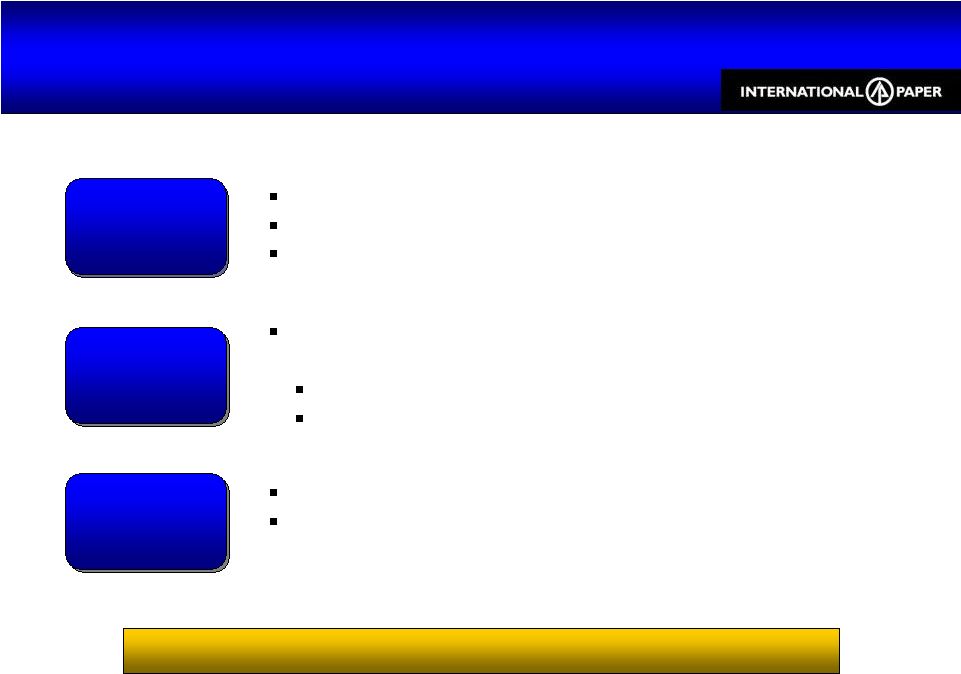 19
xpedx
Projecting $140 MM Annual Benefit
xpedx
Projecting $140 MM Annual Benefit
Centralize processes and decision-making
Establish targeted / consistent product offering
Consolidate / rationalize suppliers & SKUs
Buy
Handle
Sell
Optimize warehouse network & inventory placement
around centers of demand
Streamline operations
Larger, lower-cost facilities
Increase productivity of print sales & marketing
Expand sales & marketing capabilities in growth
segments
Cash Costs of ~$100 MM over Three Years
Cash costs net of estimated proceeds of $60 million from asset recoveries
|
 20
$ Million
1Q10
4Q10
1Q11
Sales (100%)
$395
$490
$515
Earnings (IP Share)
($3)
$31
1
$44
1
Ilim
recorded an asset impairment charge (IP share was $16 million after tax)
Ilim’s
results are reported on a one-quarter lag.
IP’s shares of Ilim’s
reported earnings for 1Q11 & 4Q10 include an after-tax foreign exchange
gain of $2MM and $10MM, respectively. 1Q10 earnings include an
after-tax foreign exchange loss of $2MM. Ilim
Joint Venture
1Q11 vs. 4Q10
Ilim
Joint Venture
1Q11 vs. 4Q10
1Q11 vs. 4Q10
1Q11 vs. 1Q10
Business
Volume
Price /
Ton
Volume
Price /
Ton
Pulp
4%
($8)
5%
$133
Containerboard
(3%)
$53
(2%)
$198
IP received a $42 MM dividend from Ilim
in 1Q11 |
 21
Improving Returns on Invested Capital
Transformation Driving ROI
Improving Returns on Invested Capital
Transformation Driving ROI
4%
5%
6%
7%
4%
6%
8%
0%
2%
4%
6%
8%
2000 -
2005 Avg
2006
2007
3Q08
Run Rate
2009
2010
1Q11
Global
Economic
Recession |
 22
•
Increasing Demand
•
Stable-to-Improving Prices
•
Strong Operations
•
Strong Ilim
JV Earnings
•
$42 MM Ilim
JV Dividend
•
$140 MM Debt Reduction
•
Input Cost Escalation
1Q11 Summary
Momentum Continues
1Q11 Summary
Momentum Continues
Strong EPS, FCF & ROI |
 23
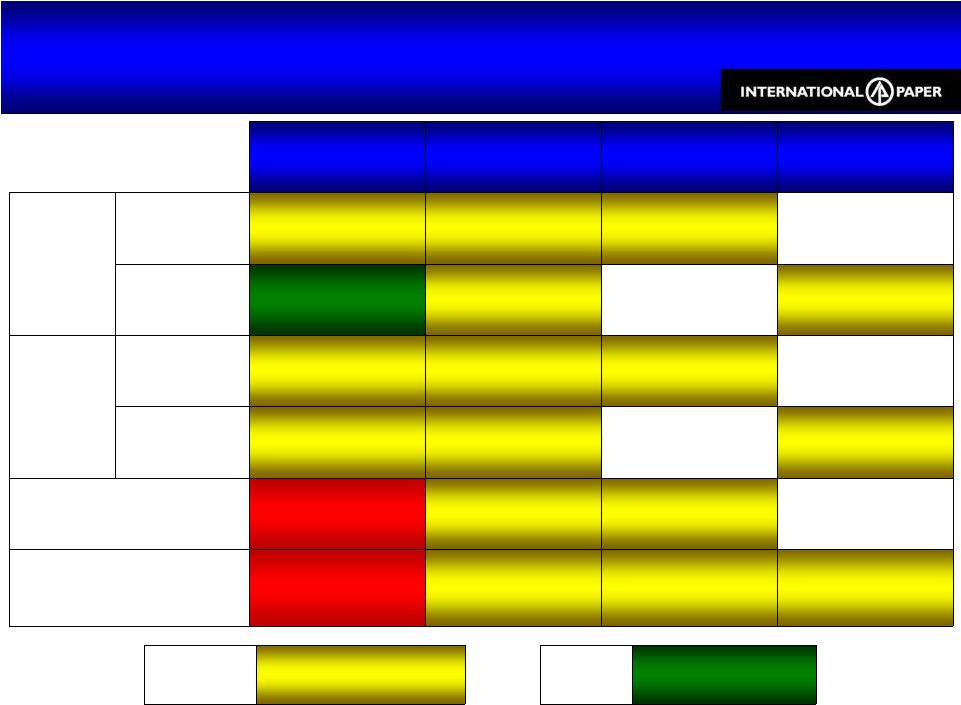
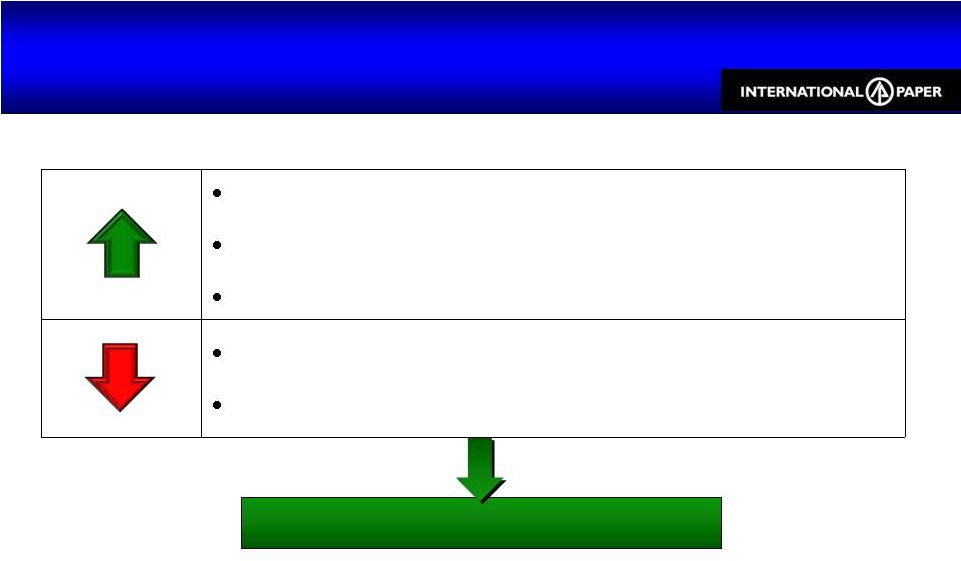
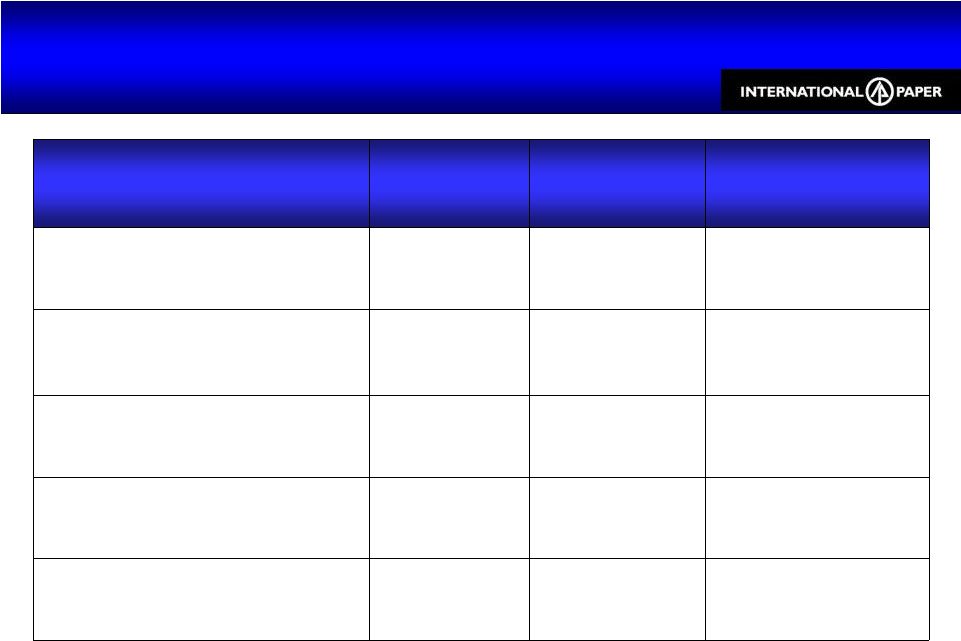
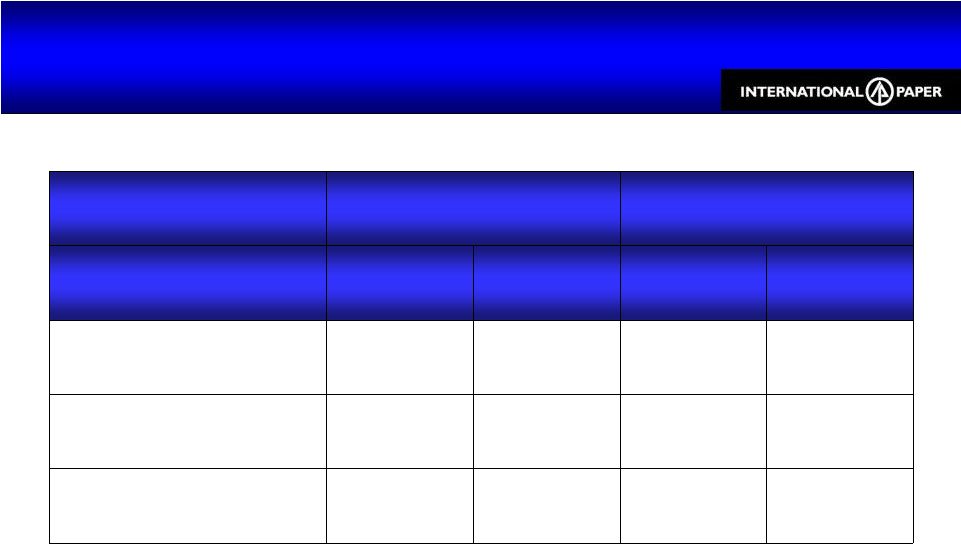
Second Quarter Outlook
Changes from 1Q11
Second Quarter Outlook
Changes from 1Q11
North America
Europe
Brazil
Asia
Volume
Paper
Stable
Stable
Stable
Packaging
Seasonal
Increase
Stable
Stable
Pricing
Paper
Slight Increase
Increase
Slight Increase
Packaging
Stable
Increase
Slight Increase
Maintenance Outages
~$59 MM
Increase
~$9MM
Increase
~$6 MM
Increase
Input & Freight Costs
Higher Energy,
Transportation
& Chemicals
Increase
Stable
Stable
xpedx
Increase
Ilim
Increase |
 24
Increasing U.S. Box Demand
Stable-to-Improving Prices
Strong Ilim JV Earnings
Input Cost Escalation
Significantly Higher Maintenance Outages
2Q11 Outlook
Momentum Continues
2Q11 Outlook
Momentum Continues
Strong EPS, FCF & ROI |
 25
Appendix
Investor Relations Contacts
Thomas A. Cleves
901-419-7566
Emily Nix
901-419-4987
Media Contact
Tom Ryan
901-419-4333 |
 26
$ Million
(Except as noted)
2009
2010
2011
Estimate
Capital Spending
$534
$775
$1.2 -
$1.3 B
Depreciation &
Amortization
$1,472
$1,456
$1.4 B
Net Interest Expense
$669
$608
$575 -
$600
Corporate Items
$181
$226
$175 -
$200
Effective Tax Rate
30%
30%
32 -
34%
Before special items and excluding Ilim
Key Financial Statistics
Key Financial Statistics |
 27
Free Cash Flow
Free Cash Flow
$ Million
1Q10
4Q10
1Q11
Cash from Operations
$159
$919
1
$600
2
Cash Received from Cellulosic
Biofuel Tax Credits (CBTC)
$0
$17
$0
Cash Provided by Continuing
Operations
$159
$936
$600
Less Capital Investment
($120)
($318)
($181)
Free Cash Flow
$39
$618
$419
Free Cash Flow
Excluding CBTC
$39
$601
$419
1
Excludes
a
tax
receivable
of
$108
MM
collected
related
to
pension
contributions
2
Excludes a $209 MM increase in working capital related to the cessation of the
European A/R securitization program and a $123 MM tax receivable collected
related to pension contributions |
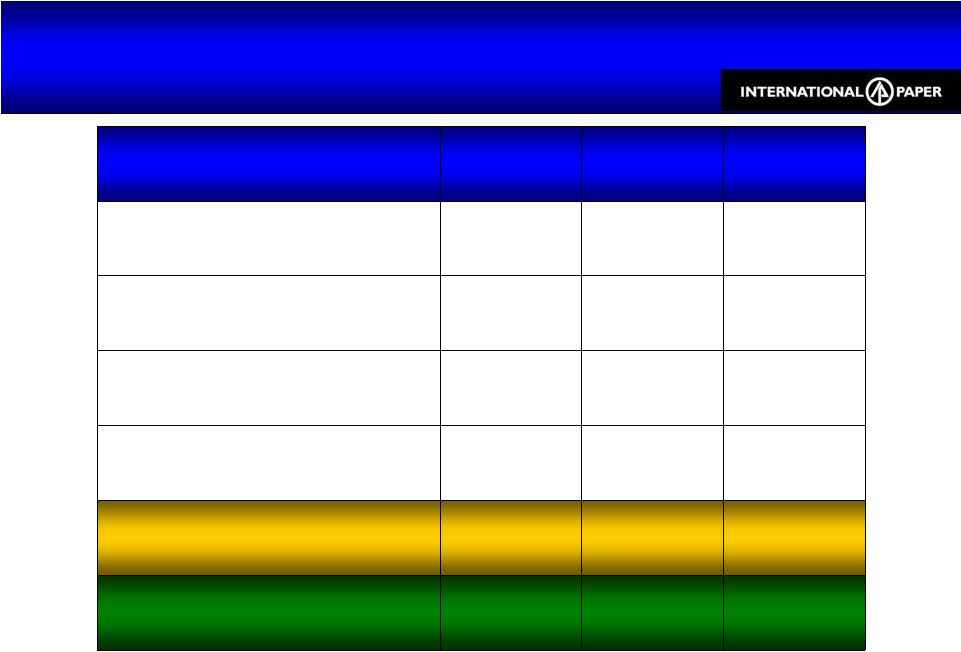
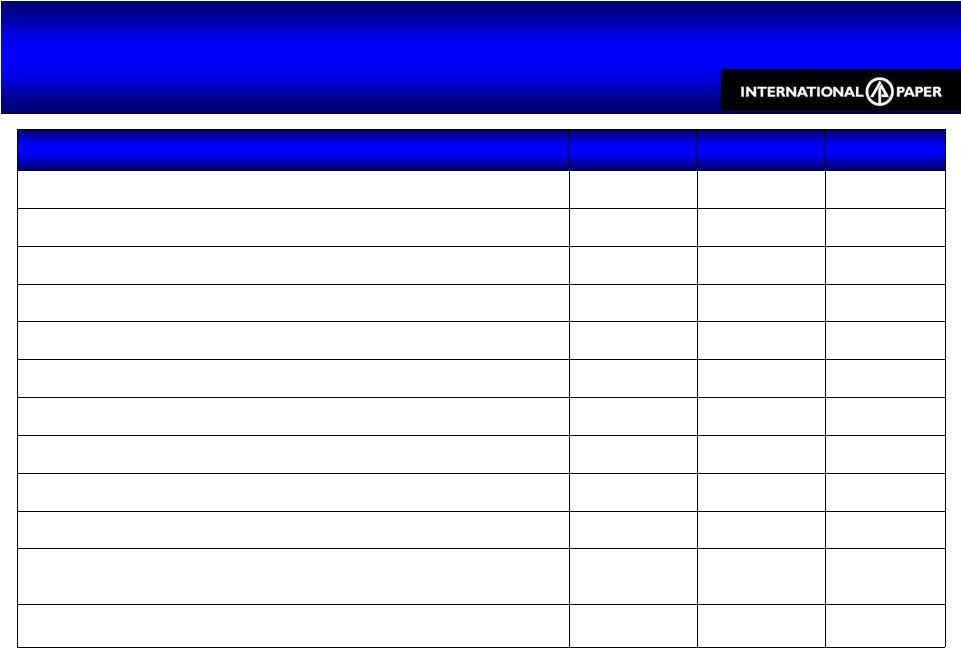
 28
$ Million
1Q11
2Q11E
3Q11E
4Q11E
2011E
Industrial Packaging
$31
$82
$6
$24
$143
Printing Papers Total
$39
$45
$52
$49
$185
North America
$39
$30
$20
$49
$138
Europe
0
9
23
0
32
Brazil
0
6
9
0
15
Consumer Packaging
$0
$17
$0
$27
$44
Total Impact
$70
$144
$58
$100
$372
Dollar impact of planned maintenance outages are estimates and subject to
change Maintenance Outages Expenses
Maintenance Outages Expenses |
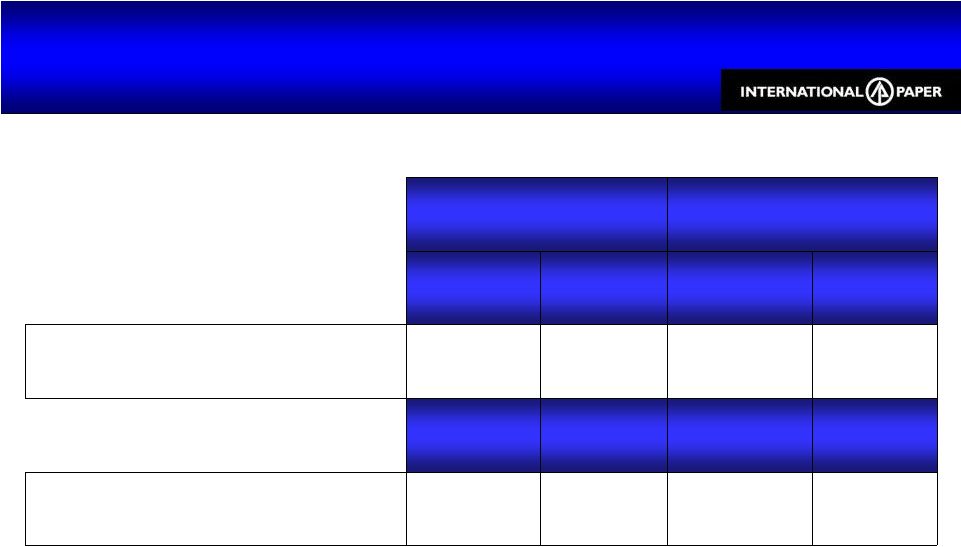
 29
1Q11 vs. 4Q10
1Q11 vs. 1Q10
Business
Volume
Price /
Ton
Volume
Price /
Ton
N.A. Container
1
(1%)
$6
1%
$91
European Container
2
2%
€15
11%
€84
Industrial Packaging
Industrial Packaging
1
Volumes
reflect
FBA
reporting
basis,
which
excludes
Display
and
Bulk
products
and
shipments
from
facilities
in
Mexico
and
Latin
America; but includes domestic sheet plant shipments
2
European Container volumes reflect box shipments only, including the shipments by
the non-consolidated joint venture in Turkey •
Total box shipments for IP North America were
down seasonally 1% Q-o-Q and stable Y-o-Y
|
 30
Average
IP
price
realization
(includes
the
impact
of
mix
across
all
grades)
1Q11 vs. 4Q10
1Q11 vs. 1Q10
Business
Volume
Price / Ton
Volume
Price / Ton
N.A. Paper
3%
($7)
(5%)
$60
N.A. Pulp
(8%)
$8
(8%)
$137
European Paper
2%
€7
1%
€97
Printing Papers
Printing Papers |
 31
Average IP price realization (includes the impact of mix across all grades)
1Q11 vs. 4Q10
1Q11 vs. 1Q10
Volume
Price/Ton
Volume
Price/Ton
N.A. Coated Paperboard
9%
$12
8%
$92
Revenue
Price
Revenue
Price
Converting Businesses
(6%)
NA
7%
NA
Consumer Packaging
Consumer Packaging |
 32
Special Items Pre-Tax
from Continuing Operations
Special Items Pre-Tax
from Continuing Operations
Special Items Pre-Tax ($Million)
1Q10
4Q10
1Q11
Industrial
Packaging
Facility & Machine Closure Costs
($5)
($10)
($2)
Other
($3)
$7
Printing
Papers
Facility Closure Costs
($204)
Other
($2)
($8)
Consumer
Packaging
Reorganization
($3)
($4)
($1)
xpedx
Reorganization
($7)
Corporate
Net Gain on Sale of Business
$25
Restructuring & Other Charges
($3)
($36)
($35)
Total Special Items Pre-Tax
($215)
($30)
($46) |
 33
Special Items Net of Taxes
from Continuing Operations
Special Items Net of Taxes
from Continuing Operations
1Q11
$ Million
EPS
Earnings Before Special Items
$322
$0.74
Special Items Net of Taxes:
Mill & Machine Shutdowns
($2)
Debt Extinguishment Costs
($19)
Reorganization
($5)
Overhead Reduction Initiative
($2)
Other
($1)
Total Special Items Net of Taxes
($29)
($0.07)
Discontinued Operations Net of Taxes
$49
$0.11
Net Earnings
$342
$0.78 |
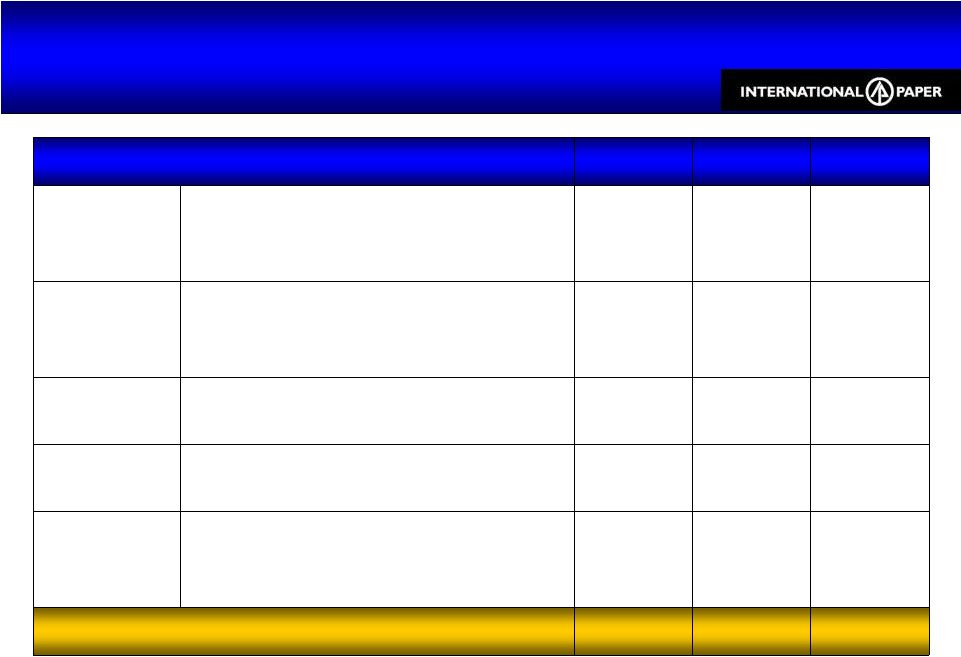
 34
1Q11 EBITDA
1Q11 EBITDA
Operating
Profit
$ Million
D & A
$ Million
Tons
Thousand
EBITDA
per Ton
EBITDA
Margin
Industrial Packaging
North America
1
$255
$116
2,404
$154
18.9%
Europe
$17
$7
273
$88
8.6%
Printing Papers
North America
2
$88
$50
685
$201
20.0%
Eastern Europe & Russia
3
$57
$19
312
$244
22.8%
Brazil
$48
$37
273
$311
29.8%
U.S. Market Pulp
$16
$13
229
$127
16.6%
Consumer Packaging
N.A. Coated Paperboard
$64
$37
364
$277
23.2%
1
Excludes Recycling & Bag businesses; includes Saturating Kraft business
2
Includes Bleached Kraft business
3
Excludes Market Pulp |
 35
Operating Profits by Industry Segment
Operating Profits by Industry Segment
$ Million
1Q10
4Q10
1Q11
Industrial Packaging
$46
$274
$274
Printing Papers
$126
$236
$209
Consumer Packaging
$31
$64
$101
Distribution
$21
$9
$12
Forest Products
$8
($3)
$0
Operating Profit
$232
$580
$596
Net Interest Expense
($149)
($150)
($136)
Noncontrolling Interest / Equity Earnings Adjustment
$8
($5)
$5
Corporate Items
($51)
($63)
($44)
Special Items
($215)
($30)
($53)
Earnings from continuing operations before income
taxes, equity earnings & noncontrolling interest
($175)
$332
$368
Equity Earnings, net of taxes -
Ilim
($3)
$31
$44 |
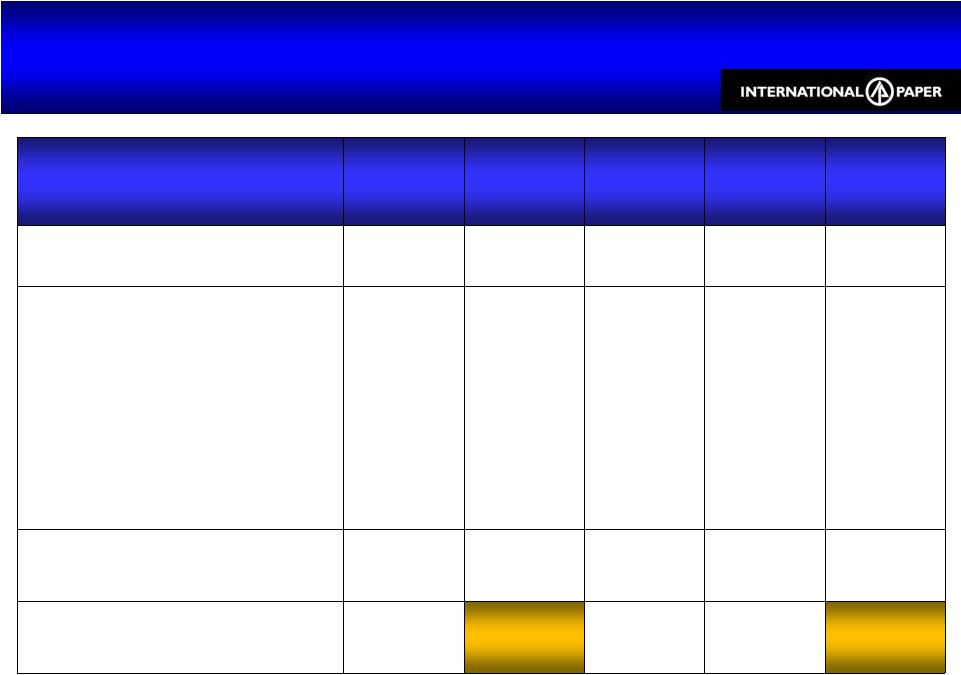
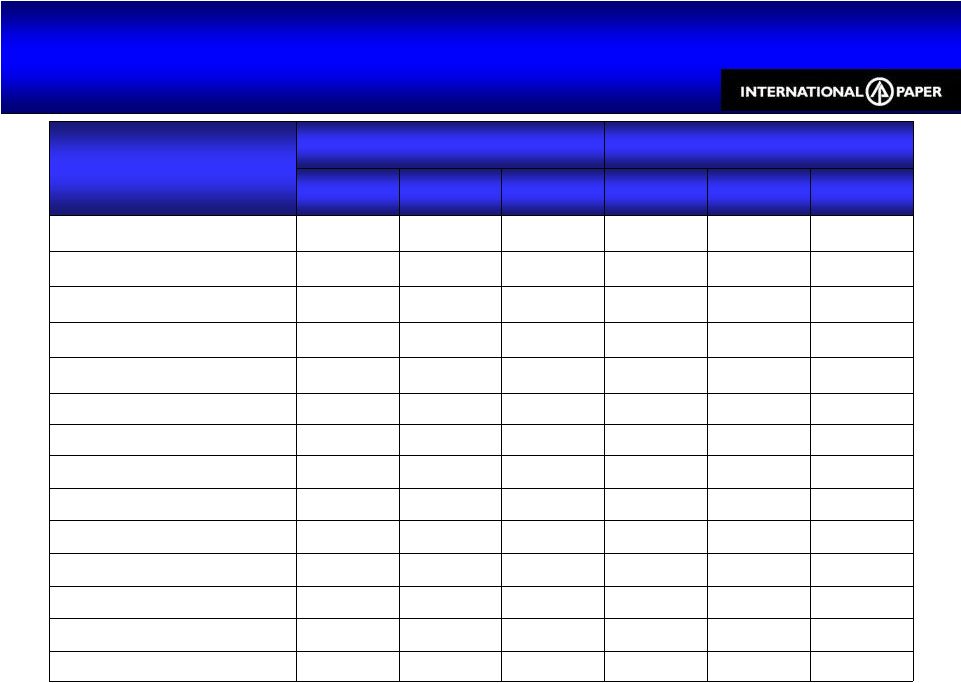 36
Geographic Business Segment Operating Results
Before Special Items
Geographic Business Segment Operating Results
Before Special Items
$ Million
Sales
Operating Profit
1Q10
4Q10
1Q11
1Q10
4Q10
1Q11
Industrial Packaging
North American
$1,890
$2,135
$2,115
$23
$261
$256
European
$245
$275
$280
$24
$16
$17
Asian
$85
$160
$160
($1)
($3)
$1
Printing Papers
North American
$685
$675
$690
$70
$92
$88
European
$315
$345
$360
$48
$38
$57
Brazilian
$225
$315
$285
$11
$63
$48
U.S. Market Pulp
$155
$190
$175
($3)
$43
$16
Consumer Packaging
North American
$550
$605
$620
($1)
$38
$65
European
$85
$95
$95
$20
$20
$27
Asian
$170
$180
$190
$12
$6
$9
xpedx
$1,580
$1,770
$1,640
$21
$9
$12
Does not reflect total company sales and operating profit
|
 37
1
Assuming dilution
2
A reconciliation to GAAP EPS is available at www.internationalpaper.com under the
Investors tab at Webcasts and Presentations Pre-Tax
$MM
Tax
$MM
Non-
controlling
Interest
$MM
Equity
Earnings
Net
Income
$MM
Estimated
Tax Rate
Average
Shares
1
MM
Diluted
EPS
2
Before Special Items
1Q11
$421
($140)
($5)
$46
$322
33%
434
$0.74
Special Items
1Q11
($53)
$17
$0
$7
($29)
32%
434
($0.07)
Earnings
1Q11
$368
($123)
($5)
$53
$293
33%
434
$0.67
2011 Earnings from Continuing Operations
2011 Earnings from Continuing Operations |
 38
1Q11 Operating Business EPS
1Q11 Operating Business EPS
2003
2004
2005
2006
2007
2010
2002
2000
2001
2008
Impact of Mineral
Rights Gain
2009
Earnings from continuing operations before special items as reported at the
time .84
Transformation
2011 |
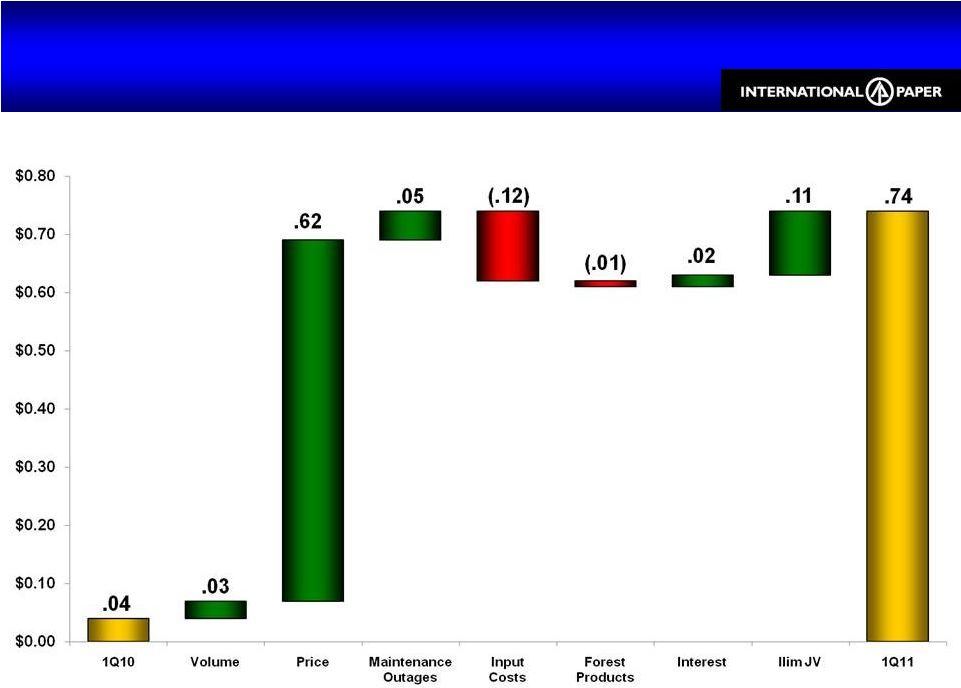 39
Earnings before special items
1Q11 vs. 1Q10 EPS
1Q11 vs. 1Q10 EPS |
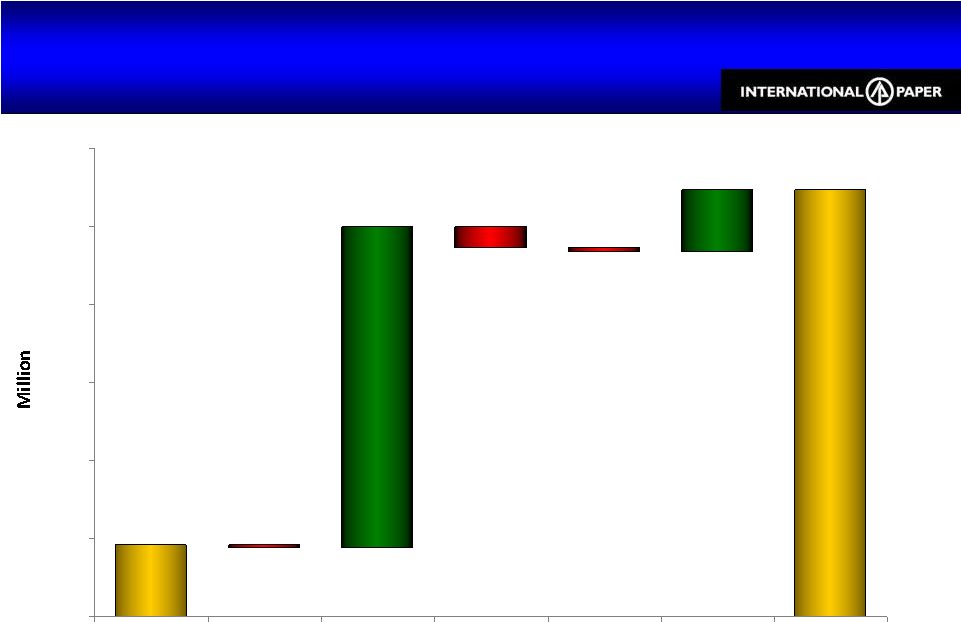 40
Industrial Packaging Earnings
1Q11 vs. 1Q10
Industrial Packaging Earnings
1Q11 vs. 1Q10
Earnings before special items
46
274
(2)
(13)
(3)
206
40
$0
$50
$100
$150
$200
$250
$300
1Q10
Volume
Price
& Mix
Input Costs
Operations
& Costs
Maintenance
Outages
1Q11 |
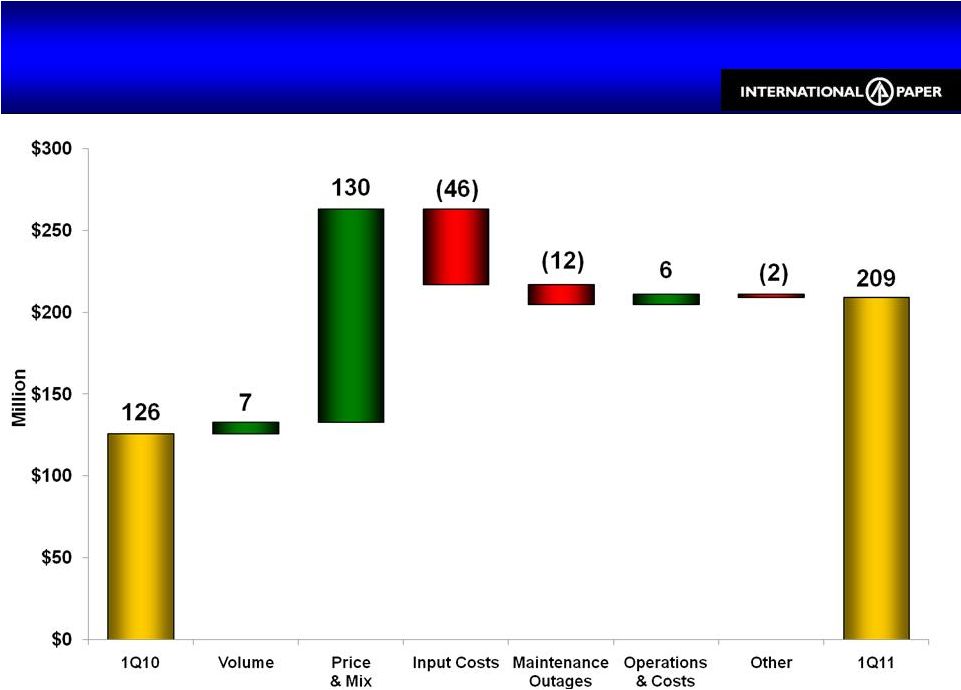 41
Printing Papers Earnings
1Q11 vs. 1Q10
Printing Papers Earnings
1Q11 vs. 1Q10
Earnings before special items |
 42
$ Million
1Q10
4Q10
1Q11
Sales
$225
$315
$285
Earnings
$11
$63
$48
EBITDA Margin
20%
32%
30%
IP Brazil results are reported in the Printing Papers segment
IP Brazil
IP Brazil
1Q11 vs. 4Q10
1Q11 vs. 1Q10
Business
Volume
Price /
Ton
Volume
Price /
Ton
Uncoated Freesheet
(5%)
($8)
13%
$92
Domestic
(19%)
($27)
16%
$8
Export
6%
$4
11%
$148 |
 43
Consumer Packaging Earnings
1Q11 vs. 1Q10
Consumer Packaging Earnings
1Q11 vs. 1Q10
Earnings before special items |
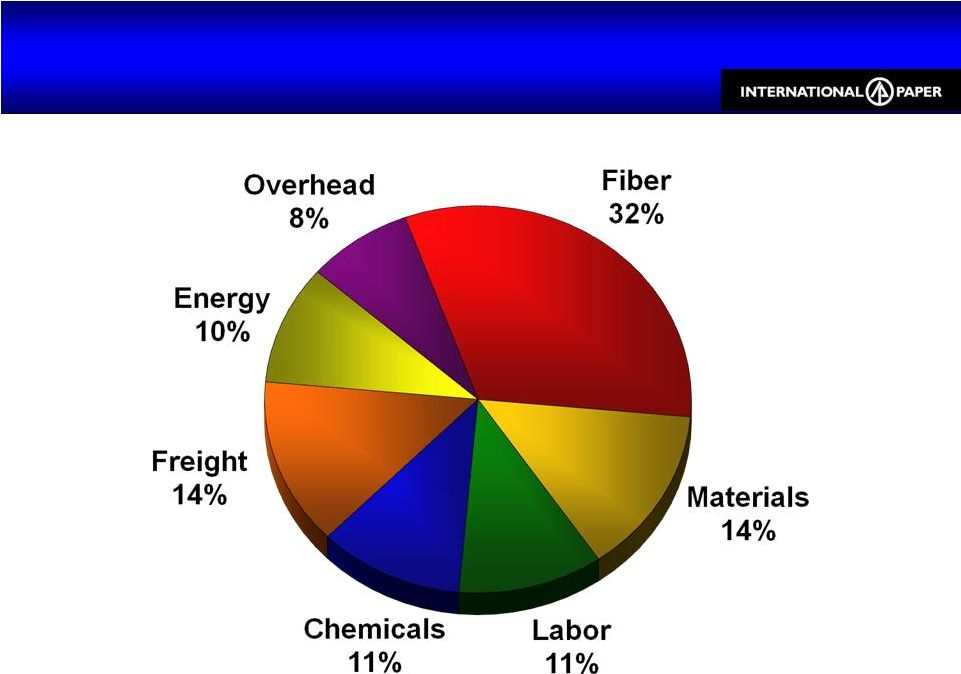 44
1Q11 Total North American Mills
Cash Cost Components
1Q11 Total North American Mills
Cash Cost Components |
 45
Global Input & Freight Costs vs. 1Q10
$80 MM Unfavorable, or $0.13/Share
Global Input & Freight Costs vs. 1Q10
$80 MM Unfavorable, or $0.13/Share
Input costs for continuing businesses |
 46
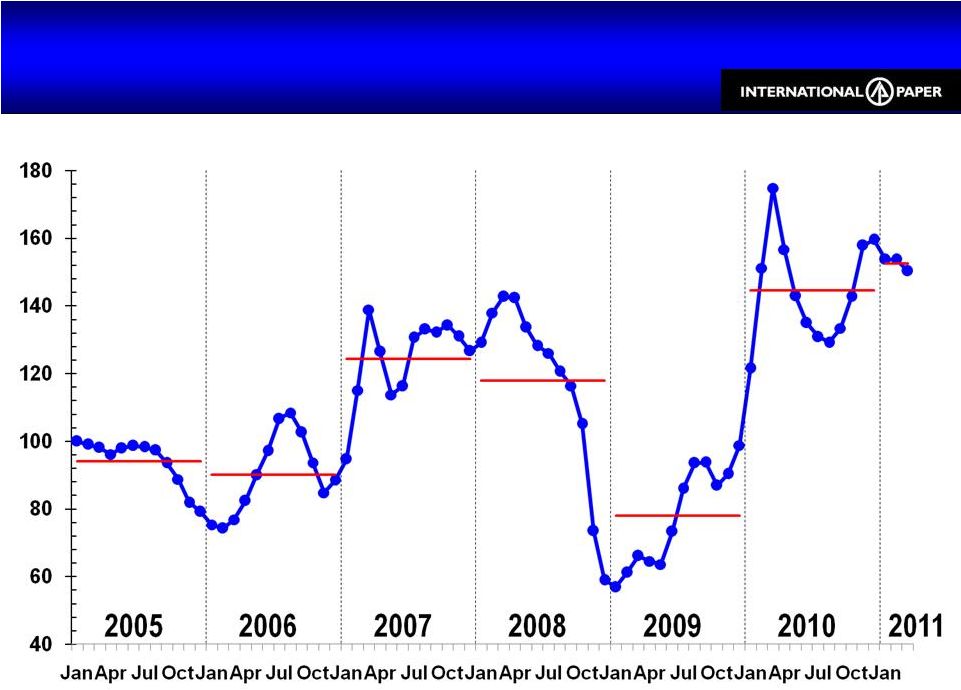
U.S. Mill Wood Delivered Cost Trends
2% Increase vs. 4Q10 Average Cost
U.S. Mill Wood Delivered Cost Trends
2% Increase vs. 4Q10 Average Cost
2011 |
 47
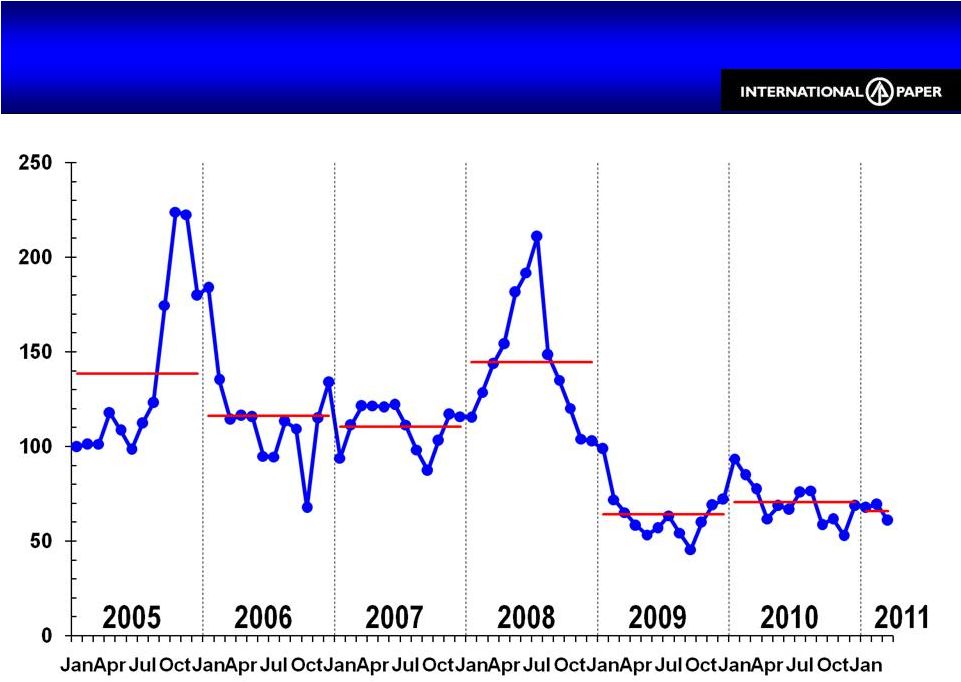
U.S. OCC Delivered Cost Trends
Flat vs. 4Q10 Average Cost
U.S. OCC Delivered Cost Trends
Flat vs. 4Q10 Average Cost
2005-2007 represents WY PKG delivered costs; 2008-2010 represents delivered
costs to the integrated system |
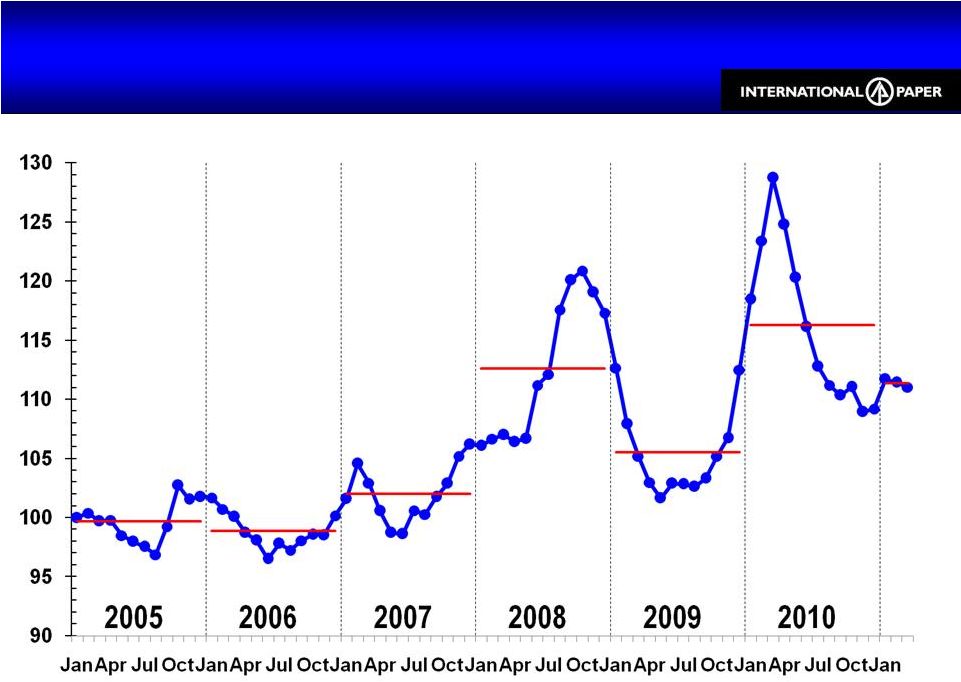
 48
NYMEX Natural Gas closing prices
Natural Gas Costs
8% Increase vs. 4Q10 Average Cost
Natural Gas Costs
8% Increase vs. 4Q10 Average Cost |
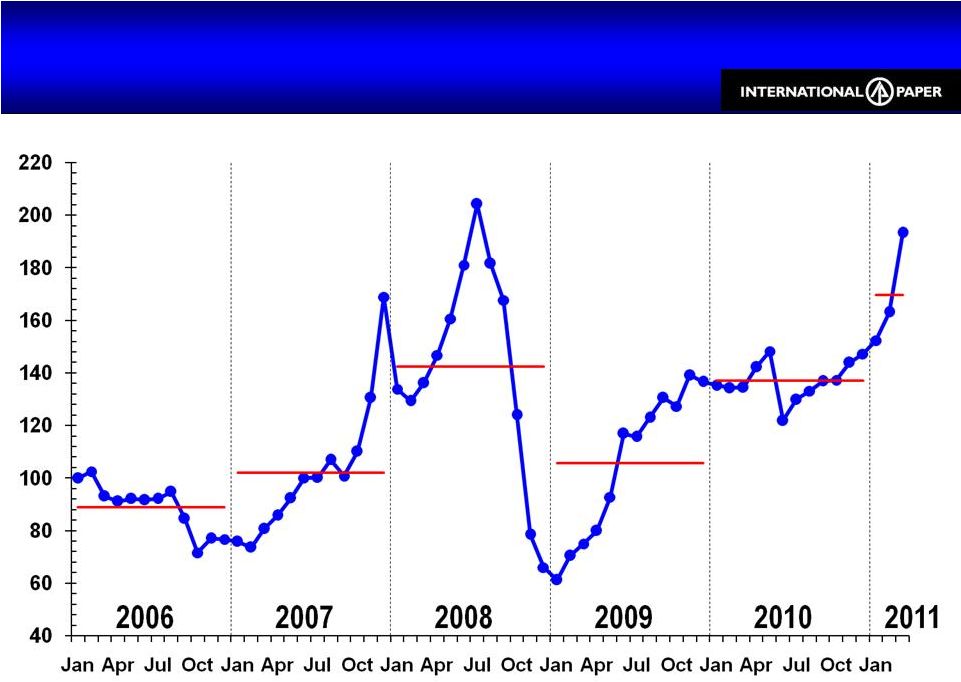 49
U.S. Fuel Oil
19% Increase vs. 4Q10 Average Cost
U.S. Fuel Oil
19% Increase vs. 4Q10 Average Cost
WTI Crude prices |
 50
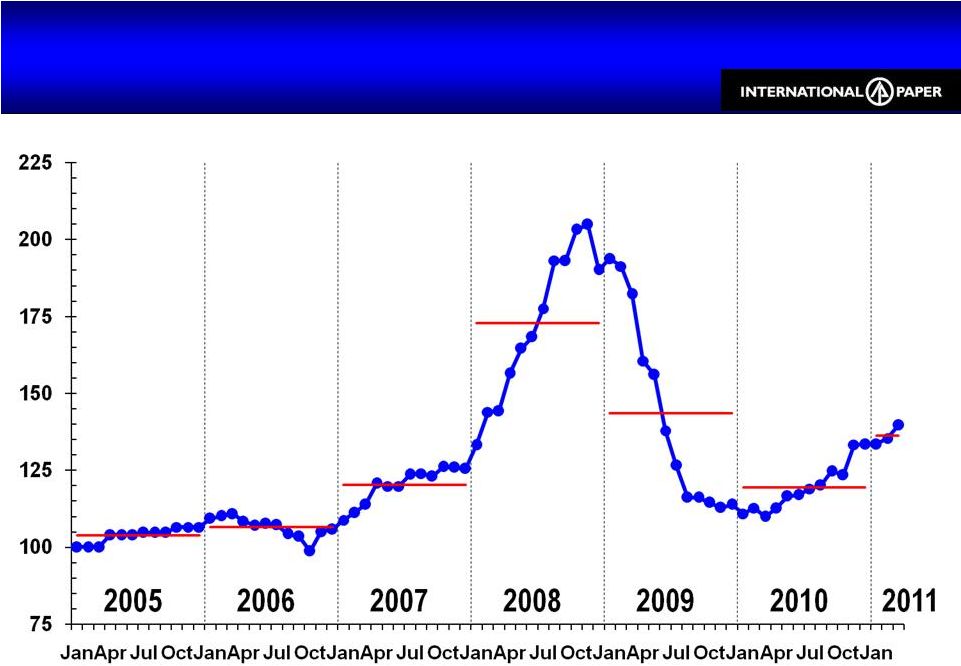
U.S. Chemical Composite Index
5% Increase vs. 4Q10 Average Cost
U.S. Chemical Composite Index
5% Increase vs. 4Q10 Average Cost
Delivered
cost
to
U.S.
facilities;
includes
Caustic
Soda,
Sodium
Chlorate,
Starch
and
Sulfuric
Acid
2005 -
2008 excludes WY PKG |
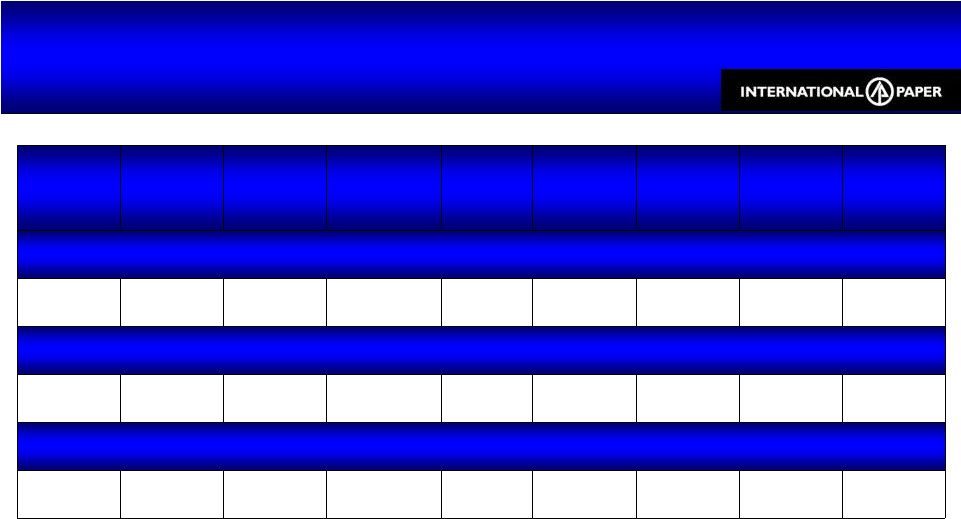
 51
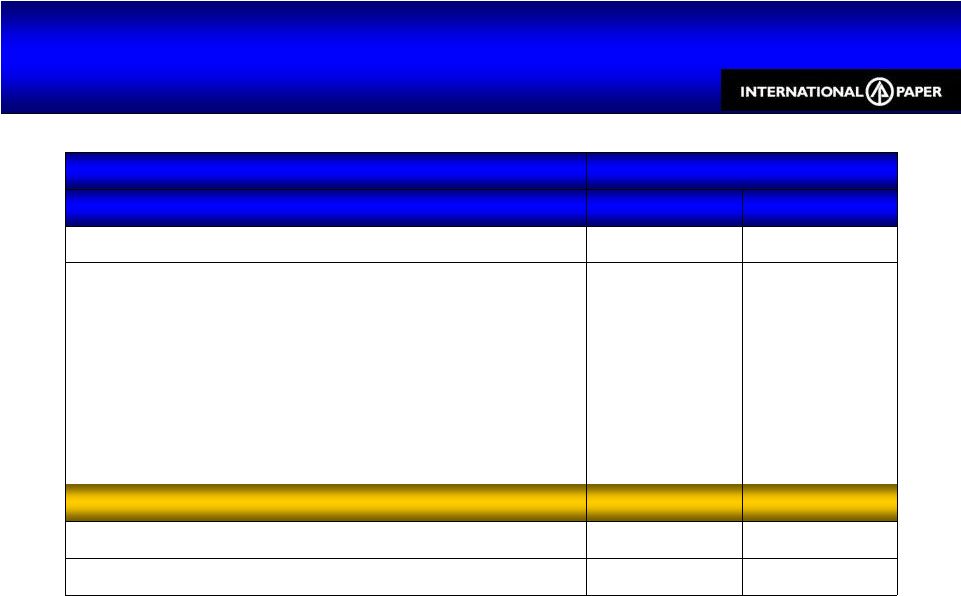
2011 Global Consumption
Annual Purchase Estimates for Key Inputs
2011 Global Consumption
Annual Purchase Estimates for Key Inputs
Does not include Asian or Ilim consumption
Estimates are based on normal operations and may be impacted by downtime
Commodity
U. S.
Non –
U. S.
Energy
Natural Gas (MM BTUs)
48,000,000
13,000,000
Fuel Oil (Barrels)
1,200,000
380,000
Coal (Tons)
840,000
410,000
Fiber
Wood (Tons)
44,200,000
9,300,000
Old Corrugated Containers (Tons)
3,400,000
142,000
Chemicals
Caustic Soda (Tons)
340,000
70,000
Starch (Tons)
385,000
100,000
Sodium Chlorate (Tons)
205,000
45,000
LD Polyethylene (Tons)
41,000
-
Latex (Tons)
21,000
7,000 |