Attached files
| file | filename |
|---|---|
| EX-99.1 - EXHIBIT 99.1 - Encompass Health Corp | exhibit99-1.htm |
| 8-K - FORM 8-K - Encompass Health Corp | form8k-2011q1.htm |

First Quarter 2011 Earnings Call
Supplemental Slides
Exhibit 99.2

The information contained in this presentation includes certain estimates, projections and other forward-
looking information that reflect our current views and plans with respect to future events, strategy, capital
expenditures and financial performance. These estimates, projections and other forward-looking
information are based on assumptions that HealthSouth believes, as of the date hereof, are reasonable.
Inevitably, there will be differences between such estimates and actual events or results, and those
differences may be material.
There can be no assurance that any estimates, projections or forward-looking information will be realized.
All such estimates, projections and forward-looking information speak only as of the date hereof.
HealthSouth undertakes no duty to publicly update or revise the information contained herein.
HealthSouth undertakes no duty to publicly update or revise the information contained herein.
You are cautioned not to place undue reliance on the estimates, projections and other forward-looking
information in this presentation as they are based on current expectations and general assumptions and
are subject to various risks, uncertainties and other factors, including those set forth in the Form 10-K for the
year ended December 31, 2010, our Form 10-Q for the quarter ended March 31, 2011, when filed, and in
other documents we previously filed with the SEC, many of which are beyond our control, that may cause
actual events or results to differ materially from the views, beliefs and estimates expressed herein.
Note Regarding Presentation of Non-GAAP Financial Measures
The following presentation includes certain “non-GAAP financial measures” as defined in Regulation G
under the Securities Exchange Act of 1934. Schedules are attached that reconcile the non-GAAP financial
measures included in the following presentation to the most directly comparable financial measures
calculated and presented in accordance with Generally Accepted Accounting Principles in the United
States. Our Form 8-K, dated April 28, 2011, to which the following supplemental slides are attached as
Exhibit 99.2, provides further explanation and disclosure regarding our use of non-GAAP financial measures
and should be read in conjunction with these supplemental slides.
Forward-Looking Statements
2
Exhibit 99.2
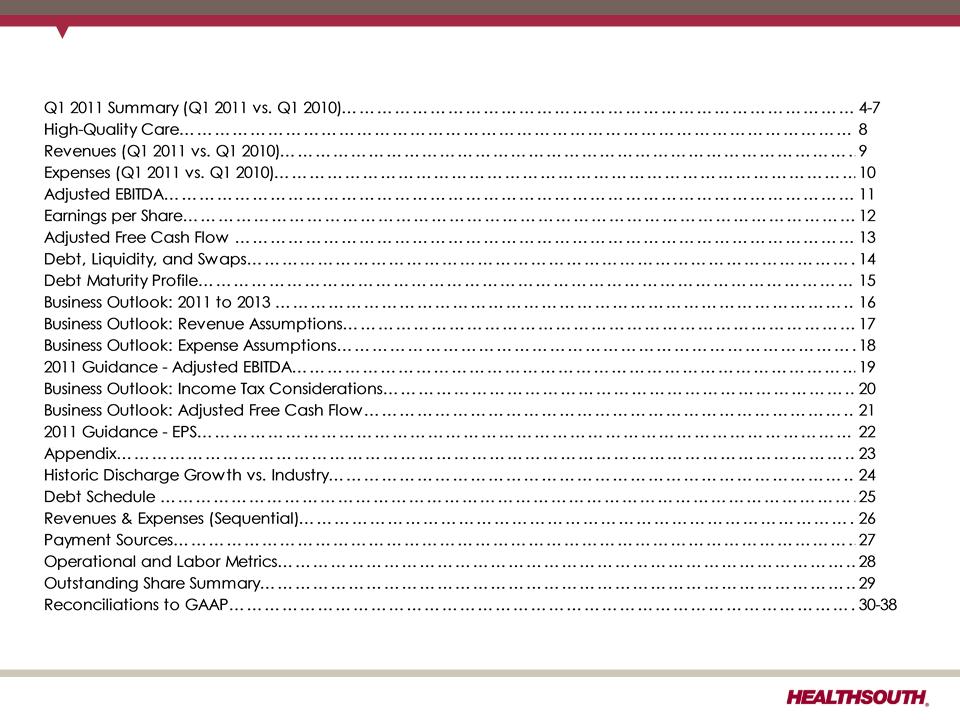
Table of Contents
3
Exhibit 99.2
Q1 2011 Summary (Q1 2011 vs. Q1 2010)
ü Revenue growth of 9.6%
― Inpatient revenue growth of 9.2% driven by volume and price
§ Discharge growth 7.1%; same-store discharge growth 4.5%
• Against soft volume growth in Q1 2010
• Continued positive contribution from hospitals opened or acquired in the
last 12 months
last 12 months
§ Revenue per discharge increase of 1.9%; Medicare and managed care
price adjustments
price adjustments
• 25 bps reduction in Medicare market basket price on April 1, 2010
― Revenue benefited by $4.3 million for net state provider tax refunds ($5.1 million
outpatient and other revenue and ($0.8) million inpatient revenue).
outpatient and other revenue and ($0.8) million inpatient revenue).
|
Location
|
# of Beds
|
Transaction
|
Date
|
|
Loudoun County, VA
|
40
|
De Novo
|
Q2 2010
|
|
Las Vegas, NV
|
50
|
Acquired new IRF
|
Q2 2010
|
|
Bristol, VA
|
25
|
De Novo
|
Q3 2010
|
|
Houston, TX
|
50
|
Acquired new IRF
|
Q3 2010
|
4
Exhibit 99.2

Q1 2011 Summary (Q1 2011 vs. Q1 2010) (cont.)
ü SWB as a percent of revenue decreased 110 bps.
― Higher volumes and improved productivity
― Revenue related to state provider tax refunds contributed 30 bps to the
improvement.
improvement.
ü Hospital-related expenses as a percent of revenue declined 10 bps.
― Provision for bad debt benefited from recovery of prior period write offs.
― Offset by state provider tax expenses of $3.2 million
ü Adjusted EBITDA(1) grew 16.0%.
― Revenue growth driven by volume and pricing, disciplined expense
management, lower general and administrative expense, and lower bad
debt expense
management, lower general and administrative expense, and lower bad
debt expense
― Net benefit related to state provider taxes refunds of net $1.1 million
(1) Reconciliation to GAAP provided on slides 30, 31, 34, and 38.
5
Exhibit 99.2

Q1 2011 Summary (Q1 2011 vs. Q1 2010) (cont.)
ü Income from continuing operations attributable to HealthSouth was $0.60 per diluted
share.
share.
― Increase driven by an income tax benefit, higher Adjusted EBITDA, and lower
nonrecurring items
nonrecurring items
§ The income tax benefit of $0.27 per diluted share is related to the Company’s
settlement with the IRS for tax years 2007 and 2008, and a reduction in
unrecognized tax benefits.
settlement with the IRS for tax years 2007 and 2008, and a reduction in
unrecognized tax benefits.
§ The settlement resulted in an increase to federal NOLs, which had an ending
balance of approx. $1.45 billion as of 3/31/11.
balance of approx. $1.45 billion as of 3/31/11.
§ Cash income taxes in Q1 2011 were $2.6 million.
― Offset by higher interest expense, depreciation, and stock-based compensation
ü Strong adjusted free cash flow generation (1)
― Higher Adjusted EBITDA
― Offset by anticipated increase in working capital, interest expense, and
maintenance capital expenditures
maintenance capital expenditures
― The final swap payment of $10.9 million was made in March 2011.
6
(1) Reconciliation to GAAP provided on slide 37.
Exhibit 99.2

Q1 2011 Summary (Q1 2011 vs. Q1 2010) (cont.)
ü Additional capital structure enhancements
― Raised $122 million by reopening the 2018 and 2022 senior notes
§ Utilized proceeds to repay $45 million outstanding under the revolving
credit facility
credit facility
§ Held $77 million in cash for repayment of the 10.75 % senior notes
ü Growth
― Received final approval for CON in Marion County (Ocala),FL; expect to
begin accepting patients Q1 2013.
begin accepting patients Q1 2013.
― Added 31 new licensed beds during the quarter
ü TeamWorks Care Management implementation completed in 39 hospitals
ü Returned to positive shareholders’ equity of $72.3 million
7
Exhibit 99.2
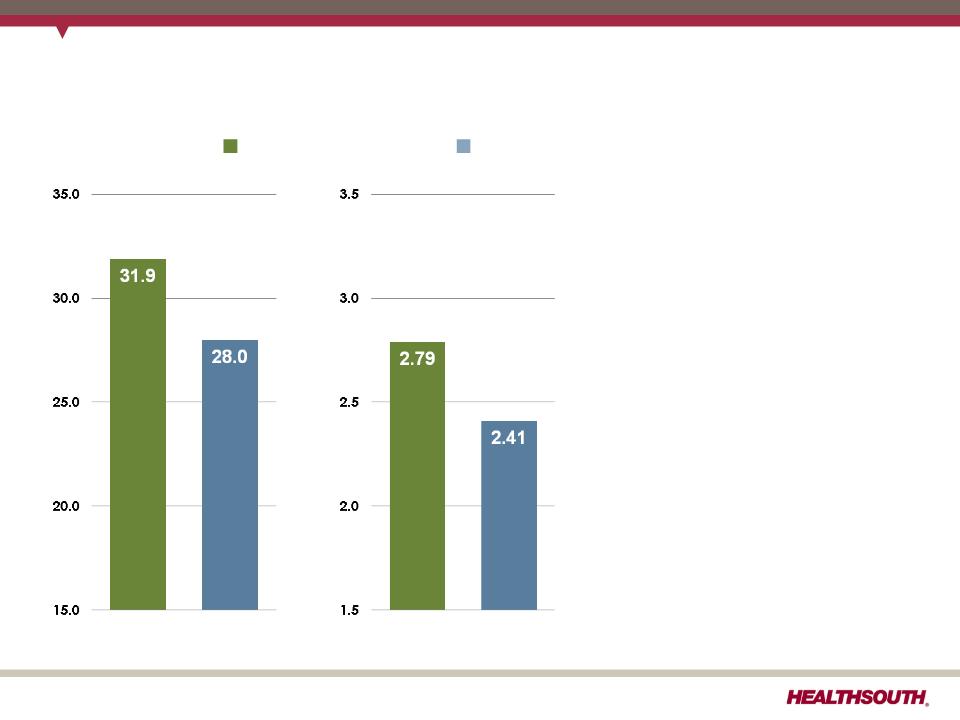
HealthSouth Functional Outcomes Continue to Outpace Industry Average
HealthSouth Average
UDS Average*
FIM Gain
LOS Efficiency
* Average = Expected, Risk-adjusted
Source: UDSmr Database - On Demand Report: Q1 2011 Report
FIM Gain
Change in Functional
Independence
Measurement (based
Independence
Measurement (based
on an 18 point
assessment) from
admission to discharge.
assessment) from
admission to discharge.
LOS Efficiency
Functional gain divided
by length of stay.
by length of stay.
High-Quality Care
8
Exhibit 99.2

ü Revenue growth of 9.6%
– Inpatient revenue growth of 9.2% driven by volume and price
§ Discharge growth of 7.1%; same-store discharge growth of 4.5%
• Against soft volume growth in Q1 2010
• Continued positive contribution from hospitals opened or acquired in the last 12 months
§ Revenue per discharge increased 1.9%; Medicare and managed care price adjustments
• 25 bps reduction in the Medicare market basket on April 1, 2010
― Revenue benefited by $4.3 million for net state provider tax refunds ($5.1 million outpatient
revenue and other, ($0.8) million inpatient revenue).
revenue and other, ($0.8) million inpatient revenue).
9
Exhibit 99.2
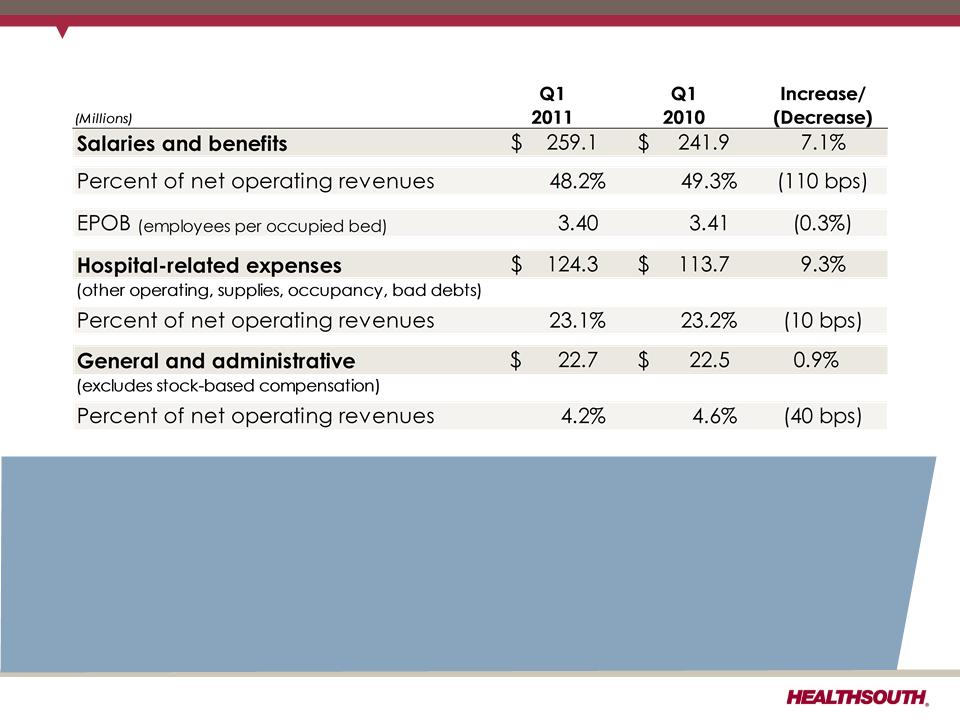
Expenses (Q1 2011 vs. Q1 2010)
ü SWB as a percent of revenue decreased 110 bps.
― Higher volumes and improved productivity
― Revenue related to state provider tax refunds contributed to the improvement.
ü Hospital-related expenses as a percent of revenue declined 10 bps.
― Provision for bad debt benefited from recovery of prior period write offs.
― Offset by state provider tax expenses of $3.2 million
10
Exhibit 99.2

Adjusted EBITDA Change
Q1 2011
+$17.0M
+16.0%
Improvements driven by:
•Revenue growth driven by
higher volumes and price,
disciplined expense
management, lower general
and administrative expense,
and lower bad debt expense
higher volumes and price,
disciplined expense
management, lower general
and administrative expense,
and lower bad debt expense
Improvements benefited from:
•Net state provider tax refunds
of $1.1 million
of $1.1 million
Adjusted EBITDA (1)
11
Exhibit 99.2
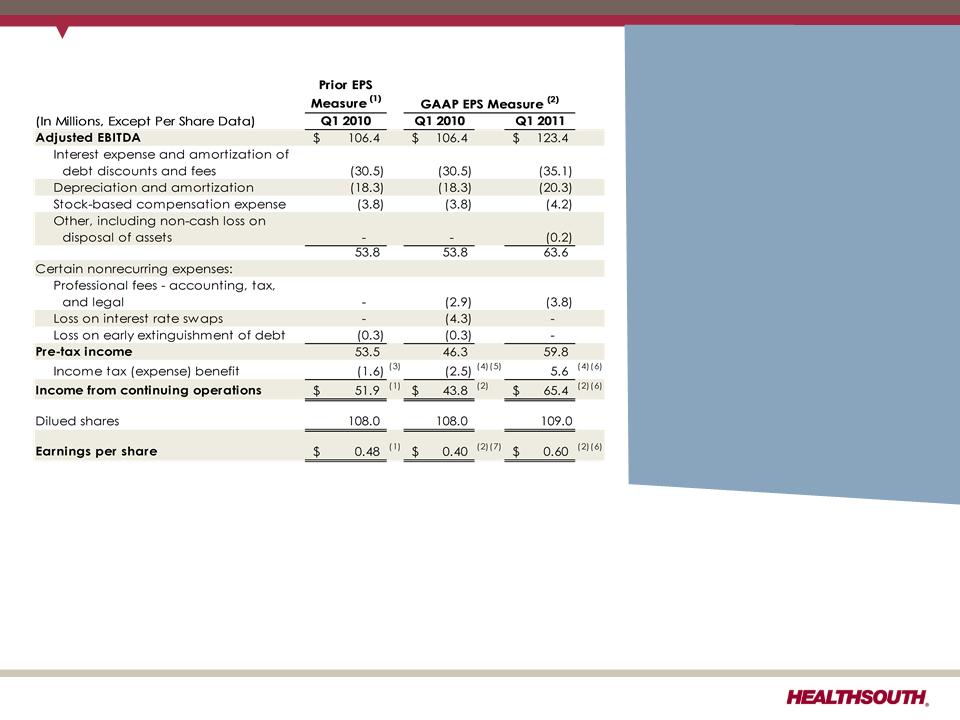
Earnings per Share from
Continuing Operations (1)
Continuing Operations (1)
Q1 2011
+$0.20
+50%
Increase driven by:
•Income tax benefit(6) , higher Adjusted
EBITDA and lower nonrecurring expenses
EBITDA and lower nonrecurring expenses
§ The settlement resulted in an
increase to our federal NOLs,
which had an ending balance of
approx. $1.45 billion as of 3/31/11.
increase to our federal NOLs,
which had an ending balance of
approx. $1.45 billion as of 3/31/11.
§ Cash income taxes in Q1 2011
were $2.6 million.
were $2.6 million.
Increase offset by:
•Higher interest expense, depreciation
and stock-based compensation
and stock-based compensation
Earnings per Share
12
(1) Adjusted income from continuing operations. This non-GAAP measure was part of our historical guidance. A reconciliation of adjusted income from
continuing operations to the corresponding GAAP measure can be found on slides 35 and 36.
continuing operations to the corresponding GAAP measure can be found on slides 35 and 36.
(2) Income from continuing operations attributable to HealthSouth
(3) Current period amounts in income tax provision: can be found on slides 35 and 36
(4) Actual tax provision recorded for the period
(5) During Q1 2010, the Company maintained a valuation allowance against substantially all of its deferred tax assets. A substantial portion of the valuation
allowance was released in Q4 2010.
allowance was released in Q4 2010.
(6) Includes a $0.27 per diluted share benefit related to the Company’s settlement with the IRS for tax years 2007 and 2008 and a reduction in unrecognized tax
benefits due to the lapse of the statute of limitations for certain federal and state claims. Cash income taxes for Q1 2011 were $2.6 million.
benefits due to the lapse of the statute of limitations for certain federal and state claims. Cash income taxes for Q1 2011 were $2.6 million.
(7) Represents basic earnings per share using 92.7 million shares due to anti-dilutive impact in the period
Exhibit 99.2
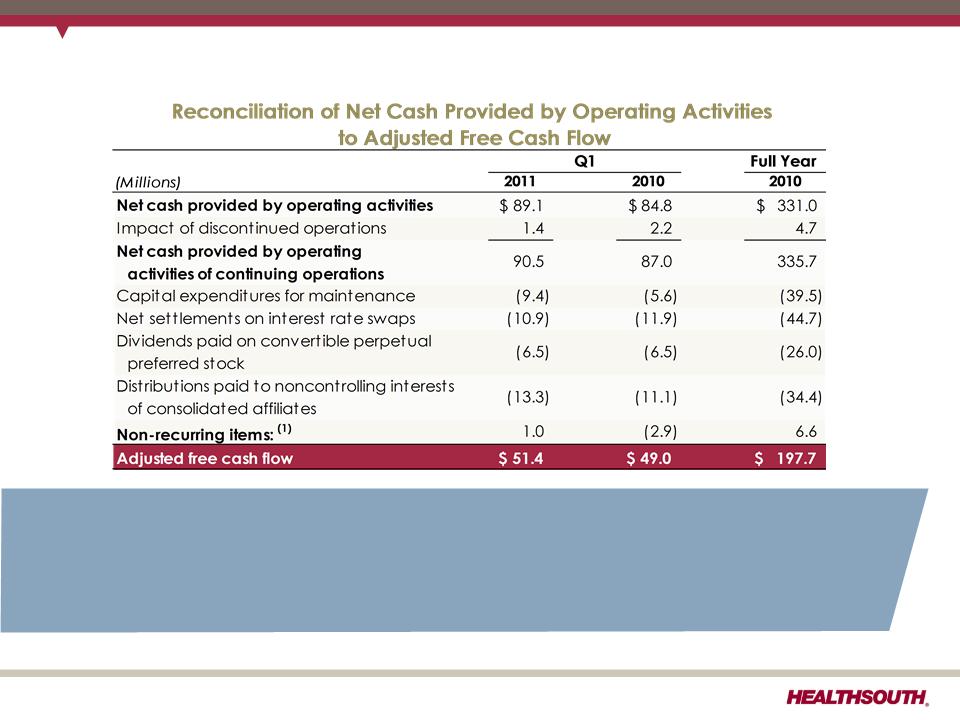
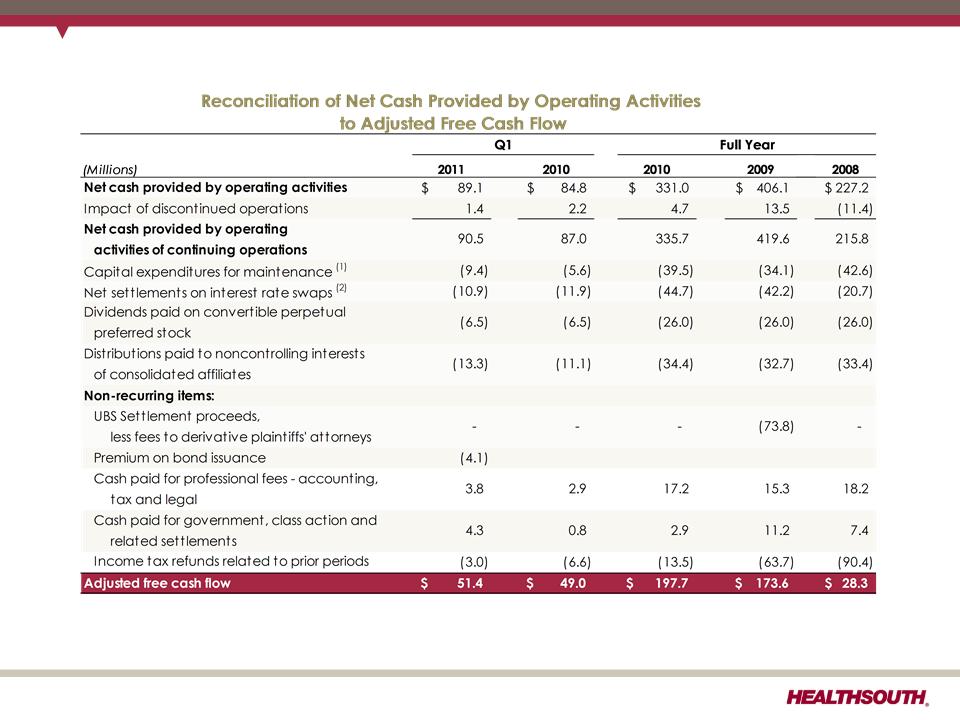
Adjusted Free Cash Flow (Q1 2011 vs. Q1 2010)
(1) For additional information on non-recurring items, see slide 37.
• Continued strong adjusted free cash flow generation (1)
– Q1 2011 benefited from higher Adjusted EBITDA
– Offset by anticipated increases in working capital, interest expense and maintenance
capital expenditures
capital expenditures
– Final swap payment of $10.9 million was made in March 2011.
13
Exhibit 99.2
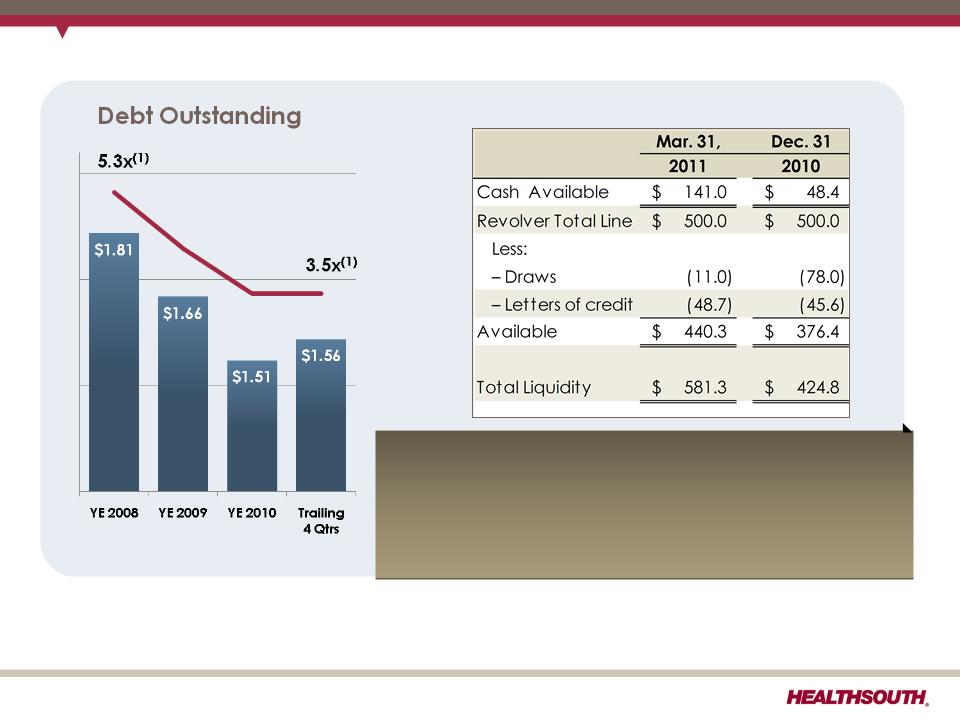
(1) Based on 2008 and trailing 4 quarter Adjusted EBITDA of $341.2 million and $444.4 million, respectively; reconciliation to GAAP provided
on slides 30 - 34 and 38.
on slides 30 - 34 and 38.
(2) Cash settlements flow through investing activities for swaps that do not qualify for hedge accounting. Net notional amount of $884 million
received 3-month LIBOR and paid 5.22% fixed until expiration in March of 2011.
received 3-month LIBOR and paid 5.22% fixed until expiration in March of 2011.
Debt, Liquidity, and Swaps
Swaps (2)
The final cash settlement on our net $884 million swaps
for $10.9 million was made in Q1 2011.
for $10.9 million was made in Q1 2011.
Liquidity
14
Exhibit 99.2
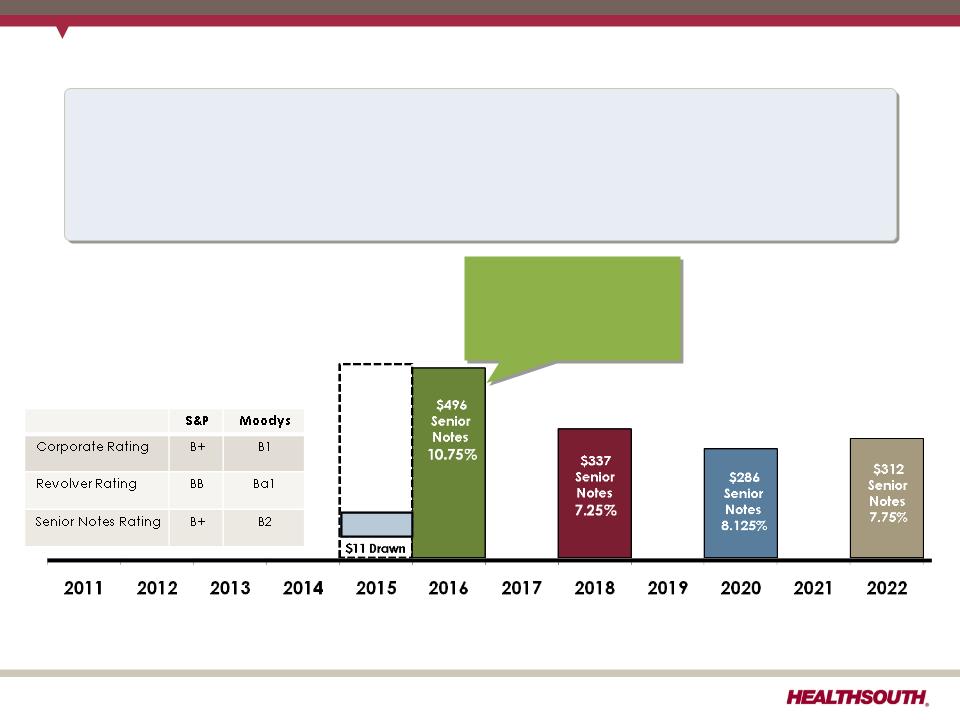
(1) Does not include $387.4 million of convertible perpetual preferred stock and ~$123 million of capital leases and other note payables.
Debt Maturity Profile (1)
15
Call schedule:
June 15, 2011 (price 105.375);
June 15, 2012 (price 103.583);
June 15, 2013 (price 101.792);
June 15, 2014 and thereafter
(price 100.000)
(price 100.000)
As of March 31, 2011
$49 LC
$500
Revolver
L+350
Plan to call $285 million of the 10.75% senior notes:
§Cash use of approx. $300 million ($223 million revolver and $77 million cash)
• Interest savings for second half of 2011 will be ~$12 million
• Loss on early extinguishment of debt is expected to be ~$23 million.
Exhibit 99.2
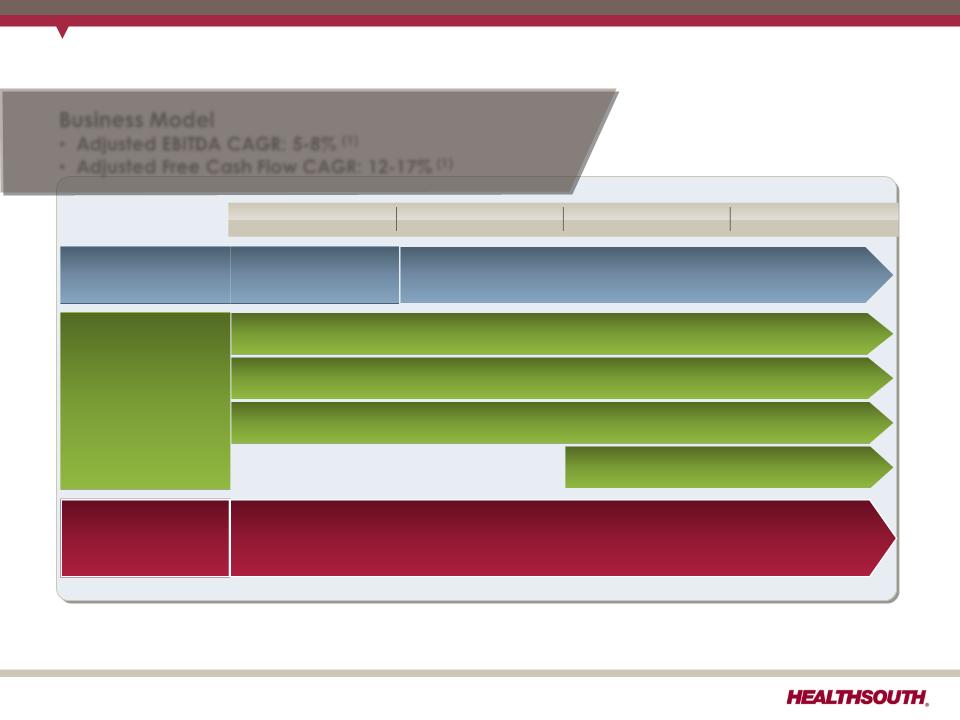
Business Outlook: 2011 to 2013
Business Model
• Adjusted EBITDA CAGR: 5-8% (1)
• Adjusted Free Cash Flow CAGR: 12-17% (1)
Strategy
2010
2011
2012
2013
Delevering (2)
Goal: < 4.0x
debt to EBITDA
debt to EBITDA
Longer-Term Goal: ~ 3.0x
debt to EBITDA (3.5x goal achieved at year-end 2010)
debt to EBITDA (3.5x goal achieved at year-end 2010)
Growth
Organic growth (includes capacity expansions)
De novos (~ 2-3/year)
IRF acquisitions (~ 2-3/year)
Opportunistic, disciplined acquisitions
of complementary post-acute services
of complementary post-acute services
Key Operational
Initiatives
Initiatives
• Beacon (Management Reporting Software) = Labor / outcomes / quality optimization
• TeamWorks = Care Management
• “CPR” (Comfort, Professionalism, Respect) Initiative
(1) Reconciliation to GAAP provided on slides 30 - 34, 37, and 38.
(2) Exclusive of any E&Y recovery.
16
Exhibit 99.2
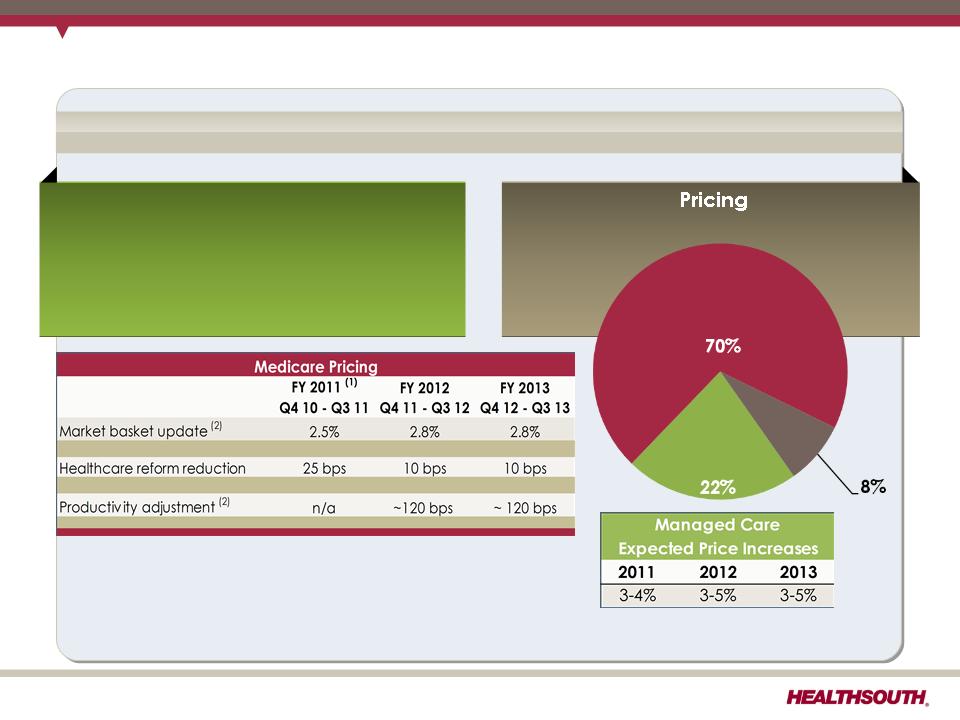
Business Outlook: Revenue Assumptions
Revenue
Volume
•2.5% to 3.5% annual growth (excludes
acquisitions)
acquisitions)
•Includes bed expansions, de novos
and unit consolidations
and unit consolidations
Medicare
Managed
Care
Care
Other
(1) We believe based on the 2011 Medicare rule for IRFs, HealthSouth should realize an increase of approximately 2.1% annually.
(2) CMS proposed IRF Rule for FY 2012 and management estimates for FY 2013
17
Exhibit 99.2
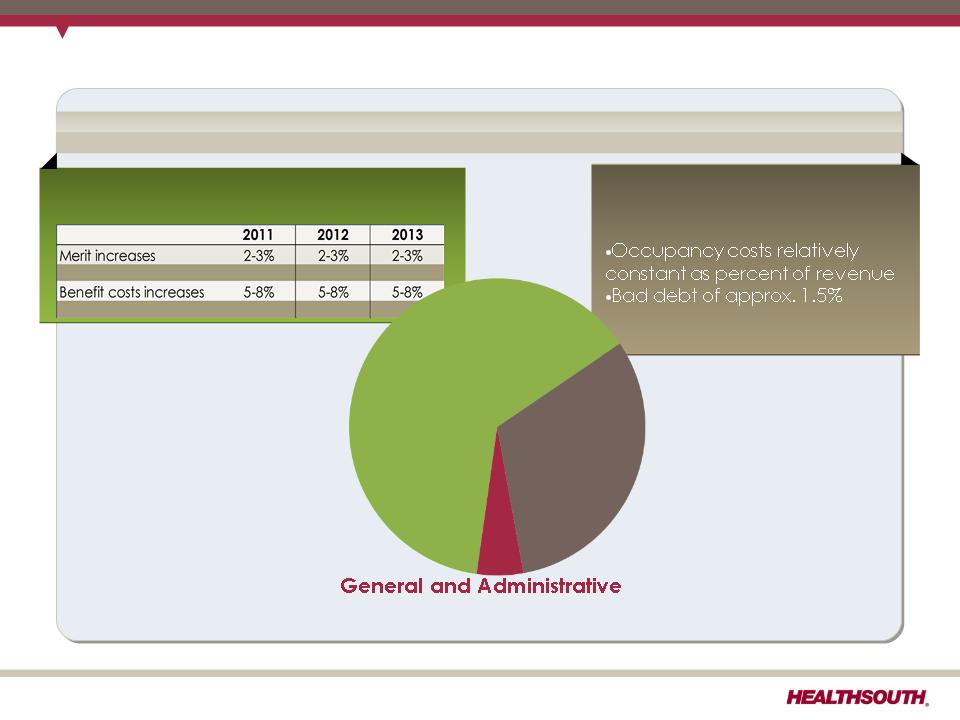
Business Outlook: Expense Assumptions
Expense
Salaries & Benefits (1)
Hospital Expenses
•Other operating and supplies
tracking with inflation
tracking with inflation
4.5% of revenue
(excludes stock-based compensation)
Salaries
& Benefits
Hospital
Expenses
Expenses
(1) Salaries, Wages and Benefits: 85% Salaries and Wages; 15% Benefits
18
Exhibit 99.2

2011 Guidance - Adjusted EBITDA
Adjusted EBITDA (1)
$440 million to $450 million
(1) Reconciliation to GAAP provided on slides 30 - 34 and 38.
Considerations:
ü2010 bad debt expense was 0.9% of revenue; expect 2011 bad debt expense to
be approximately 1.4% of revenue, in line with historical average
be approximately 1.4% of revenue, in line with historical average
üMedicare pricing in Q4 2011 will be reduced by a 120 basis point productivity
adjustment.
adjustment.
üOutpatient revenues subject to approximately $1.4 million reduction related to
the 25% rate reduction for reimbursement of therapy expenses for multiple therapy
services (Medicare physician fee schedule for calendar year 2011CMS).
the 25% rate reduction for reimbursement of therapy expenses for multiple therapy
services (Medicare physician fee schedule for calendar year 2011CMS).
Based on strong results for Q1 2011, HealthSouth expects
its 2011 full-year results to be at the high end of, or
greater than, this guidance range.
its 2011 full-year results to be at the high end of, or
greater than, this guidance range.
19
Exhibit 99.2

Business Outlook: Income Tax Considerations
|
GAAP Considerations:
• As of 3/31/11, the Company had a remaining valuation allowance of approximately
$106 million, primarily related to state NOLs. • Q1 2011 tax provision reflects a tax benefit of $0.27 per diluted share related to the
Company’s settlement with the IRS for tax years 2007 and 2008 and a reduction in unrecognized tax benefits due to the lapse of the statute of limitations for certain federal and state claims. The settlement resulted in an increase to our federal NOLs, which had an ending balance of approx. $1.45 billion as of 3/31/11. • Expect effective tax rate of ~40% going forward
Future Cash Tax Payments:
• The Company expects to pay approximately $7-$10 million per year of income tax.
•The Company does not expect to pay significant federal income taxes for up to 10
years. •HealthSouth is not currently subject to an annual use limitation (“AUL”) under Internal
Revenue Code Section 382 (“Section 382”). A “change of ownership,” as defined by Section 382, would subject us to an AUL, which is equal to the market capitalization of the Company at the time of the “change of ownership” multiplied by the long-term tax exempt rate. |
20
Exhibit 99.2
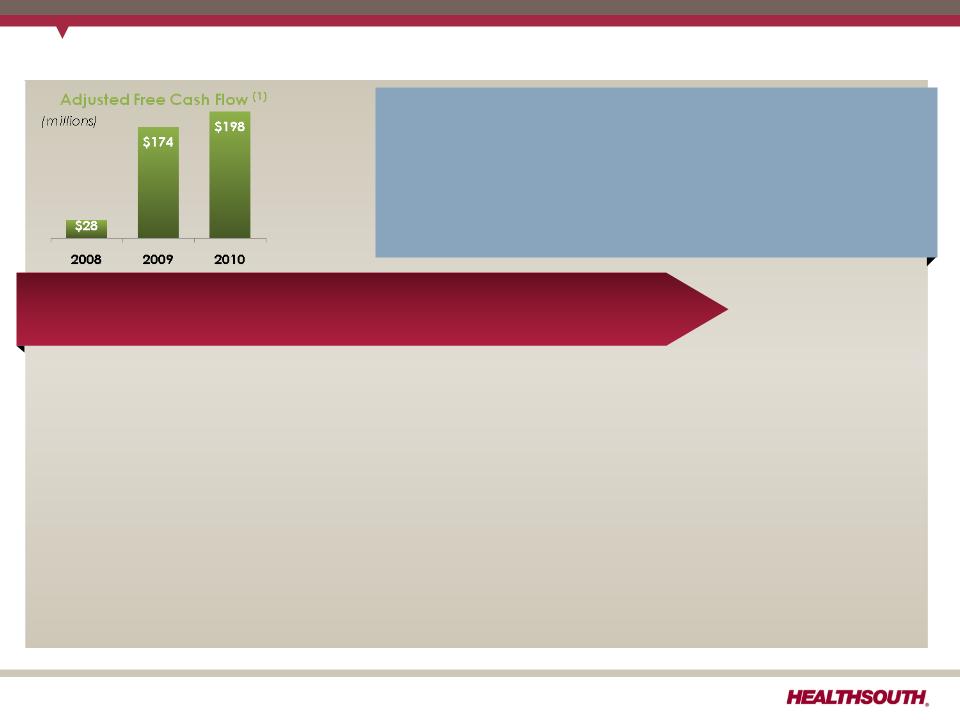
Business Outlook: Adjusted Free Cash Flow (1)
(1) Reconciliation to GAAP provided on slide 37.
• Items that will affect Adjusted Free Cash Flow in 2011:
+ Cash settlements for interest rate swaps will be $33.8 million lower in 2011.
+ Interest expense will be reduced by ~$12 million in the second half of 2011 as a result of a
plan to call $285 million of the 10.75% senior notes callable in June 2011.
plan to call $285 million of the 10.75% senior notes callable in June 2011.
– Maintenance capital expenditures are estimated to be approximately $20 million higher
in 2011 than 2010.
in 2011 than 2010.
– Interest expense will be approximately $10 million higher in the first half of 2011 versus
prior period, preceding the repayment/refinancing of $285 million of the 10.75% senior
notes.
prior period, preceding the repayment/refinancing of $285 million of the 10.75% senior
notes.
• 2010 working capital benefited from a shift in timing of interest payments related to the
refinancing in Q4 2010, offset by the $6.9 million unwind fee related to the termination of
the two forward-starting interest rate swaps.
refinancing in Q4 2010, offset by the $6.9 million unwind fee related to the termination of
the two forward-starting interest rate swaps.
HealthSouth’s GAAP income statement will be affected by a
number of items that will not affect cash flow from operating
activities or adjusted free cash flow:
number of items that will not affect cash flow from operating
activities or adjusted free cash flow:
•Normalized GAAP tax rate resulting from the valuation
allowance reversal in Q4 2010.
allowance reversal in Q4 2010.
•Loss on early extinguishment of debt
Multi-Year Adjusted Free Cash Flow 12% to 17% CAGR
21
Exhibit 99.2
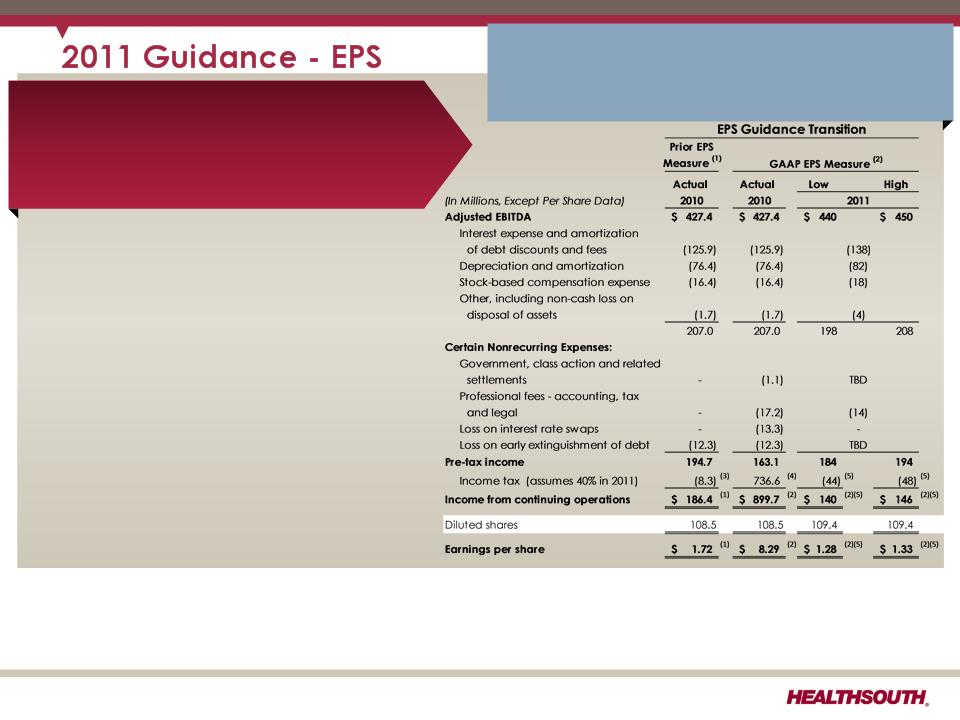
Diluted Earnings per Share from
Continuing Operations Attributable
to HealthSouth (2)
Continuing Operations Attributable
to HealthSouth (2)
$1.28 to $1.33 (5)
Considerations:
ü Includes $0.27 per diluted share benefit for Q1
2011 and assumes provision for income tax of
40% for the remainder of 2011; cash taxes
expected to be $7-$10 million.
2011 and assumes provision for income tax of
40% for the remainder of 2011; cash taxes
expected to be $7-$10 million.
üGuidance does not include any
repayment/refinancing of the 10.75% senior notes
callable in June 2011, which would affect the
following items:
repayment/refinancing of the 10.75% senior notes
callable in June 2011, which would affect the
following items:
• Interest expense will be approximately $10
million higher in the first half of 2011 vs. prior
period in 2010.
million higher in the first half of 2011 vs. prior
period in 2010.
• Does not include “loss on early extinguishment of
debt” (non-cash)
debt” (non-cash)
• Depreciation is estimated to be higher as a result
of capital expenditures in prior periods.
of capital expenditures in prior periods.
Based on strong results for Q1 2011, HealthSouth
expects its 2011 full-year results to be at the
high end of, or greater than, this guidance
range.
expects its 2011 full-year results to be at the
high end of, or greater than, this guidance
range.
(1) Adjusted income from continuing operations. This non-GAAP measure was part of our historical guidance. A reconciliation of adjusted income from
continuing operations to the corresponding GAAP measure can be found on slides 35 and 36.
continuing operations to the corresponding GAAP measure can be found on slides 35 and 36.
(2) Income from continuing operations attributable to HealthSouth
(3) Current period amounts in income tax provision; see slides 35 and 36
(4) Total income tax provision for full-year 2010, including the reversal of a substantial portion of the Company's valuation allowance against deferred tax assets.
(5) Includes a $0.27 per diluted share benefit related to the Company’s settlement with the IRS for tax years 2007 and 2008, and a reduction in unrecognized tax
benefits due to the lapse of the statute of limitations for certain federal and state claims.
benefits due to the lapse of the statute of limitations for certain federal and state claims.
22
Exhibit 99.2

Appendix
Exhibit 99.2
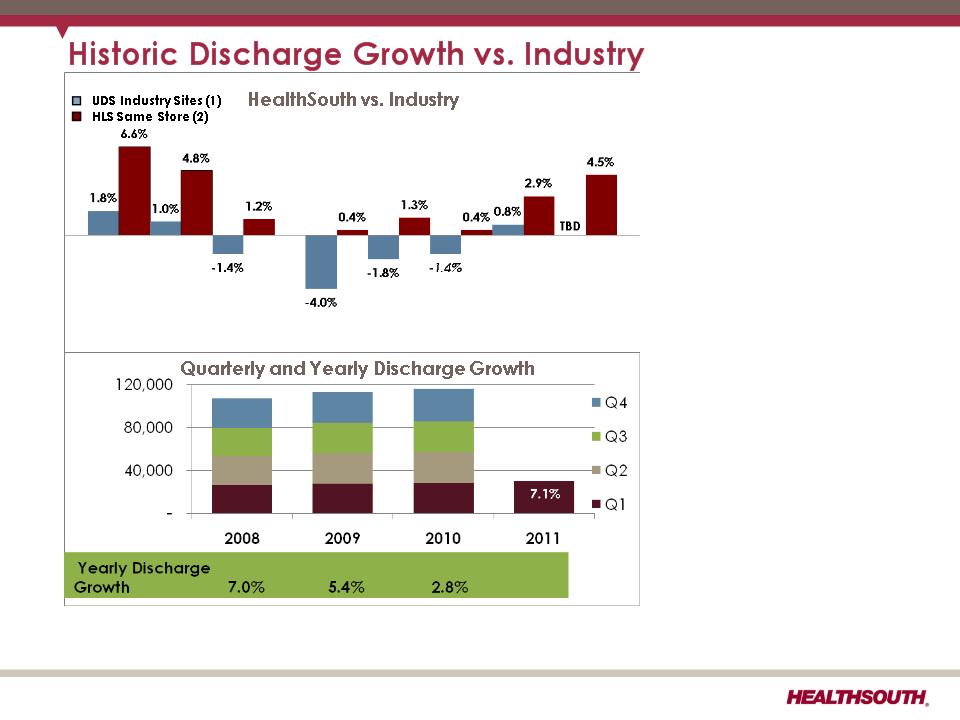
(1) Data provided by UDSMR, a data gathering and analysis organization for the rehabilitation industry; represents ~ 65-70% of industry,
including HealthSouth sites.
including HealthSouth sites.
(2) Includes consolidated HealthSouth inpatient rehabilitation hospitals and long-term acute care hospitals classified as same store during
that time period.
that time period.
• HealthSouth’s
volume growth has
outpaced
competitors’.
volume growth has
outpaced
competitors’.
• TeamWorks =
standardized and
enhanced sales &
marketing
standardized and
enhanced sales &
marketing
• Bed additions will
help facilitate
continued organic
growth.
help facilitate
continued organic
growth.
10.7%
9.4%
5.6%
2.6%
4.6%
5.5%
5.8%
5.8%
5.3%
2.5%
2.2%
1.1%
24
2008 vs. 2009 vs. 2010 vs. Q110 vs. Q210 vs. Q310 vs. Q410 vs. Q111 vs.
2007 2008 2009 Q109 Q209 Q309 Q409 Q110
Exhibit 99.2
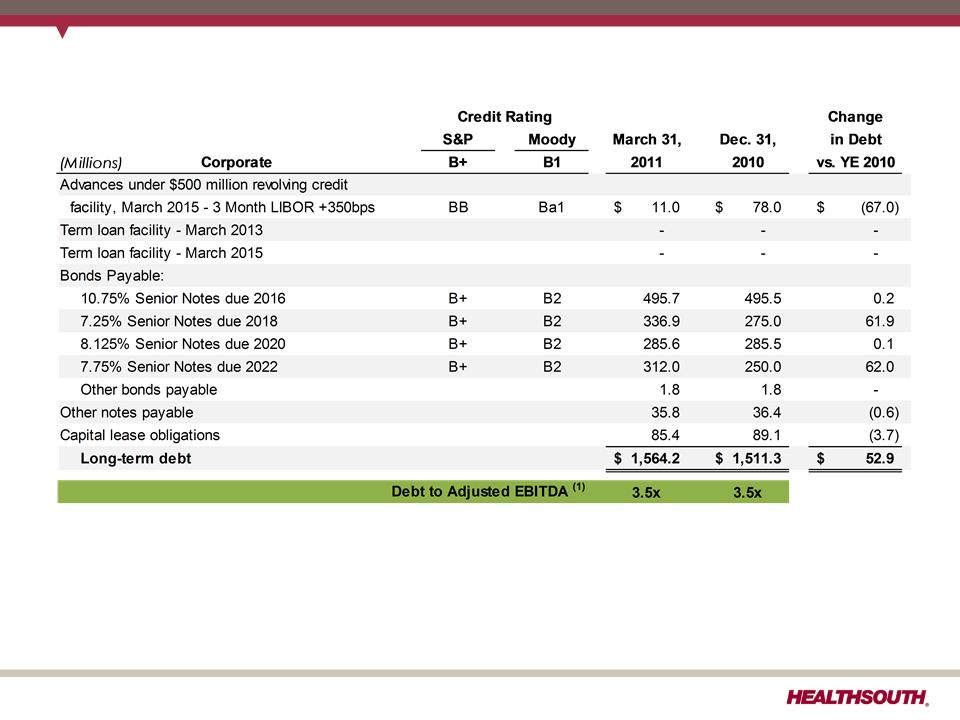
Debt Schedule
(1) Based on 4 quarter trailing and 2010 Adjusted EBITDA of $444.4 million and $427.4 million, respectively; reconciliation to GAAP provided
on slides 30, 31, 34 and 38.
on slides 30, 31, 34 and 38.
25
Exhibit 99.2
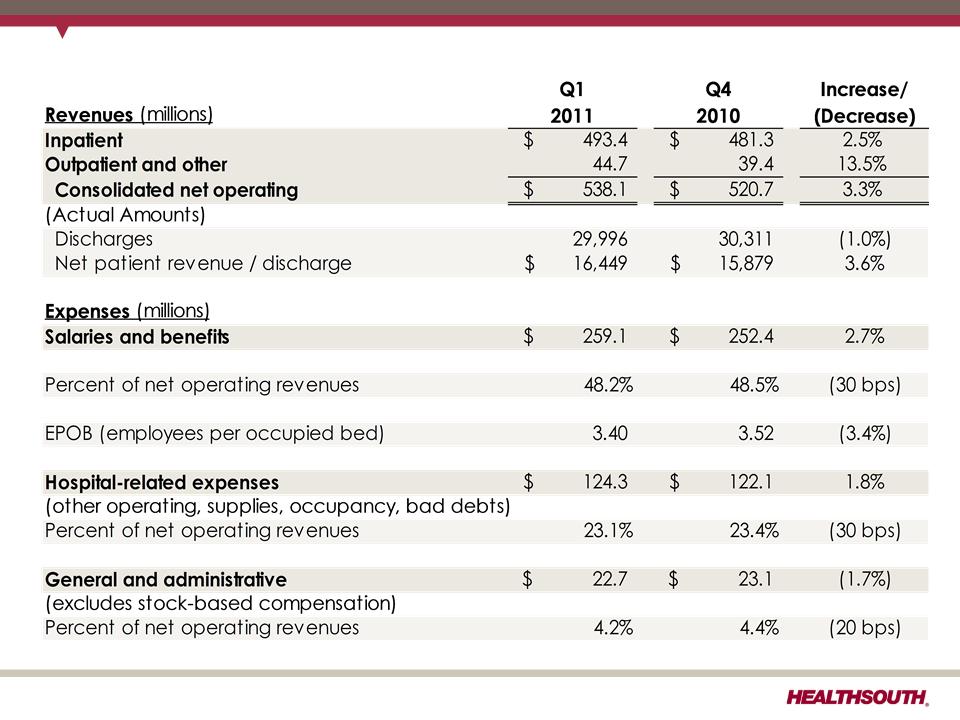
Revenues & Expenses (Sequential)
26
Exhibit 99.2
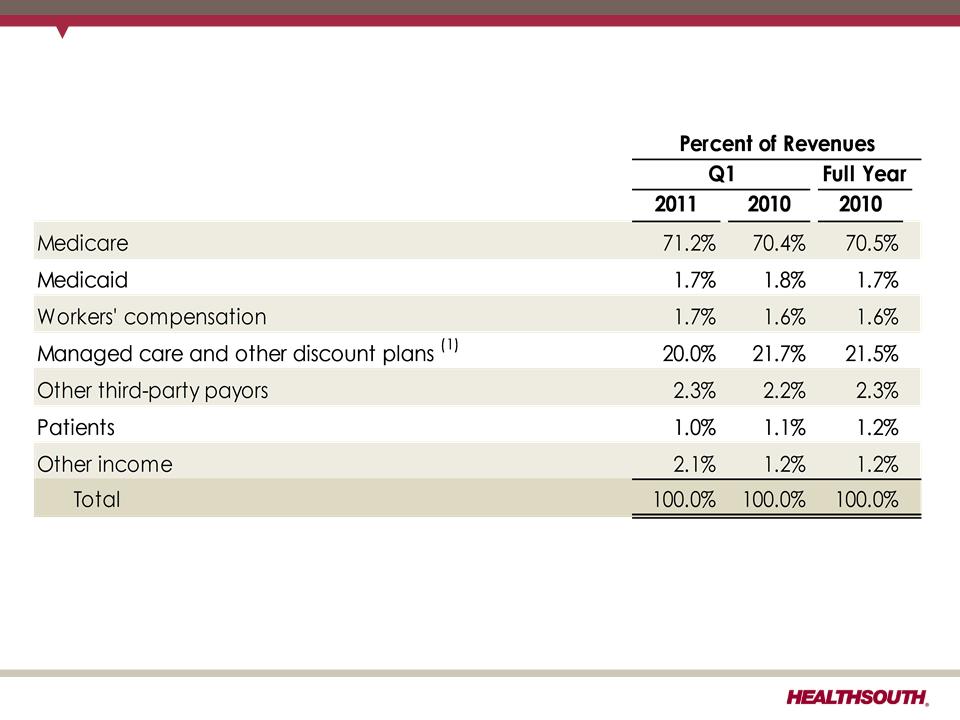
Payment Sources
(1) Managed Medicare revenues represent ~ 7%, 7%, and 8% of total revenues for Q1 2011, Q1 2010, and 2010, respectively, and are included
in “Managed care and other discount plans.”
in “Managed care and other discount plans.”
27
Exhibit 99.2
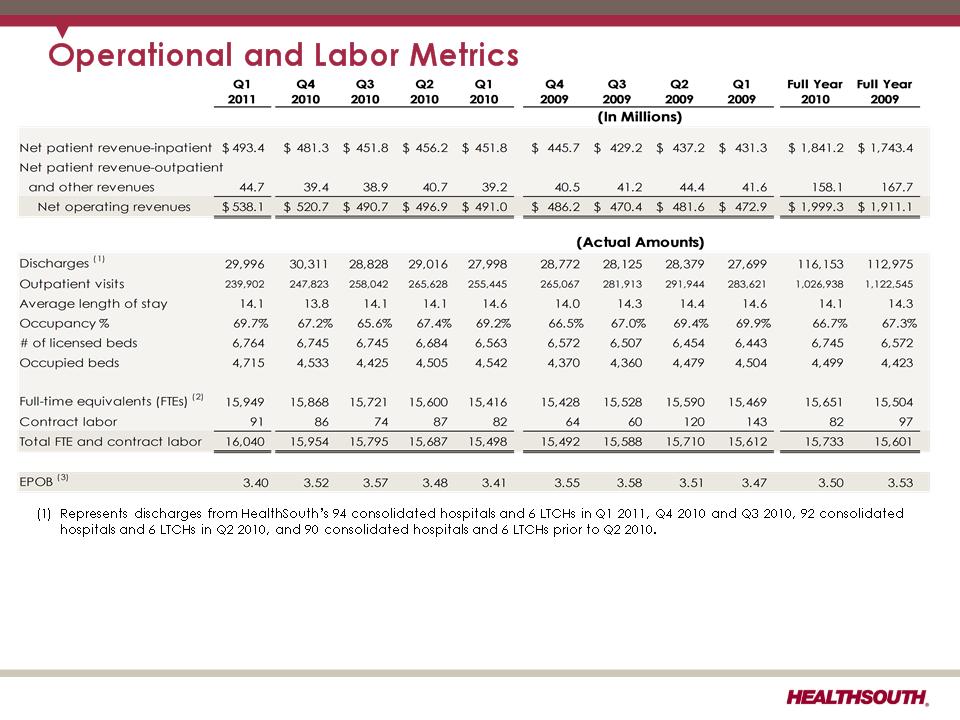
(2) Excludes approximately 400 full-time equivalents, who are considered part of corporate overhead with their salaries and benefits
included in general and administrative expenses in the Company’s consolidated statements of operations. Full-time equivalents
included in the above table represent HealthSouth employees who participate in or support the operations of the Company’s
hospitals.
included in general and administrative expenses in the Company’s consolidated statements of operations. Full-time equivalents
included in the above table represent HealthSouth employees who participate in or support the operations of the Company’s
hospitals.
(3) Employees per occupied bed, or “EPOB,” is calculated by dividing the number of full-time equivalents, including an estimate of full-
time equivalents from the utilization of contract labor, by the number of occupied beds during each period. The number of
occupied beds is determined by multiplying the number of licensed beds by the Company’s occupancy percentage.
time equivalents from the utilization of contract labor, by the number of occupied beds during each period. The number of
occupied beds is determined by multiplying the number of licensed beds by the Company’s occupancy percentage.
28
Exhibit 99.2
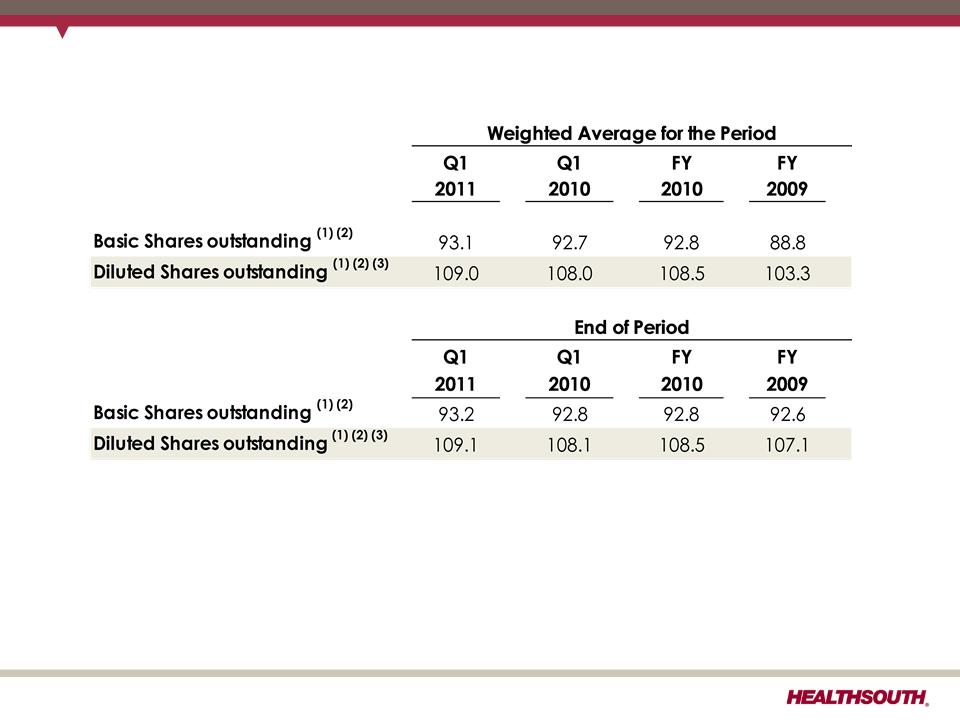
Outstanding Share Summary
(Millions)
(Millions)
Notes:
(1) Does not include 2.0 million warrants issued in connection with a January 2004 loan repaid to Credit Suisse First Boston. In connection
with this transaction, we issued warrants to the lender to purchase two million shares of our common stock. Each warrant has a term
of ten years from the date of issuance and an exercise price of $32.50 per share. The warrants were not assumed exercised for
dilutive shares outstanding because they were antidilutive in the periods presented.
(2) The agreement to settle our class action securities litigation received final court approval in January 2007. These shares of common
stock and warrants were issued on September 30, 2009. The 5.0 million of common shares are now included in the outstanding shares.
The warrants to purchase approx. 8.2 million shares of common stack at a strike price of $41.40 were not assumed exercised for the
dilutive shares outstanding because they are anti-dilutive in the periods presented.
(3) The difference between the basic and diluted shares outstanding is primarily related to our convertible perpetual preferred stock.
29
Exhibit 99.2
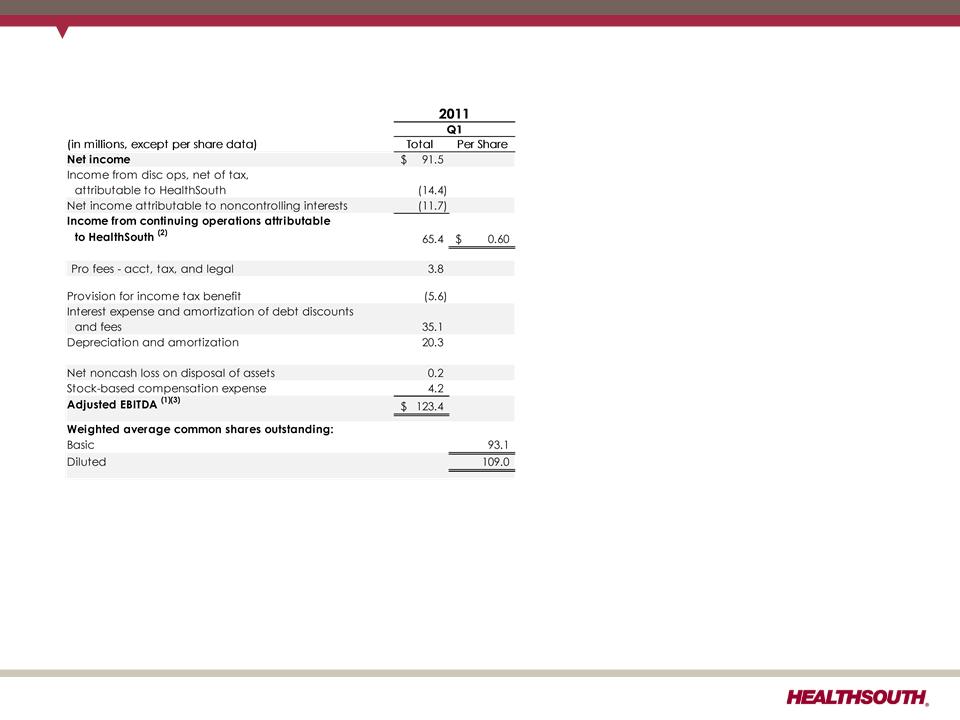
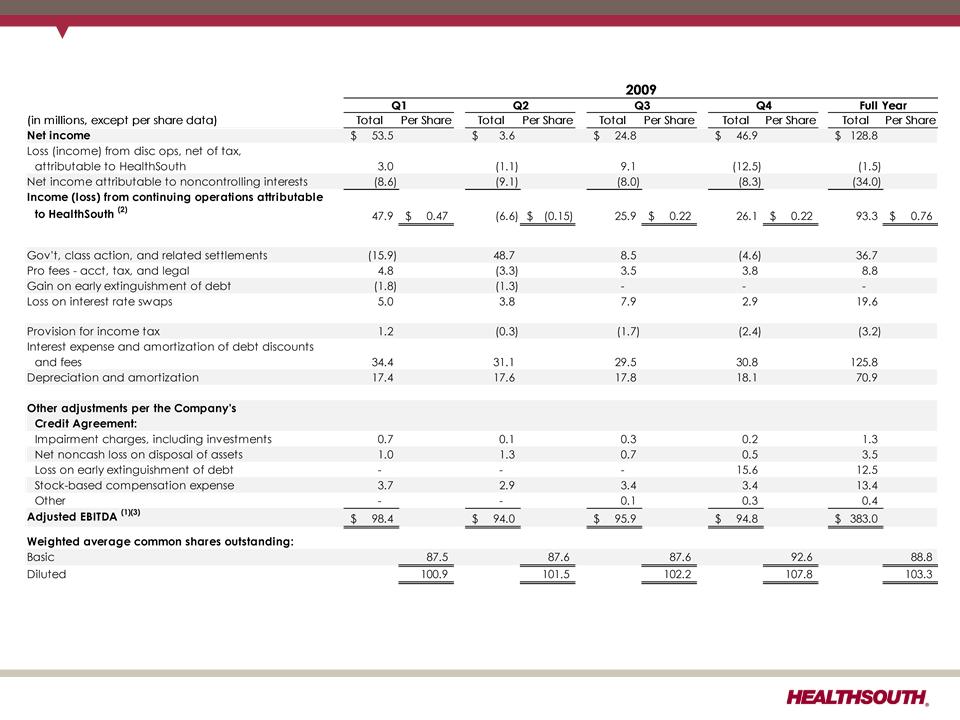
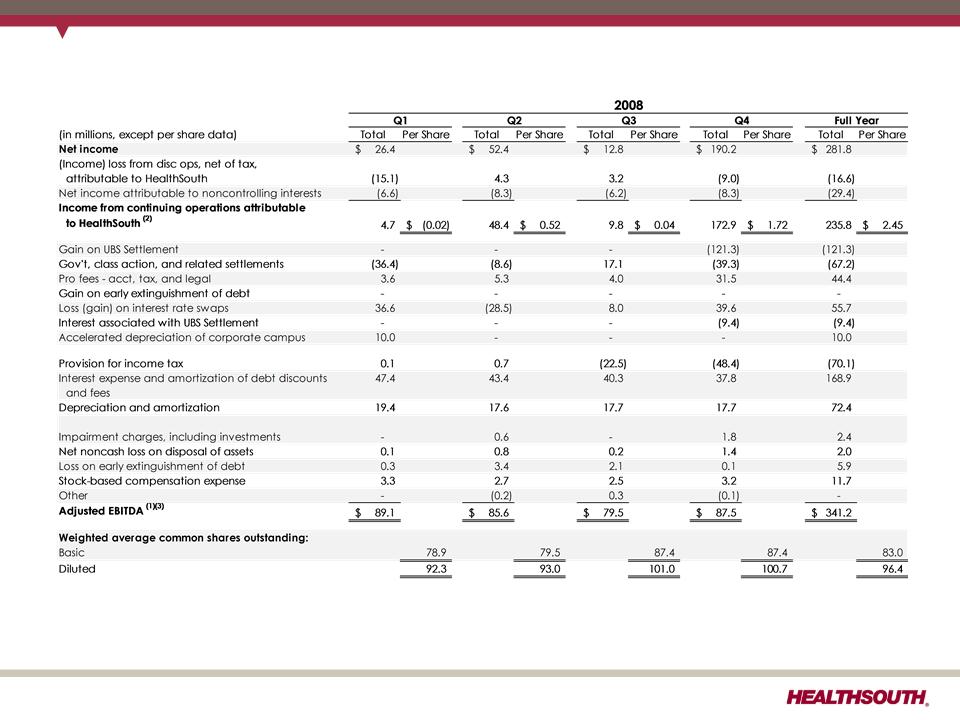
Reconciliation of Net Income to Adjusted EBITDA (1)(3)
(1) (2) (3) - Notes on page 34.
30
Exhibit 99.2
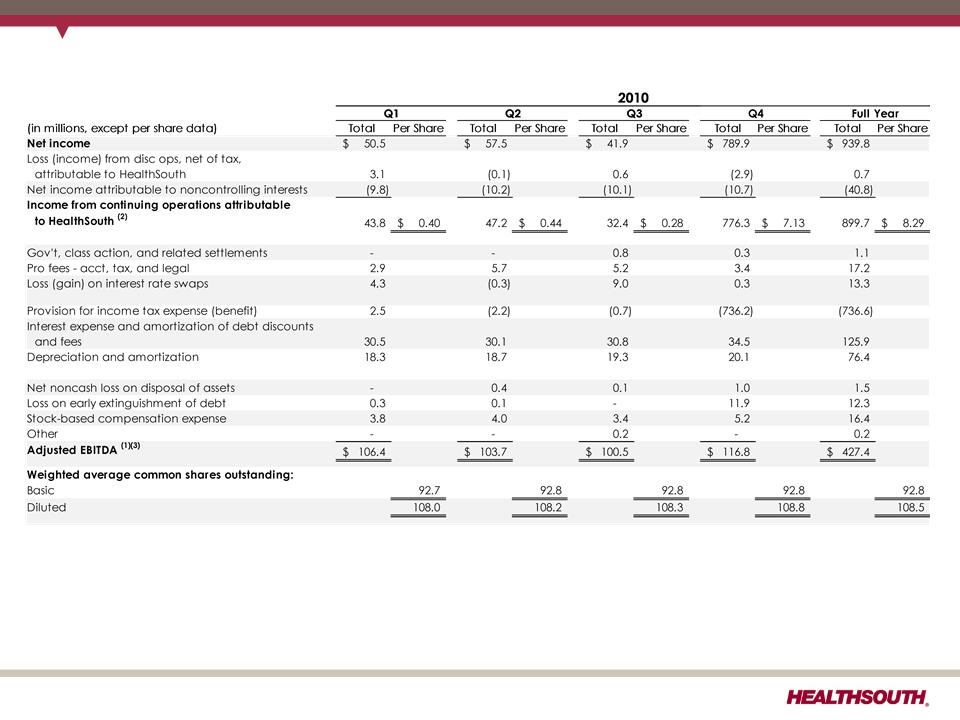
Reconciliation of Net Income to Adjusted EBITDA (1)(3)
(1) (2) (3) - Notes on page 34.
31
Exhibit 99.2
Reconciliation of Net Income to Adjusted EBITDA (1) (3)
(1) (2) (3) - Notes on page 34.
32
Exhibit 99.2
Reconciliation of Net Income to and Adjusted EBITDA (1) (3)
(1) (2) (3) - Notes on page 34.
33
Exhibit 99.2

Reconciliation Notes for Slides 30-33
1. Adjusted EBITDA is a non-GAAP financial measure. The Company’s leverage ratio (total
consolidated debt to Adjusted EBITDA for the trailing four quarters) is, likewise, a non-
GAAP financial measure. Management and some members of the investment
community utilize Adjusted EBITDA as a financial measure and the leverage ratio as a
liquidity measure on an ongoing basis. These measures are not recognized in
accordance with GAAP and should not be viewed as an alternative to GAAP
measures of performance or liquidity. In evaluating Adjusted EBITDA, the reader should
be aware that in the future HealthSouth may incur expenses similar to the adjustments
set forth above.
2. Per share amounts for each period presented are based on diluted weighted average
shares outstanding unless the amounts are antidilutive, in which case the per share
amount is calculated using the basic share count after subtracting the $6.5 million per
quarter dividend on the convertible perpetual preferred stock. The difference in shares
between the basic and diluted shares outstanding is primarily related to our
convertible perpetual preferred stock.
3. Adjusted EBITDA is a component of our guidance.
34
Exhibit 99.2
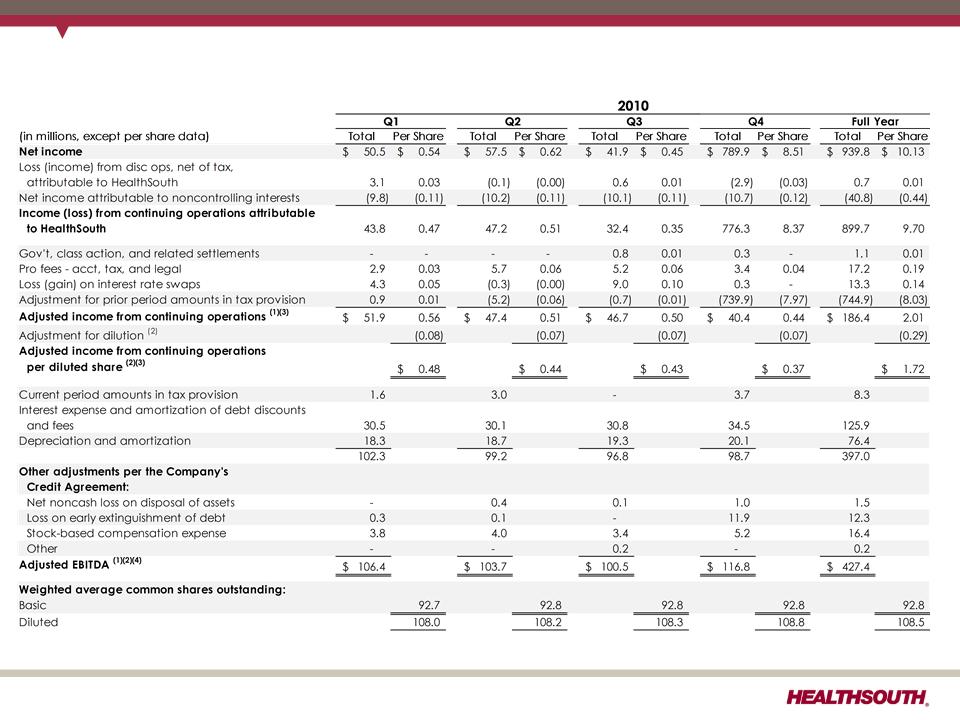
Reconciliation of Net Income to Adjusted Income from Continuing Operations and
Adjusted EBITDA (1) (3) (4)
Adjusted EBITDA (1) (3) (4)
(1) (2) (3) (4) - Notes on page 36.
35
Exhibit 99.2

Reconciliation Notes for Slide 35
1. Adjusted income from continuing operations and Adjusted EBITDA are non-GAAP
financial measure. The Company’s leverage ratio (total consolidated debt to Adjusted
EBITDA for the trailing four quarters) is, likewise, a non-GAAP financial measure.
Management and some members of the investment community utilize adjusted
income from continuing operations as a financial measure and Adjusted EBITDA and
the leverage ratio as liquidity measures on an ongoing basis. These measures are not
recognized in accordance with GAAP and should not be viewed as an alternative to
GAAP measures of performance or liquidity. In evaluating these adjusted measures,
the reader should be aware that in the future HealthSouth may incur expenses similar
to the adjustments set forth above.
2. Per share amounts for each period presented are based on basic weighted average
common shares outstanding for all amounts except adjusted income from continuing
operations per diluted share, which is based on diluted weighted average shares
outstanding. The difference in shares between the basic and diluted shares
outstanding is primarily related to our convertible perpetual preferred stock.
3. Adjusted income from continuing operations per diluted share and Adjusted EBITDA
are two components of our historical guidance.
are two components of our historical guidance.
4. The Company’s credit agreement allows certain other items to be added to arrive at
Adjusted EBITDA, and there may be certain other deductions required.
Adjusted EBITDA, and there may be certain other deductions required.
36
Exhibit 99.2
Adjusted Free Cash Flow
(1) Maintenance capital expenditures are expected to be $20 million higher in 2011 than in 2010.
(2) Final swap payment of $10.9 million was made in March 2011.
37
Exhibit 99.2
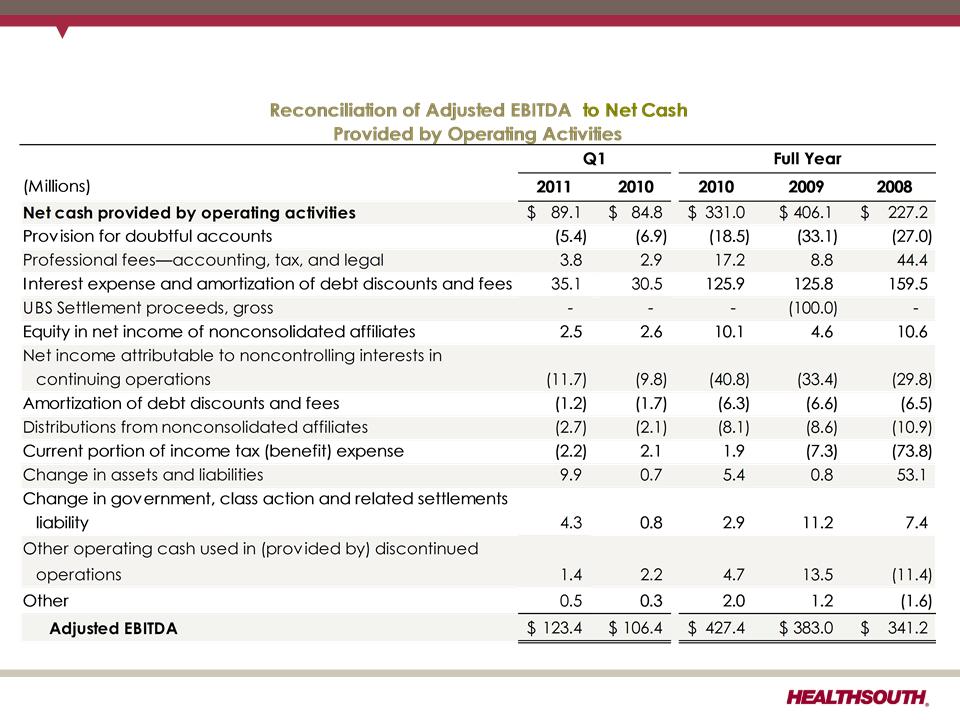
Net Cash Provided by Operating Activities
38
Exhibit 99.2