Attached files
| file | filename |
|---|---|
| EX-99.1 - FIRST FINANCIAL BANCORP /OH/ | v219674_ex99-1.htm |
| 8-K - FIRST FINANCIAL BANCORP /OH/ | v219674_8k.htm |
EXHIBIT 99.2 First Financial Bancorp First Quarter 2011 Earnings Release Supplemental Information Another step on the path to success

Forward -Looking Statements Disclosure Certain statements contained in this presentation which are not statements of historical fact constitute forward -looking statements within the meaning of the Private Securities Litigation Reform Act (the ‘‘Act’’). In addition, certain statements in future filings by First Financial with the SEC, in press releases, and in oral and written statements made by or with the approval of First Financial which are not statements of historical fact constitute forward -looking statements within the meaning of the Act. Examples of forward -looking statements include, but are not limited to, projections of revenues, income or loss, earnings or loss per share, the payment or non-payment of dividends, capital structure and other financial items, statements of plans and objectives of First Financial or its management or board of directors, and statements of future economic performances and statements of assumptions underlying such statements . Words such as ‘‘believes’’, ‘‘anticipates’’, “likely”, “expected”, ‘‘intends’’, and other similar expressions are intended to identify forward -looking statements but are not the exclusive means of identifying such statements . Management’s analysis contains forward -looking statements that are provided to assist in the understanding of anticipated future financial performance . However, such performance involves risks and uncertainties that may cause actual results to differ materially . Factors that could cause actual results to differ from those discussed in the forward -looking statements include, but are not limited to: • management’s ability to effectively execute its business plan; • the risk that the strength of the United States economy in general and the strength of the local economies in which we conduct operations may continue to deteriorate resulting in, among other things, a further deterioration in credit quality or a reduced demand for credit, including the resultant effect on our loan portfolio, allowance for loan and lease losses and overall financial performance; • the ability of financial institutions to access sources of liquidity at a reasonable cost; • the impact of recent upheaval in the financial markets and the effectiveness of domestic and international governmental actions taken in response, such as the U.S. Treasury’s TARP and the FDIC’s Temporary Liquidity Guarantee Program, and the effect of such governmental actions on us, our competitors and counterparties, financial markets generally and availability of credit specifically, and the U.S. and international economies, including potentially higher FDIC premiums arising from increased payments from FDIC insurance funds as a result of depository institution failures; • the effect of and changes in policies and laws or regulatory agencies (notably the recently enacted Dodd-Frank Wall Street Reform and Consumer Protection Act); • inflation and possible changes in interest rates; • our ability to keep up with technological changes; • our ability to comply with the terms of loss sharing agreements with the FDIC; • mergers and acquisitions, including costs or difficulties related to the integration of acquired companies and the wind-down of non-strategic operations that may be greater than expected; • the risk that exploring merger and acquisition opportunities may detract from management’s time and ability to successfully manage our company; • expected cost savings in connection with the consolidation of recent acquisitions may not be fully realized or realized within the expected time frames, and deposit attrition, customer loss and revenue loss following completed acquisitions may be greater than expected; • our ability to increase market share and control expenses; • the effect of changes in accounting policies and practices, as may be adopted by the regulatory agencies as well as the Financial Accounting Standards Board and the SEC; • adverse changes in the securities and debt markets; • our success in recruiting and retaining the necessary personnel to support business growth and expansion and maintain sufficient expertise to support increasingly complex products and services; • monetary and fiscal policies of the Board of Governors of the Federal Reserve System (Federal Reserve) and the U.S. government and other governmental initiatives affecting the financial services industry; • our ability to manage loan delinquency and charge -off rates and changes in estimation of the adequacy of the allowance for loan losses; and • the costs and effects of litigation and of unexpected or adverse outcomes in such litigation . In addition, please refer to our Annual Report on Form 10-K for the year ended December 31, 2010, as well as our other filings with the SEC, for a more detailed discussion of these risks and uncertainties and other factors. Such forward -looking statements are meaningful only on the date when such statements are made, and First Financial undertakes no obligation to update any forward -looking statement to reflect events or circumstances after the date on which such a statement is made to reflect the occurrence of unanticipated events. Another step on the path to success 2

Pre -Tax, Pre -Provision Income For the three months ended March 31, December 31, September 30, June 30, March 31, 2011 2010 2010 2010 2010 Pre-tax, pre-provision income 1 $ 29,768 $ 34,844 $ 33,631 $ 37,216 $ 31,126 Accelerated discount on acquired loans related to: Loan sales 3,085 - 362 - 1,927 Prepayments 2,698 6,113 9,086 7,408 4,171 Total accelerated discount 5,783 6,113 9,448 7,408 6,098 Plus: loss on covered OREO 2 3,112 - - - - Less: gain on sales of non-mortgage loans 3 - - 2,034 - - Plus: FHLB prepayment penalty - - 8,029 - - Pre-tax, pre-provision income, net of accelerated discount, loss on covered OREO and other significant nonrecurring items $ 27,097 $ 28,731 $ 30,178 $ 29,808 $ 25,028 1 Represents income before taxes plus provision for all loans less FDIC loss sharing income 2 Reimbursements related to losses on covered OREO are included in FDIC loss sharing income, which is excluded from the pre-tax, pre-provision income above 3 Represents gain on sale of loans originated by franchise finance business Another step on the path to success 3
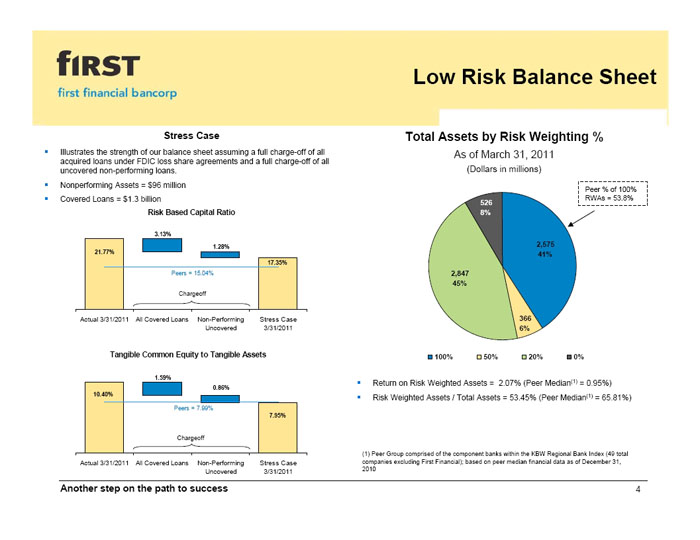
Low Risk Balance Sheet Stress Case Total Assets by Risk Weighting % Illustrates the strength of our balance sheet assuming a full charge -off of all As of March 31, 2011 acquired loans under FDIC loss share agreements and a full charge -off of all uncovered non-performing loans. (Dollars in millions) Nonperforming Assets = $96 million Peer % of 100% Covered Loans = $1.3 billion RWAs = 53.8% 526 Risk Based Capital Ratio 8% 3.13% 1.28% 2,575 21.77% 41% 17.35% Peers = 15.04% 2,847 45% Chargeoff Actual 3/31/2011 All Covered Loans Non-Performing Stress Case 366 Uncovered 3/31/2011 6% Tangible Common Equity to Tangible Assets 100% 50% 20% 0% 1.59% Return on Risk Weighted Assets = 2.07% (Peer Median (1) = 0.95%) 0.86% 10.40% Risk Weighted Assets / Total Assets = 53.45% (Peer Median (1) = 65.81%) Peers = 7.99% 7.95% Chargeoff (1) Peer Group comprised of the component banks within the KBW Regional Bank Index (49 total Actual 3/31/2011 All Covered Loans Non-Performing Stress Case companies excluding First Financial); based on peer median financial data as of December 31, Uncovered 3/31/2011 2010 Another step on the path to success 4
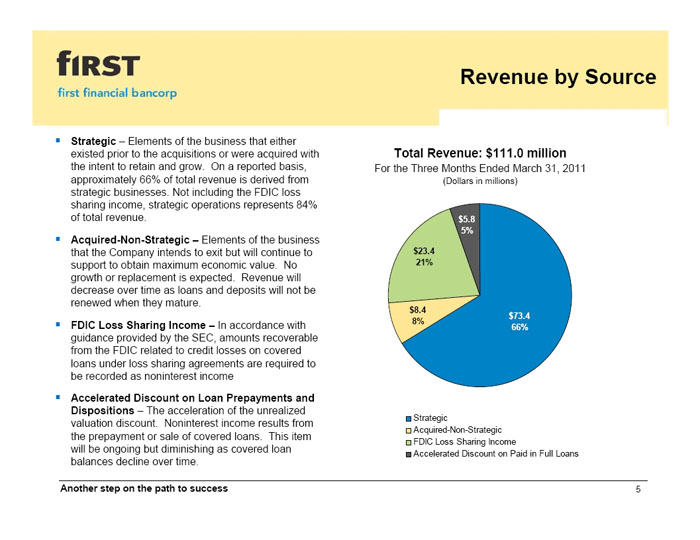
Revenue by Source Strategic – Elements of the business that either existed prior to the acquisitions or were acquired with Total Revenue: $111.0 million the intent to retain and grow. On a reported basis, For the Three Months Ended March 31, 2011 approximately 66% of total revenue is derived from (Dollars in millions) strategic businesses . Not including the FDIC loss sharing income, strategic operations represents 84% of total revenue . $5.8 5% Acquired -Non-Strategic – Elements of the business that the Company intends to exit but will continue to $23.4 support to obtain maximum economic value. No 21% growth or replacement is expected . Revenue will decrease over time as loans and deposits will not be renewed when they mature . $8.4 $73.4 FDIC Loss Sharing Income – In accordance with 8% 66% guidance provided by the SEC, amounts recoverable from the FDIC related to credit losses on covered loans under loss sharing agreements are required to be recorded as noninterest income Accelerated Discount on Loan Prepayments and Dispositions – The acceleration of the unrealized Strategic valuation discount . Noninterest income results from Acquired -Non-Strategic the prepayment or sale of covered loans. This item FDIC Loss Sharing Income will be ongoing but diminishing as covered loan Accelerated Discount on Paid in Full Loans balances decline over time. Another step on the path to success 5

Noninterest Income and Expense Components of Noninterest Income Components of Noninterest Expense For the Three Months Ended March 31, 2011 For the Three Months Ended March 31, 2011 (Dollars in millions) (Dollars in millions) -$0.4 $0.8 $7.4 - 1% 1% $5.8 13% 13% $3.9 $14.9 7% 34% $23.4 $45.7 54% 79% Strategic Strategic FDIC Loss Sharing Income Acquired -non-strategic Other Non-strategic FDIC Support Accelerated Discount on Paid in Full Loans Other Non-strategic Another step on the path to success 6

Deposit and Loan Composition Total Deposits = $5.2 billion Gross Loans = $4.1 billion As of March 31, 2011 As of March 31, 2011 (Dollars in millions) (Dollars in millions) $261 5% $698 17% $3,419 $4,956 83% 95% Strategic Acquired -Non-Strategic Western market and Michigan and Louisville, KY branch exits are complete; acquired -non-strategic deposits consist of remaining exited market deposits and brokered CDs. Another step on the path to success 7

First Quarter 2011 Loan Valuation The majority of the loans acquired as part of the FDIC-assisted transactions are accounted for under ASC Topic 310-30 which requires the Company to periodically update its forecast of expected cash flows from these loans. As a result of valuation procedures performed during the first quarter 2011, the Company experienced an improvement in cash flow expectations related to certain loan pools and impairment related to other loan pools. There were also loan pools that were impaired in prior periods but improved during the first quarter revaluation . This improvement was recorded during the quarter as a recapture of prior period impairment which partially offset current period impairment . Loan pools that recaptured prior impairment and experienced additional improvement beyond the initial impairment are included in the “loans with improvement” listed below. First Quarter 2011 Valuation Results Current Prior Period Net Current Yield Balance as of Period Impairment Period Improvement Dollars in thousands March 31, 2011 Impairment Recapture Impairment Old New Loans with improvement $691,473 - ($16,688) ($16,688) $20,718 9.98% 12.00% Loans with impairment 540,380 $32,096 (346) 31,750 - 10.93% 10.93% Total $1,231,853 $32,096 ($17,034) $15,062 $20,718 10.40% 11.53% FDIC indemnification asset $207,359 NA NA NA NA (0.76%) (3.07%) Weighted average yield 8.79% 9.43% Another step on the path to success 8

Components of Credit Losses Covered Assets For the three months ended March 31, Dollars in thousands 2011 Description Net impairment for period $15,062 Reduction in expected cash flows related to certain loan pools net of prior period impairment recapture Net charge -offs 10,954 Represents actual, unexpected net charge -offs of acquired loans during the period 1 Provision for loan and lease losses - acquired 26,016 Loss on sale - covered OREO 3,112 Total gross credit losses $29,128 FDIC loss share income $23,435 Represents receivable due from FDIC on estimated credit (Noninterest income) losses; calculated as approximatel y 80% of provision for loan and lease losses related to covered loans $5,693 Difference between these two amounts represents actual credit costs for the period 1 Expected losses are considered in the recorded investment value Another step on the path to success 9

Tables from First Quarter 2011 Earnings Release Another step on the path to success
Table I Noninterest Income Table I For the Three Months Ended March 31, December 31, March 31, (Dollars in thousands) 2011 2010 2010 Total noninterest income $ 43,658 $ 34,534 $ 26,935 Significant components of noninterest income Items likely to recur: Accelerated discount on covered loans 1, 2 5,783 6,113 6,098 FDIC loss sharing income 23,435 11,306 7,568 Other acquired -non-strategic items (552) 527 80 Transition -related items - - 366 Items expected not to recur: FDIC settlement and other items not expected to recur 125 551 -Total excluding items noted above $ 14,867 $ 16,037 $ 12,823 1 See Section II of the earnings release for additional information 2 Net of the corresponding valuation adjustment on the FDIC indemnification asset Another step on the path to success 11

Table II Noninterest Expense Table II For the Three Months Ended March 31, December 31, March 31, (Dollars in thousands) 2011 2010 2010 Total noninterest expense $ 57,790 $ 56,290 $ 60,261 Significant components of noninterest expense Items likely to recur: Acquired -non-strategic operating expenses 1 3,911 4,052 2,201 Transition -related items 1 196 684 6,263 FDIC indemnification support 783 1,160 605 Loss share and covered asset expense 3,171 616 -Items expected not to recur: Acquisition -related costs 1 116 412 2,628 Other items not expected to recur 3,962 1,787 1,019 Total excluding items noted above $ 45,651 $ 47,579 $ 47,545 1 See Section II of the earnings release for additional information Another step on the path to success 12

Table III Credit Quality – Excluding Covered Loans Table III As of or for the Three Months Ended March 31, December 31, September 30, June 30, March 31, (Dollars in thousands) 2011 2010 2010 2010 2010 Total nonaccrual loans $ 62,048 $ 62,302 $ 66,157 $ 66,671 $ 66,869 Restructured loans 18,532 17,613 13,365 12,752 7,584 Total nonperforming loans 80,580 79,915 79,522 79,423 74,453 Total nonperforming assets 95,533 97,822 97,827 96,241 92,540 Nonperforming assets as a % of: Period-end loans plus OREO 3.42% 3.45% 3.51% 3.42% 3.27% Total assets 1.51% 1.57% 1.59% 1.46% 1.41% Nonperforming loans as a % of total loans 2.90% 2.84% 2.88% 2.84% 2.65% Provision for loan and lease losses - uncovered $ 647 $ 9,741 $ 6,287 $ 6,158 $ 11,378 Allowance for uncovered loan & lease losses $ 53,645 $ 57,235 $ 57,249 $ 57,811 $ 56,642 Allowance for loan & lease losses as a % of: Period-end loans 1.93% 2.03% 2.07% 2.07% 2.01% Nonaccrual loans 86.5% 91.9% 86.5% 86.7% 84.7% Nonperforming loans 66.6% 71.6% 72.0% 72.8% 76.1% Total net charge -offs $ 4,237 $ 9,755 $ 6,849 $ 4,989 $ 14,047 Annualized net-charge -offs as a % of average loans & leases 0.61% 1.39% 0.97% 0.71% 2.00% Another step on the path to success 13

Table IV Loan Portfolio – Excluding Covered Loans Table IV As of March 31, 2011 December 31, 2010 March 31, 2010 Percent Percent Percent (Dollars in thousands) Balance of Total Balance of Total Balance of Total Commercial $ 794,821 28.6% $ 800,253 28.4% $ 763,084 27.1% Real estate - construction 145,355 5.2% 163,543 5.8% 216,289 7.7% Real estate - commercial 1,131,306 40.7% 1,139,931 40.5% 1,091,830 38.8% Real estate - residential 268,746 9.7% 269,173 9.6% 306,769 10.9% Installment 66,028 2.4% 69,711 2.5% 78,682 2.8% Home equity 339,590 12.2% 341,310 12.1% 330,973 11.8% Credit card 28,104 1.0% 29,563 1.0% 27,960 1.0% Lease financing 7,147 0.3% 2,609 0.1% 15 0.0% Total $ 2,781,097 100.0% $ 2,816,093 100.0% $ 2,815,602 100.0% Another step on the path to success 14

Table V Investment Portfolio Table V As of March 31, 2011 Book Percent of Book Cost Market Gain/ (Dollars in thousands) Value Total Yield Basis Value (Loss) U.S. Treasury notes $ 13,650 1.2% 1.99 99.64 101.32 $ 230 Agencies 105,386 9.4% 2.76 100.00 100.34 358 CMOs (agency) 453,014 40.4% 1.78 100.72 101.07 1,563 CMOs (private) 40 0.0% 0.96 100.00 100.21 -MBSs (agency) 442,475 39.5% 3.52 102.22 104.75 10,675 1,014,565 90.6% 2.64 101.29 102.57 12,826 Municipal 16,528 1.5% 7.26 99.28 100.96 279 Other 1 89,060 8.0% 3.48 102.55 103.24 599 105,588 9.4% 4.07 102.04 102.87 878 Total investment portfolio $ 1,120,153 100.0% 2.78 101.36 102.60 $ 13,704 Net Unrealized Gain/(Loss) $ 13,704 Aggregate Gains 16,759 Aggregate Losses (3,055) Net Unrealized Gain/(Loss) % of Book Value 1.22% 1 Other includes $78.7 million of regulatory stock Another step on the path to success 15

Table VI Deposit Activity Table VI Deposit Activity - First Quarter 2011 Balance as of Acquired - Balance as of December 31, Strategic Non-Strategic March 31, (Dollars in thousands) 2010 Portfolio Portfolio 2011 Transaction and savings accounts $ 3,351,406 249,434 (85,884) $ 3,514,956 Time deposits 1,662,341 (47,119) (25,214) 1,590,008 Brokered deposits 132,502 (1,433) (18,783) 112,286 Total deposits $ 5,146,249 $ 200,882 $ (129,881) $ 5,217,250 Another step on the path to success 16

Table VII Capital Ratios Table VII As of March 31, December 31, March 31, "Well-Capitalized" 2011 2010 2010 Minimum Leverage Ratio 11.08% 10.89% 9.76% 5.00% Tier 1 Capital Ratio 20.49% 18.45% 17.37% 6.00% Total Risk-Based Capital Ratio 21.77% 19.72% 18.64% 10.00% Ending tangible shareholders' equity to ending tangible assets 10.40% 10.33% 9.38% N/A Ending tangible common shareholders' equity to ending tangible assets 10.40% 10.33% 9.38% N/A Another step on the path to success 17

Table VIII Significant Acquisition Related Items Table VIII For the Three Months Ended March 31, December 31, March 31, (Dollars in thousands) 2011 2010 2010 Income effect: Accelerated discount on covered loans 1, 2 $ 5,783 $ 6,113 $ 6,098 Acquired -non-strategic net interest income 8,902 9,937 10,854 FDIC loss sharing income 23,435 11,306 7,568 Service charges on deposit accounts related to acquired -non-strategic operations 152 196 230 Other (loss) income related to acquired -non-strategic operations (704) 331 (150) Income related to the accelerated discount on covered loans and acquired -non-strategic operations 37,568 27,883 24,600 Expense effect: Provision for loan and lease losses - covered 26,016 13,997 9,460 Acquired -non-strategic operating expenses: 3 Salaries and employee benefits 1,497 820 122 Occupancy 2,153 161 1,415 Other 261 3,071 664 Total acquired -non-strategic operating expenses 3,911 4,052 2,201 FDIC indemnification support 3 783 1,160 605 Loss share and covered asset expense 3,171 616 -Acquisition -related costs: 3 Integration -related costs 46 9 999 Professional services fees 55 396 1,457 Other 15 7 172 Total acquisition -related costs 116 412 2,628 Transition -related items: 3 Salaries and benefits 166 176 4,776 Occupancy - 172 910 Other 30 336 577 Total transition -related items 196 684 6,263 Total expense effect 34,193 20,921 21,157 Total estimated effect on pre-tax earnings $ 3,375 $ 6,962 $ 3,443 1 Included in noninterest income 2 Net of the corresponding valuation adjustment on the FDIC indemnification asset 3 Included in noninterest expense Another step on the path to success 18
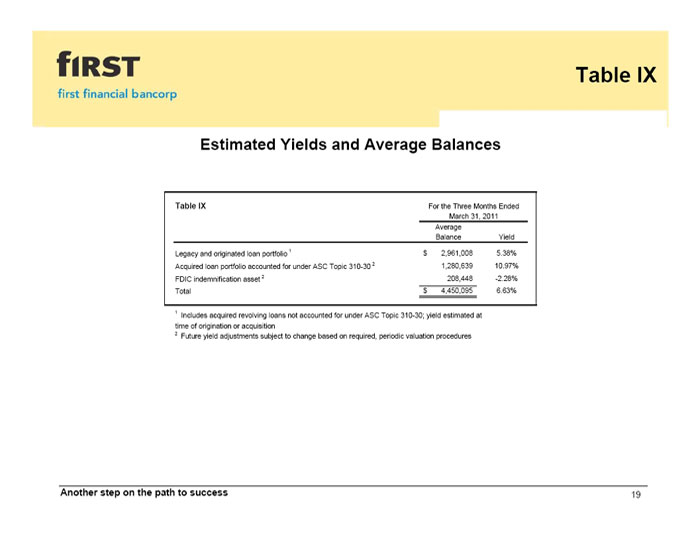
Table IX Estimated Yields and Average Balances Table IX For the Three Months Ended March 31, 2011 Average Balance Yield Legacy and originated loan portfolio 1 $ 2,961,008 5.38% Acquired loan portfolio accounted for under ASC Topic 310-30 2 1,280,639 10.97% FDIC indemnification asset 2 208,448 -2.28% Total $ 4,450,095 6.63% 1 Includes acquired revolving loans not accounted for under ASC Topic 310-30; yield estimated at time of origination or acquisition 2 Future yield adjustments subject to change based on required, periodic valuation procedures Another step on the path to success 19

Table X Covered Loan Portfolio Table X Covered Loan Activity - First Quarter 2011 Reduction in Recorded Investment Due to: December 31, Prepayments / Contractual Net Loans With March 31, (Dollars in thousands) 2010 Sales Renewals Activity 1 Charge -Offs 2 Coverage Removed 2011 Commercial $ 334,039 $ 1,813 $ 18,479 $ 17,090 $ 2,303 $ 54 $ 294,300 Real estate - construction 42,743 - 327 (2,376) 3 - 44,789 Real estate - commercial 855,725 34,987 29,415 18,379 5,533 5,223 762,188 Real estate - residential 147,052 - 5,547 691 558 - 140,256 Installment 21,071 - 1,469 587 893 114 18,008 Home equity 73,695 2,354 (752) 1,664 70,429 Other covered loans 7,168 - - 1,123 - - 6,045 Total covered loans $ 1,481,493 $ 36,800 $ 57,591 $ 34,742 $ 10,954 $ 5,391 $ 1,336,015 1 Includes partial paydowns, accretion of the valuation discount and advances on revolving loans 2 Indemnified at 80% from the FDIC Another step on the path to success 20
Another step on the path to success Another step on the path to success