Attached files
| file | filename |
|---|---|
| 8-K - ROCK-TENN COMPANY 8-K - Rock-Tenn CO | a6698575.htm |
Exhibit 99.1

RockTenn Fiscal Year 2011 2nd Quarter Earnings Conference Call Presentation April 27, 2011 Jim Rubright – Chairman and Chief Executive Officer Steve Voorhees – EVP, Chief Financial Officer and Chief Administrative Officer
Cautionary Statement Regarding Forward-Looking Information We have included financial measures that are not prepared in accordance with accounting principles generally accepted in the United States ("GAAP"). The non-GAAP financial measures presented are not intended to be a substitute for GAAP financial measures, and any analysis of non-GAAP financial measures should be used only in conjunction with results presented in accordance with GAAP. Reconciliations of non-GAAP financial measures to GAAP financial measures are attached in the Appendix to this presentation and also posted under the Investors section of our website at www.rocktenn.com. 2
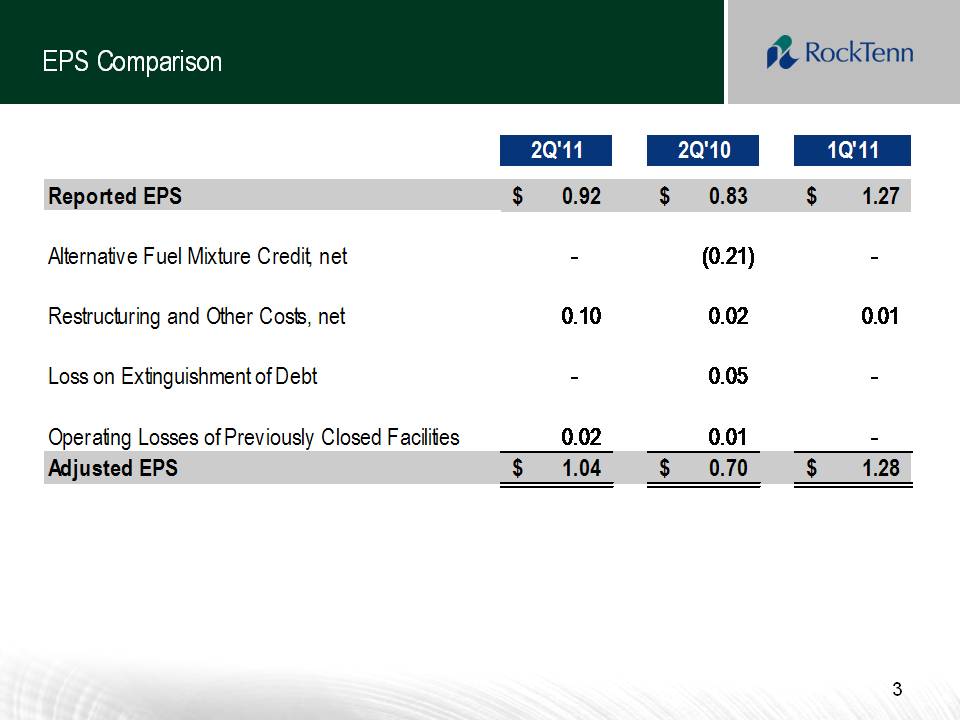
EPS Comparison 2Q'11 2Q'10 1Q'11 Reported EPS $ 0.92 $ 0.83 $ 1.27 Alternative Fuel Mixture Credit, net - (0.21) – Restructuring and Other Costs, net 0.10 0.02 0.01 Loss on Extinguishment of Debt - 0.05 - Operating Losses of Previously Closed Facilities 0.02 0.01 - Adjusted EPS $ 1.04 $ 0.70 $ 1.28 3
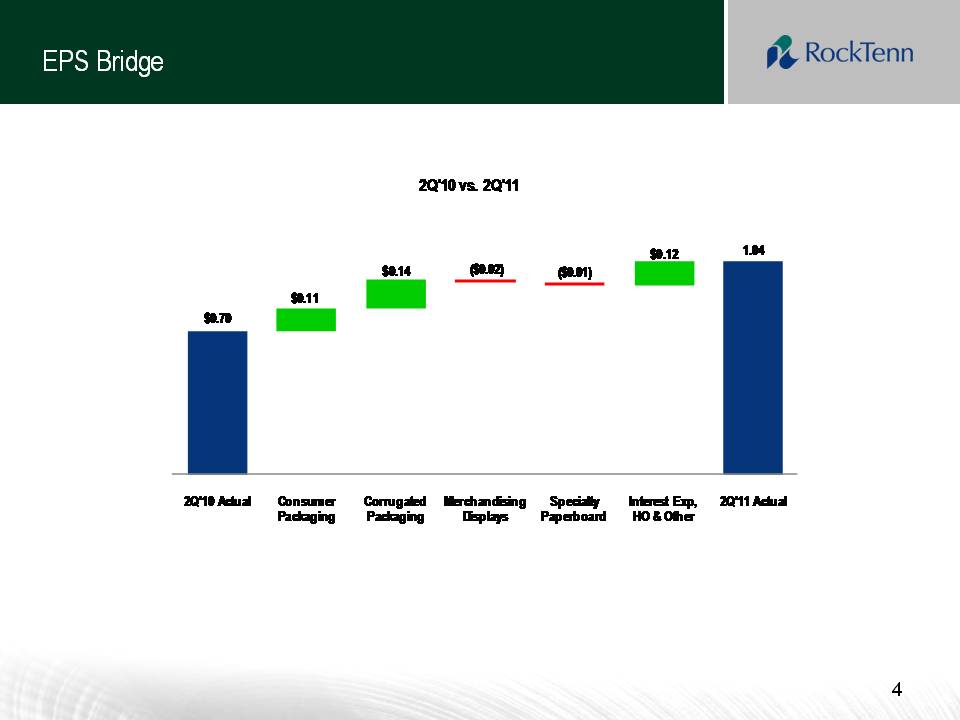
EPS Bridge 2Q'10 vs. 2Q'11 1.04 $0.12 ($0.01) ($0.02) $0.14 $0.11 $0.70 2Q'10 Actual Consumer Packaging Corrugated Packaging Merchandising Displays Specialty Paperboard Interest Exp, HO & Other 2Q'11 Actual 4
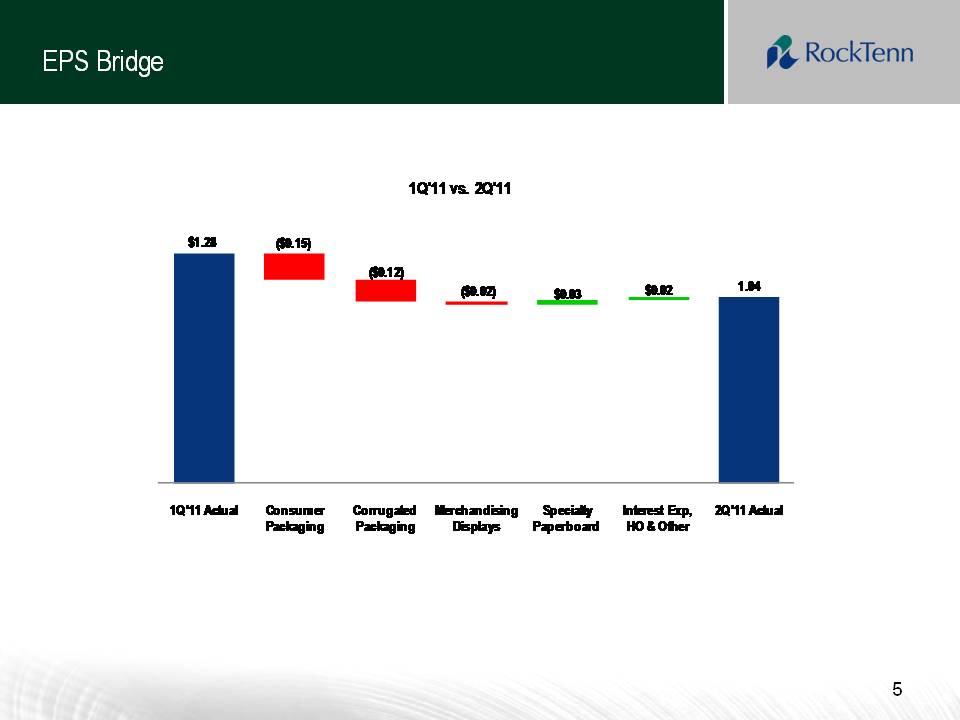
EPS Bridge 1Q'11 vs. 2Q'11 $1.28 ($0.15) ($0.12) ($0.02) $0.03 $0.02 1.04 1Q'11 Actual Consumer Packaging Corrugated Packaging Merchandising Displays Specialty Paperboard Interest Exp, HO & Other 2Q'11 Actual 5
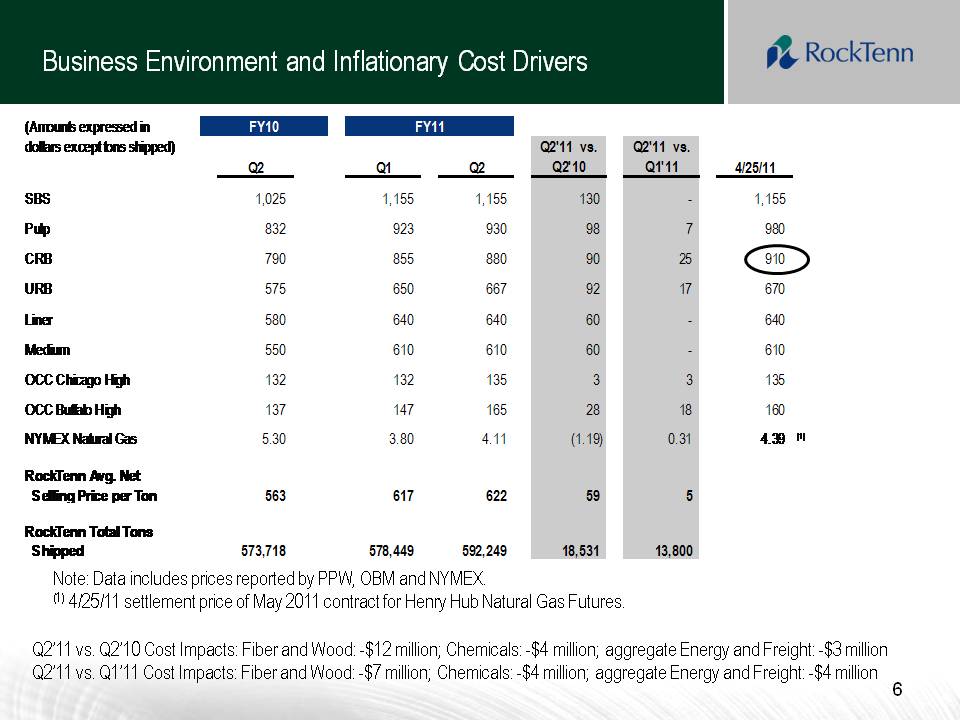
Business Environment and Inflationary Cost Drivers (Amounts expressed in dollars except tons shipped) FY10 FY11 Q2 Q1 Q2 Q2'11 vs. Q2'10 Q2'11 vs. Q1'11 4/25/11 SBS 1,025 1,155 1,155 130 - 1,155 Pulp 832 923 930 98 7 980 CRB 790 855 880 90 25 910 URB 575 650 667 92 17 670 Liner 580 640 640 60 - 640 Medium 550 610 610 60 - 610 OCC Chicago High 132 132 135 3 3 135 OCC Buffalo High 137 147 165 28 18 160 NYMEX Natural Gas 5.30 3.80 4.11 (1.19) 0.31 4.39 (1) RockTenn Avg. Net Selling Price per Ton 563 617 622 59 5 RockTenn Total Tons Shipped 573,718 578,449 592,249 18,531 13,800 Note: Data includes prices reported by PPW, OBM and NYMEX. (1) 4/25/11 settlement price of May 2011 contract for Henry Hub Natural Gas Futures. Q2’11 vs. Q2’10 Cost Impacts: Fiber and Wood: -$12 million; Chemicals: -$4 million; aggregate Energy and Freight: -$3 million Q2’11 vs. Q1’11 Cost Impacts: Fiber and Wood: -$7 million; Chemicals: -$4 million; aggregate Energy and Freight: -$4 million 6
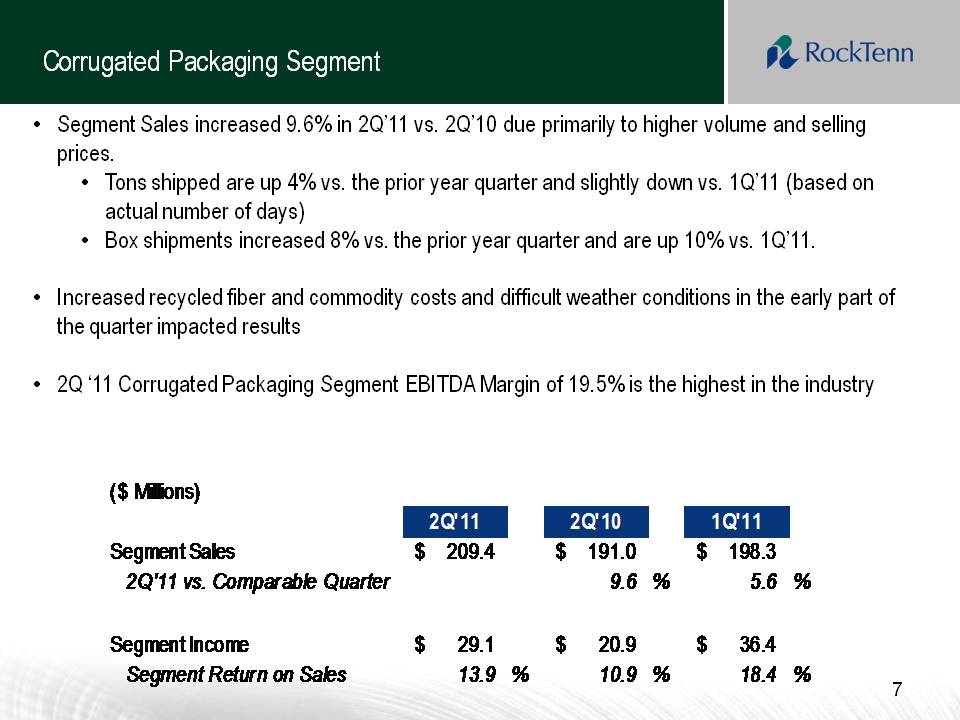
Corrugated Packaging Segment Segment Sales increased 9.6% in 2Q’11 vs. 2Q’10 due primarily to higher volume and selling prices. Tons shipped are up 4% vs. the prior year quarter and slightly down vs. 1Q’11 (based on actual number of days) Box shipments increased 8% vs. the prior year quarter and are up 10% vs. 1Q’11. Increased recycled fiber and commodity costs and difficult weather conditions in the early part of the quarter impacted results 2Q ‘11 Corrugated Packaging Segment EBITDA Margin of 19.5% is the highest in the industry ($ Millions) 2Q'11 2Q'10 1Q'11 Segment Sales $ 209.4 $ 191.0 $ 198.3 2Q'11 vs. Comparable Quarter 9.6 % 5.6 % Segment Income $ 29.1 $ 20.9 $ 36.4 Segment Return on Sales 13.9 % 10.9 % 18.4 % 7
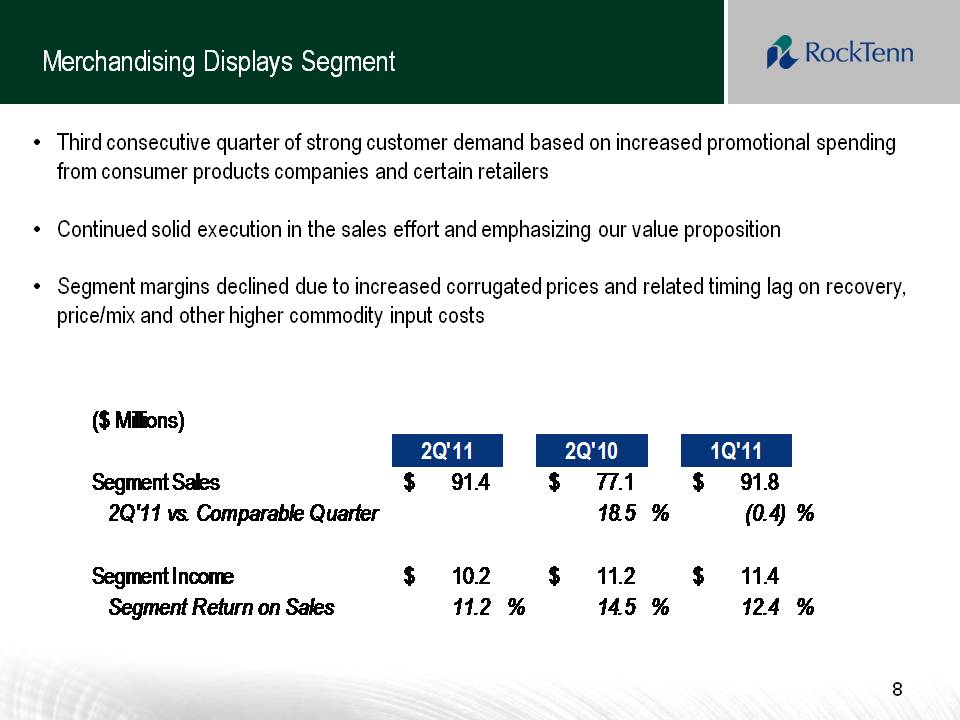
Merchandising Displays Segment Third consecutive quarter of strong customer demand based on increased promotional spending from consumer products companies and certain retailers Continued solid execution in the sales effort and emphasizing our value proposition Segment margins declined due to increased corrugated prices and related timing lag on recovery, price/mix and other higher commodity input costs ($ Millions) 2Q'11 2Q'10 1Q'11 Segment Sales $ 91.4 $ 77.1 $ 91.8 2Q 11 vs. Comparable Quarter 18.5 % (0.4) % Segment Income $ 10.2 $ 11.2 $ 11.4 Segment Return on Sales 11.2 % 14.5 % 12.4 % 8
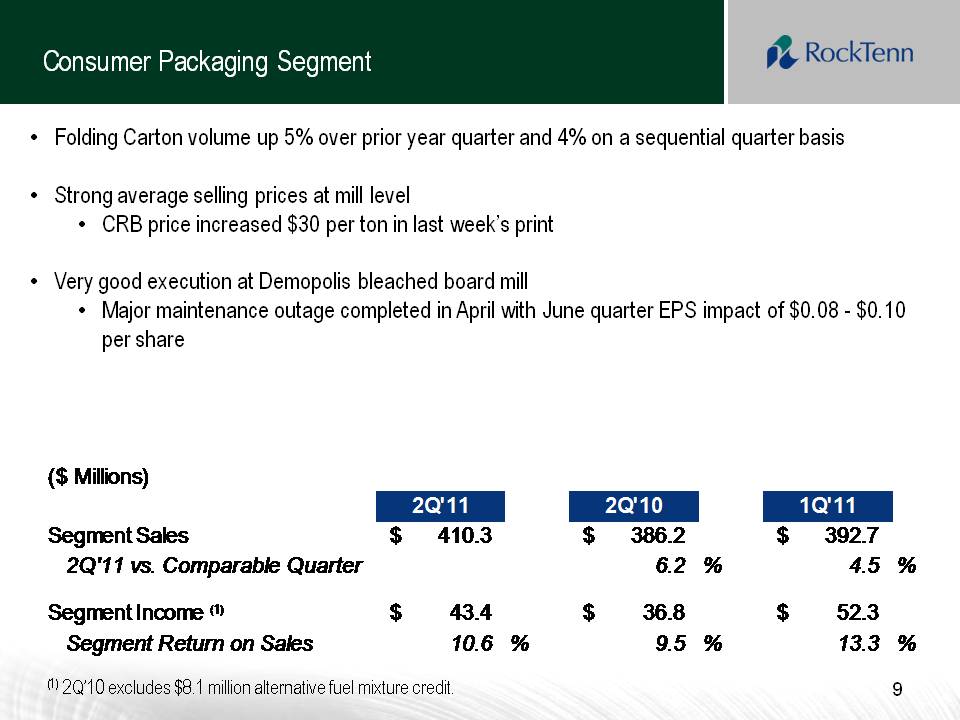
Consumer Packaging Segment Folding Carton volume up 5% over prior year quarter and 4% on a sequential quarter basis Strong average selling prices at mill level CRB price increased $30 per ton in last week’s print Very good execution at Demopolis bleached board mill Major maintenance outage completed in April with June quarter EPS impact of $0.08 - $0.10 per share ($ Millions) 2Q'11 2Q'10 1Q'11 Segment Sales $ 410.3 $ 386.2 $ 392.7 2Q'11 vs. Comparable Quarter 6.2 % 4.5 % Segment Income (1) $ 43.4 $ 36.8 $ 52.3 Segment Return on Sales 10.6 % 9.5 % 13.3 % (1) 2Q’10 excludes $8.1 million alternative fuel mixture credit. 9
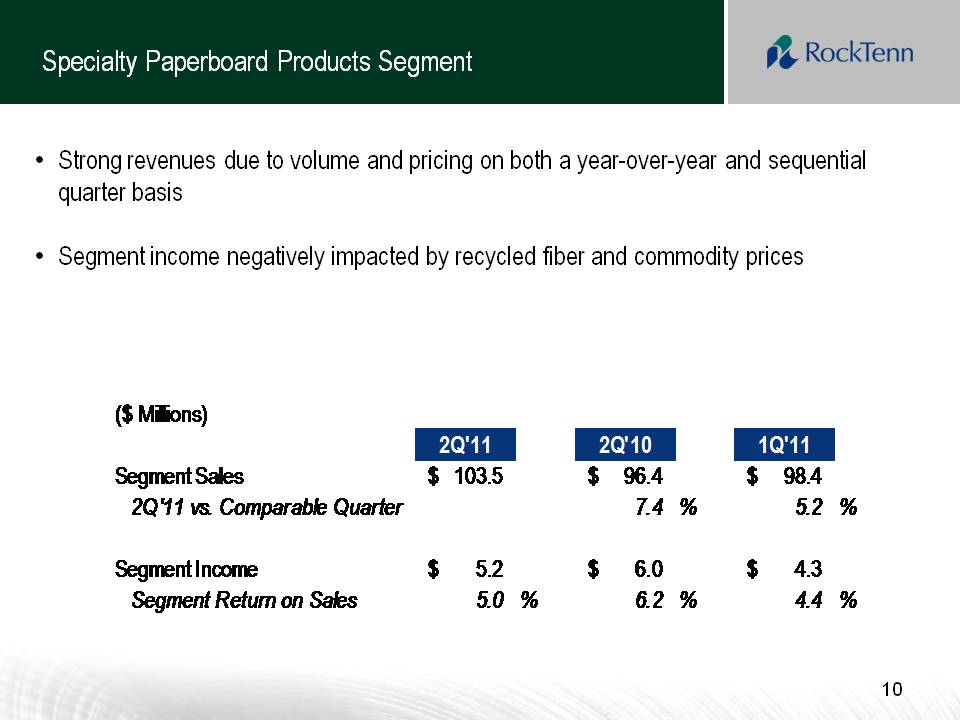
Specialty Paperboard Products Segment Strong revenues due to volume and pricing on both a year-over-year and sequential quarter basis Segment income negatively impacted by recycled fiber and commodity prices ($ Millions) 2Q'11 2Q'10 1Q'11 Segment Sales $ 103.5 $ 96.4 $ 98.4 2Q'11 vs. Comparable Quarter 7.4 % 5.2 % Segment Income $ 5.2 $ 6.0 $ 4.3 Segment Return on Sales 5.0 % 6.2 % 4.4 % 10
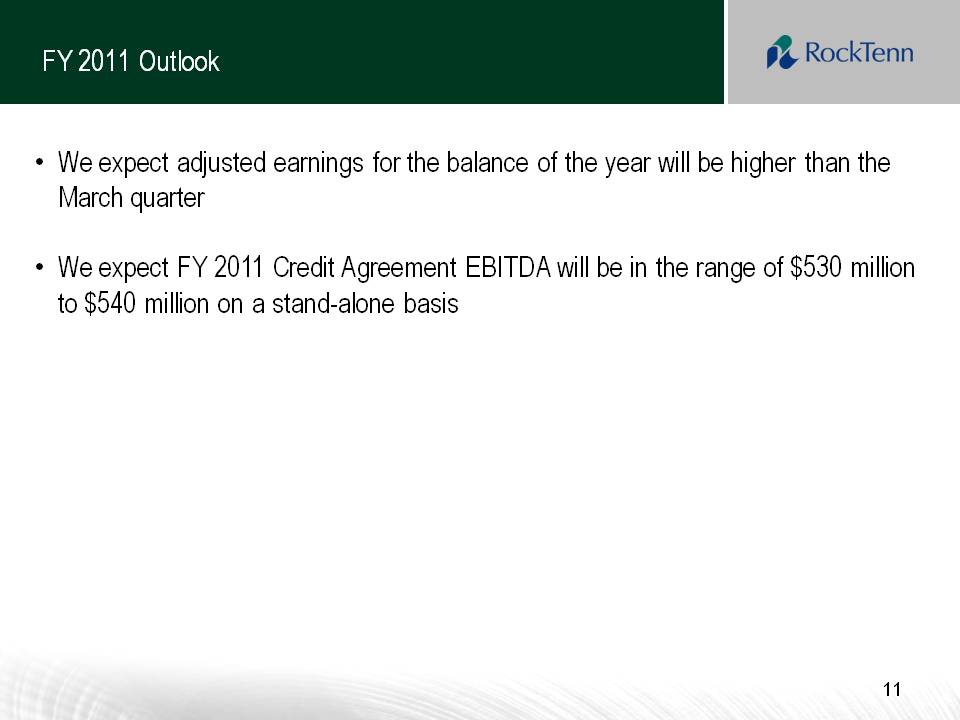
FY 2011 Outlook We expect adjusted earnings for the balance of the year will be higher than the March quarter We expect FY 2011 Credit Agreement EBITDA will be in the range of $530 million to $540 million on a stand-alone basis 11
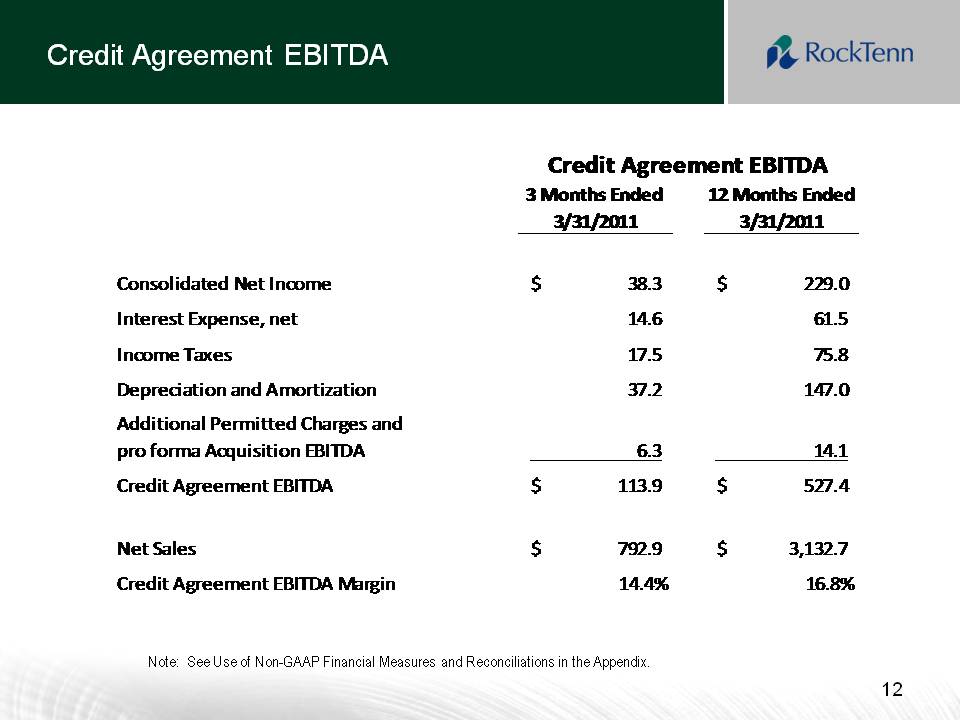
Credit Agreement EBITDA Credit Agreement EBITDA 3 Months Ended 12 Months Ended 3/31/2011 3/31/2011 Consolidated Net Income $ 38.3 $ 229.0 Interest Expense, net 14.6 61.5 Income Taxes 17.5 75.8 Depreciation and Amortization 37.2 147.0 Additional Permitted Charges and pro forma Acquisition EBITDA 6.3 14.1 Credit Agreement EBITDA $ 113.9 $ 527.4 Net Sales $ 792.9 $ 3,132.7 Credit Agreement EBITDA Margin 14.4% 16.8% Note: See Use of Non-GAAP Financial Measures and Reconciliations in the Appendix. 12
Balance Sheet Activity and Investments 2Q ‘11 net debt pay down of $45.9 million Net Working Capital Investment was flat in 2Q ’11, an excellent performance in light of the $31.8 million increase in sales from the December quarter Net Debt now less than $1 billion for the first time since the Southern Container Acquisition For the 3 years since the Southern Container acquisition in March of 2008: $288 million in capital expenditures $29 million in acquisitions $62 million in dividends Net debt reduction of $771 million 13
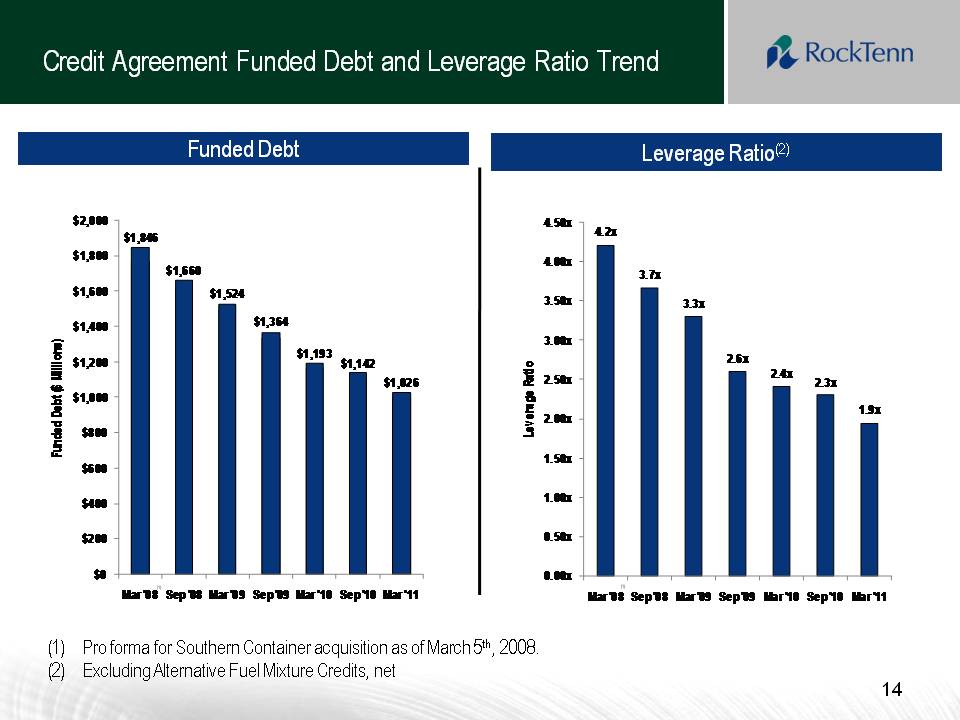
Credit Agreement Funded Debt and Leverage Ratio Trend Funded Debt Leverage Ratio(2) 4.2x 3.7x 3.3x 2.6x 2.4x 2.3x 1.9x 4.50x 4.00x 3.50x 3.00x 2.50x 2.00x 1.50x 1.00x 0.50x 0.00x Leverage Ratio Mar '08 Sep '08 Mar '09 Sep '09 Mar '10 Sep '10 Mar '11 $1,846 $1,660 $1,524 $1,364 $1,193 $1,142 $1,026 $2,000 $1,800 $1,600 $1,400 $1,200 $1,000 $800 $600 $400 $200 $0 Funded Debt ($ Millions) Mar '08 Sep '08 Mar '09 Sep '09 Mar '10 Sep '10 Mar '11 (1) Pro forma for Southern Container acquisition as of March 5th, 2008. (2) Excluding Alternative Fuel Mixture Credits, net 14
Reconciliation of Non-GAAP Financial Measures and Other Items 15
Safe Harbor Provision and Disclaimer Statements in this presentation that are not historical facts are forward-looking statements. Forward-looking statements are based on our current expectations and beliefs and involve risks, uncertainties and assumptions. Management believes its assumptions are reasonable; however, undue reliance should not be placed on such estimates, which are based on current expectations. There are many factors that impact these forward-looking statements that we cannot predict accurately. Further, RockTenn’s businesses are subject to a number of general risks that would affect any such forward-looking statements including, among others, decreases in demand for products; increases in energy, raw materials, shipping and capital equipment costs; reduced supply of raw materials; fluctuations in selling prices and volumes; intense competition; the potential loss of certain customers; and adverse changes in general market and industry conditions. Such risks and other factors that may impact management's assumptions are more particularly described in our filings with the Securities and Exchange Commission, including under the caption "Business -- Forward-Looking Information" and "Risk Factors" in our Annual Report on Form 10-K for the year ended September 30, 2010. The information contained herein speaks as of the date hereof and we do not have or undertake any obligation to update such information as future events unfold. We may from time to time be in possession of certain information regarding RockTenn that applicable law would not require us to disclose to the public in the ordinary course of business, but would require us to disclose if we were engaged in the purchase or sale of our securities. This presentation shall not be considered to be part of any solicitation of an offer to buy or sell RockTenn securities. This presentation also may not include all of the information regarding RockTenn that you may need to make an investment decision regarding RockTenn securities. Any such investment decision should be made on the basis of the overall mix of information regarding RockTenn that is publicly available as of the date of such decision. We have included financial measures that are not prepared in accordance with accounting principles generally accepted in the United States ("GAAP"). The non-GAAP financial measures presented are not intended to be a substitute for GAAP financial measures, and any analysis of non-GAAP financial measures should be used only in conjunction with results presented in accordance with GAAP Reconciliations of non-GAAP financial measures to GAAP financial measures are posted under the Investors section of our website at www.rocktenn.com. 16
Use of Non-GAAP Financial Measures and Reconciliations Below, we define the non-GAAP financial measures, provide a reconciliation of each non-GAAP financial measure to the most directly comparable financial measure calculated in accordance with GAAP, and discuss the reasons that we believe this information is useful to management and may be useful to investors. These measures may differ from similarly captioned measures of other companies in our industry. Non-GAAP Measures Our definitions of Credit Agreement EBITDA and Segment EBITDA may differ from other similarly titled measures at other companies. Credit Agreement EBITDA (as defined) and Adjusted EBITDA (as defined) are not defined in accordance with GAAP and should not be viewed as alternatives to GAAP measures of operating results or liquidity. RockTenn management believes that net income is the most directly comparable GAAP measure to Credit Agreement EBITDA (as defined) and Segment Income is the most directly comparable GAAP measure to Segment EBITDA. 17
Non-GAAP Measures: Credit Agreement EBITDA and Total Funded Debt (as defined) “Credit Agreement EBITDA” is calculated in accordance with the definition of “EBITDA” contained in the Company’s Senior Secured Credit Facility. Credit Agreement EBITDA is generally defined as Consolidated Net Income plus: consolidated interest expense (interest expense, interest and other income (expense)), taxes of the consolidated companies, depreciation and amortization expense of the consolidated companies determined in accordance with GAAP, non-cash charges related to the expensing of stock options, certain cash and non-cash restructuring charges. For additional information on the calculation see our Amended and Restated Credit Agreement dated Agreement, as of March 5, 2008, filed as Exhibit 4.1 to our Quarterly Report on Form 10-Q for the quarter ended December 31, 2009. “Total Funded Debt” is calculated in accordance with the definition contained in the Company’s Senior Secured Credit Facility. Total Funded Debt is generally defined as aggregate debt obligations reflected in our balance sheet, less the hedge adjustments resulting from terminated and existing fair value interest rate derivatives or swaps, plus additional outstanding letters of credit not already reflected in debt, plus debt guarantees. In fiscal 2008, Total Funded Debt is reduced by deferred cash associated with certain debt outstanding at that time. 18
Non-GAAP Measures: Credit Agreement EBITDA and Total Funded Debt Our management uses Credit Agreement EBITDA and Total Funded Debt to evaluate compliance with RockTenn’s debt covenants and borrowing capacity available under its Senior Secured Credit Facility. Management also uses Credit Agreement EBITDA as a measure of our Company’s core operating performance. Management believes that investors also use these measures to evaluate the Company’s compliance with its debt covenants and available borrowing capacity. Management also believes that investors use Credit Agreement EBITDA as a measure of our Company’s core operating performance. Borrowing capacity is dependent upon, in addition to other measures, the “Total Funded Debt/EBITDA ratio” or the “Leverage Ratio,” which is defined as Total Funded Debt divided by Credit Agreement EBITDA. 19
Non-GAAP Measures: Net Debt We have defined the non-GAAP measure Net Debt to include the aggregate debt obligations reflected in our balance sheet, less the hedge adjustments resulting from terminated and existing fair value interest rate derivatives or swaps, the balance of our cash and cash equivalents, restricted cash (which includes the balance sheet line items restricted cash and restricted cash and marketable debt securities) and certain other investments that we consider to be readily available to satisfy such debt obligations. Our management uses Net Debt, along with other factors, to evaluate our financial condition. We believe that Net Debt is an appropriate supplemental measure of financial condition and may be useful to investors because it provides a more complete understanding of our financial condition before the impact of our decisions regarding the appropriate use of cash and liquid investments. 20
Non-GAAP Measures: Adjusted Net Income and Adjusted Earnings Per Diluted Share We also use the non-GAAP measures “adjusted net income” and “adjusted earnings per diluted share”. Management believes these non-GAAP financial measures provide our board of directors, investors, potential investors, securities analysts and others with useful information to evaluate the performance of the Company because it excludes restructuring and other costs, net, the alternative fuel mixture credit and cellulosic biofuel producer credit and other specific items that management believes are not indicative of the ongoing operating results of the business. The Company and the board of directors use this information to evaluate the Company’s performance relative to other periods. 21
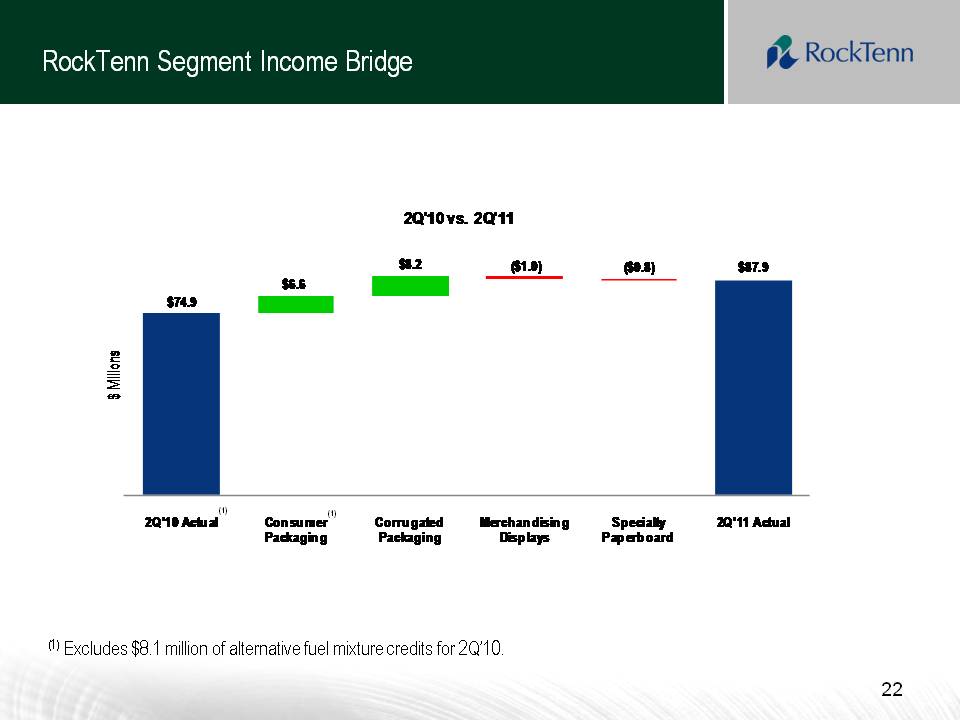
RockTenn Segment Income Bridge 2Q'10 vs. 2Q'11 $ Millions $74.9 $6.6 $8.2 ($1.0) ($0.8) $87.9 (1) (1) 2Q'10 Actual Consumer Packaging Corrugated Packaging Merchandising Displays Specialty Paperboard 2Q'11 Actual ) (1) Excludes $8.1 million of alternative fuel mixture credits for 2Q’10. 22
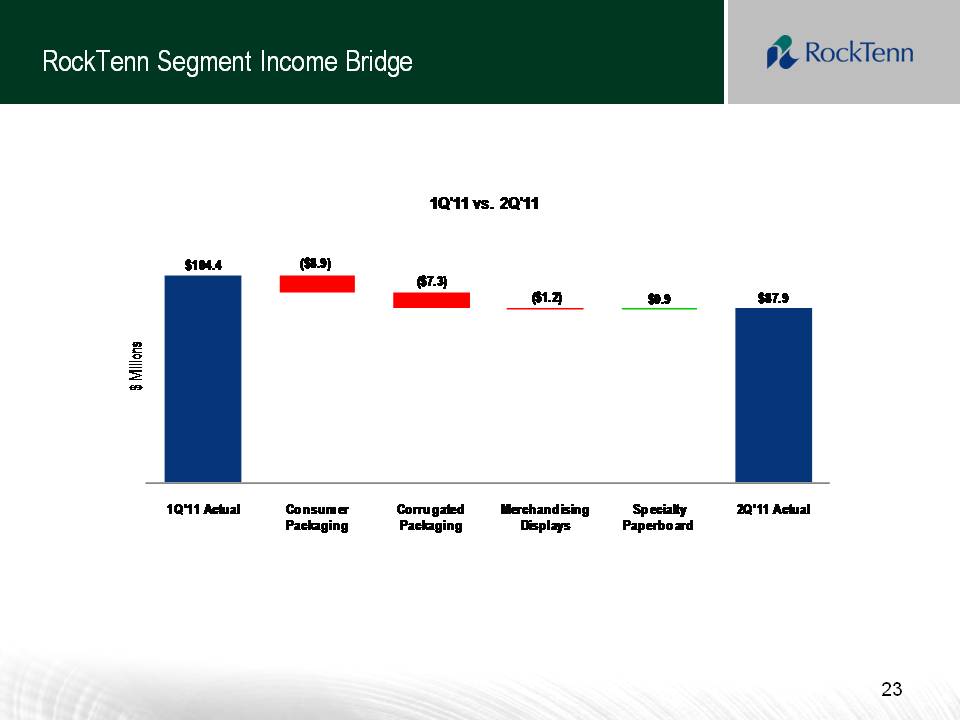
RockTenn Segment Income Bridge 1Q'11 vs 2Q'11 $104.4 ($8.9) ($7.3) ($1.2) $0.9 $87.9 $ Millions 1Q'11 Actual Consumer Packaging Corrugated Packaging Merchandising Displays Specialty Paperboard 2Q'11 Actual 23
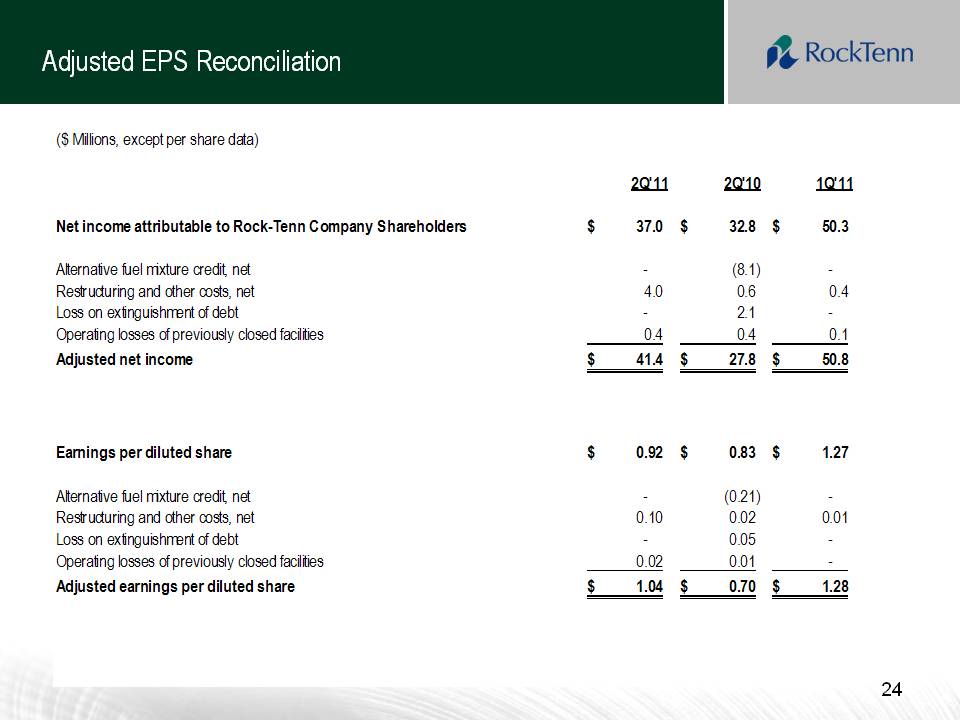
Adjusted EPS Reconciliation ($ Millions, except per share data) 2Q'11 2Q'10 1Q'11 Net income attributable to Rock-Tenn Company Shareholders $ 37.0 $ 32.8 $ 50.3 Alternative fuel mixture credit, net - (8.1) - Restructuring and other costs, net 4.0 0.6 0.4 Loss on extinguishment of debt - 2.1 - Operating losses of previously closed facilities 0.4 0.4 0.1 Adjusted net income $ 41.4 $ 27.8 $ 50.8 Earnings per diluted share $ 0.92 $ 0.83 $ 1.27 Alternative fuel mixture credit, net - (0.21) - Restructuring and other costs, net 0.10 0.02 0.01 Loss on extinguishment of debt - 0.05 - Operating losses of previously closed facilities 0.02 0.01 - Adjusted earnings per diluted share $ 1.04 $ 0.70 $ 1.28 24
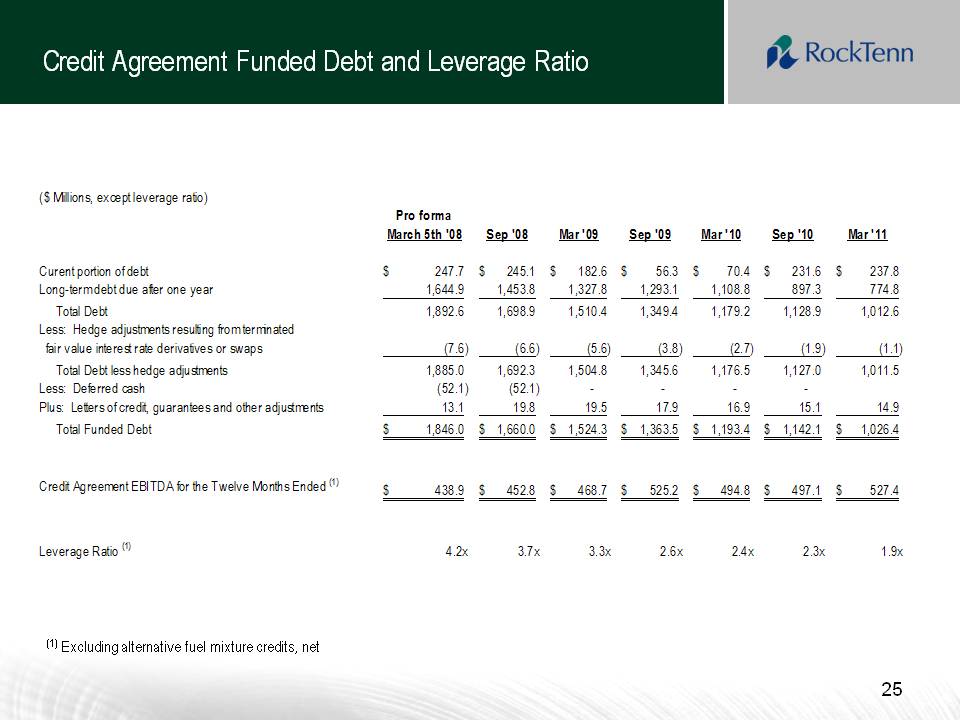
Credit Agreement Funded Debt and Leverage Ratio ($ Millions, except leverage ratio) Pro forma March 5th '08 Sep '08 Mar '09 Sep '09 Mar '10 Sep '10 Mar '11 Current portion of debt $ 247.7 $ 245.1 $ 182.6 $ 56.3 $ 70.4 $ 231.6 $ 237.8 Long-term debt due after one year 1,644.9 1,453.8 1,327.8 1,293.1 1,108.8 897.3 774.8 Total Debt 1,892.6 1,698.9 1,510.4 1,349.4 1,179.2 1,128.9 1,012.6 Less: Hedge adjustments resulting from terminated fair value interest rate derivatives or swaps (7.6) (6.6) (5.6) (3.8) (2.7) (1.9) (1.1) Total Debt less hedge adjustments 1,885.0 1,692.3 1,504.8 1,345.6 1,176.5 1,127.0 1,011.5 Less: Deferred cash (52.1) (52.1) - - - - Plus: Letters of credit, guarantees and other adjustments 13.1 19.8 19.5 17.9 16.9 15.1 14. Total Funded Debt $ 1,846.0 $ 1,660.0 $ 1,524.3 $ 1,363.5 $ 1,193.4 $ 1,142.1 $ 1,026.4 Credit Agreement EBITDA for the Twelve Months Ended (1) $ 438.9 $ 452.8 $ 468.7 $ 525.2 $ 494.8 $ 497.1 $ 527.4 Leverage Ratio (1) 4.2x 3.7x 3.3x 2.6x 2.4x 2.3x 1.9x (1) Excluding alternative fuel mixture credits, net 25
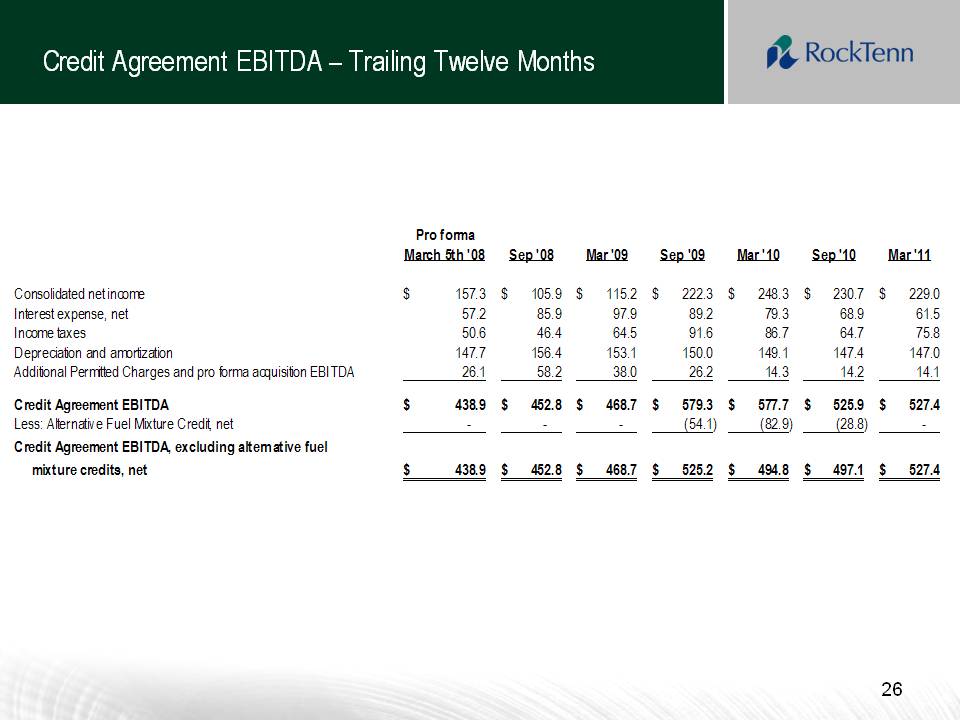
Credit Agreement EBITDA – Trailing Twelve Months Pro forma March 5th '08 Sep '08 Mar '09 Sep '09 Mar '10 Sep '10 Mar '11 Consolidated net income $ 157.3 $ 105.9 $ 115.2 $ 222.3 $ 248.3 $ 230.7 $ 229.0 Interest expense, net 57.2 85.9 97.9 89.2 79.3 68.9 61.5 Income taxes 50.6 46.4 64.5 91.6 86.7 64.7 75.8 Depreciation and amortization 147.7 156.4 153.1 150.0 149.1 147.4 147.0 Additional Permitted Charges and pro forma acquisition EBITDA 26.1 58.2 38.0 26.2 14.3 14.2 14.1 Credit Agreement EBITDA $ 438.9 $ 452.8 $ 468.7 $ 579.3 $ 577.7 $ 525.9 $ 527.4 Less: Alternative Fuel Mixture Credit, net - - - (54.1) (82.9) (28.8) - Credit Agreement EBITDA, excluding alternative fuel mixture credits, net $ 438.9 $ 452.8 $ 468.7 $ 525.2 $ 494.8 $ 497.1 $ 527.4 26
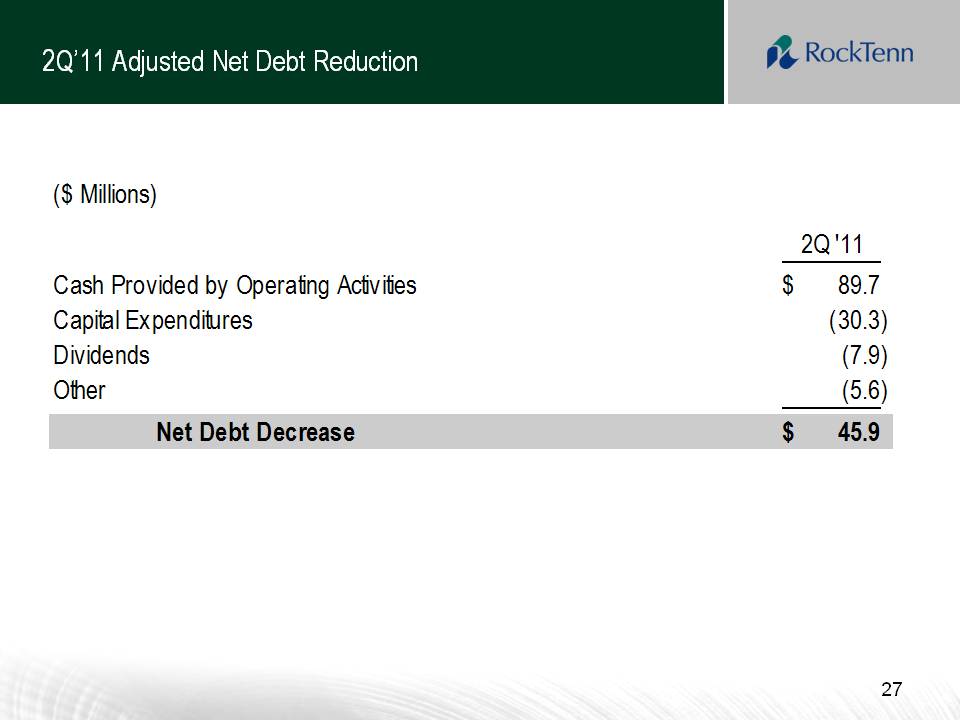
2Q’11 Adjusted Net Debt Reduction ($ Millions) 2Q '11 Cash Provided by Operating Activities $ 89.7 Capital Expenditures (30.3) Dividends (7.9) Other (5.6) Net Debt Decrease $ 45.9 27
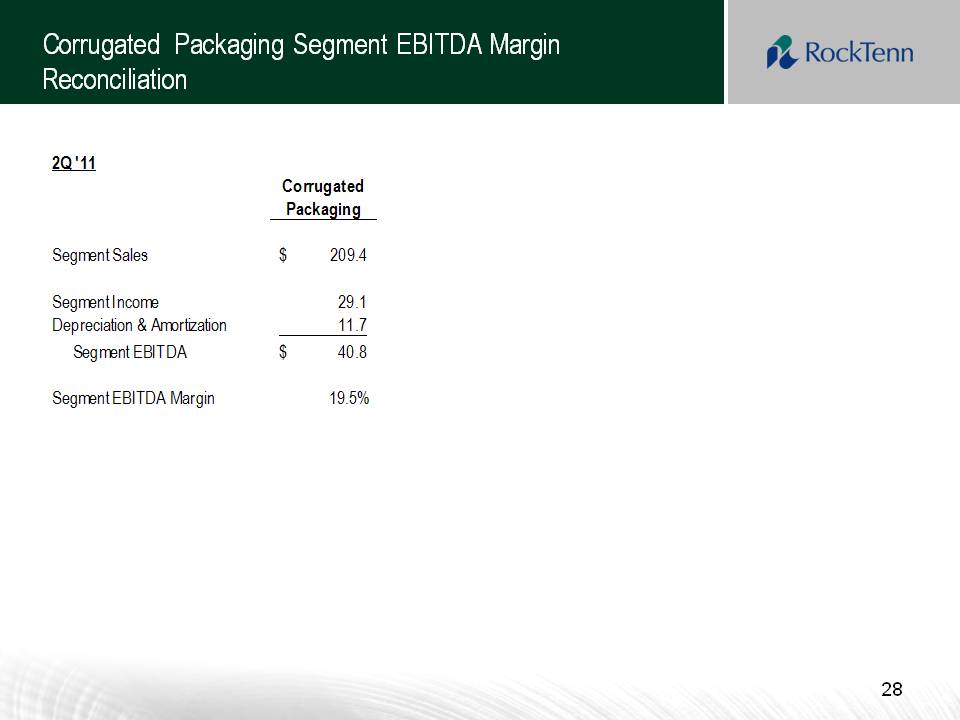
Corrugated Packaging Segment EBITDA Margin Reconciliation 2Q '11 Corrugated Packaging Segment Sales $ 209.4 Segment Income 29.1 Depreciation & Amortization 11.7 Segment EBITDA $ 40.8 Segment EBITDA Margin 19.5% 28
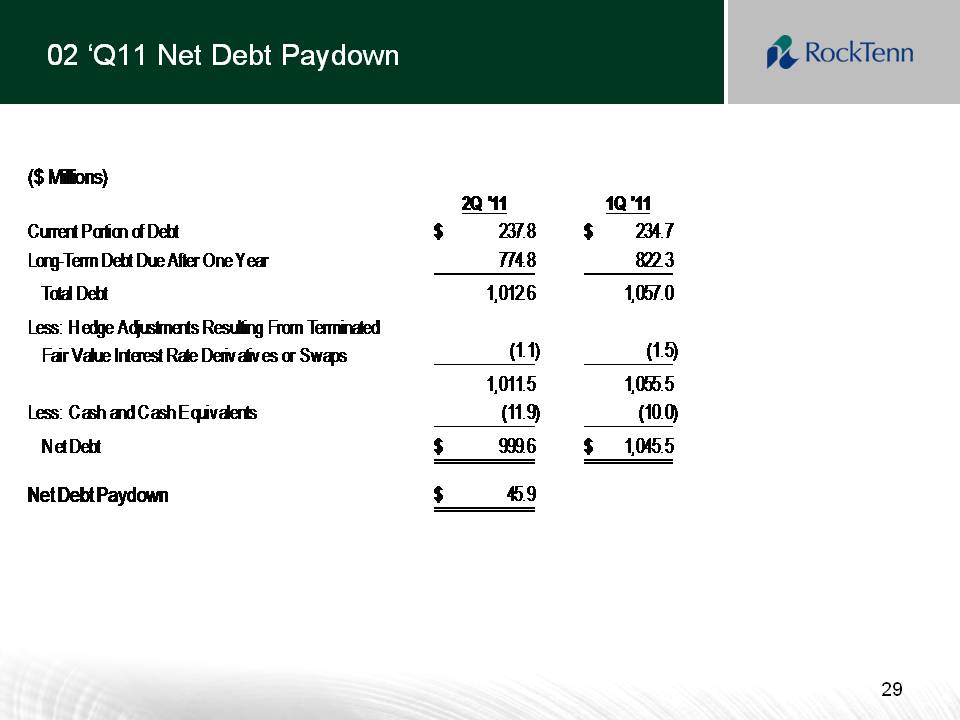
02 ‘Q11 Net Debt Paydown ($ Millions) 2Q '11 1Q '11 Current Portion of Debt $ 237.8 $ 234.7 Long-Term Debt Due After One Year 774.8 822.3 Total Debt 1,012.6 1,057.0 Less: Hedge Adjustments Resulting From Terminated Fair Value Interest Rate Derivatives or Swaps (1.1) (1.5) 1,011.5 1,055.5 Less: Cash and Cash Equivalents (11.9) (10.0) Net Debt $ 999.6 $ 1,045.5 Net Debt Paydown $ 45.9 29

RockTenn