Attached files
| file | filename |
|---|---|
| EX-99.1 - PRESS RELEASE - JONES LANG LASALLE INC | dex991.htm |
| 8-K - FORM 8-K - JONES LANG LASALLE INC | d8k.htm |
 Supplemental Information
First Quarter
Earnings Call 2011
Exhibit 99.2 |
 Market & Financial Overview |
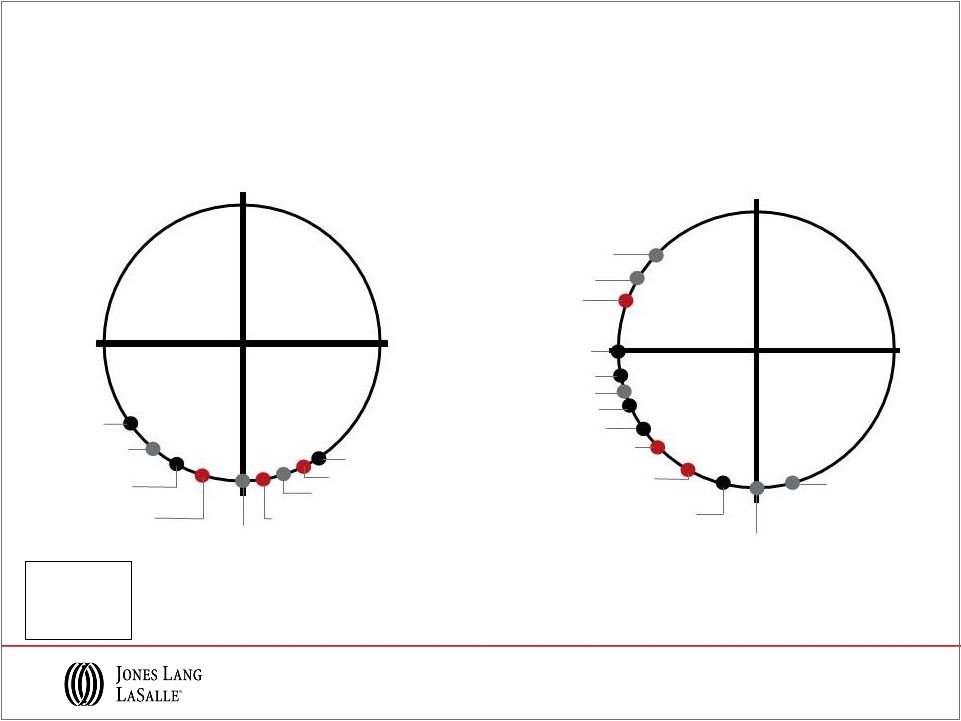 Capital
Value growth slowing
Capital Value
growth
accelerating
Capital Value
bottoming out
Capital Value
falling
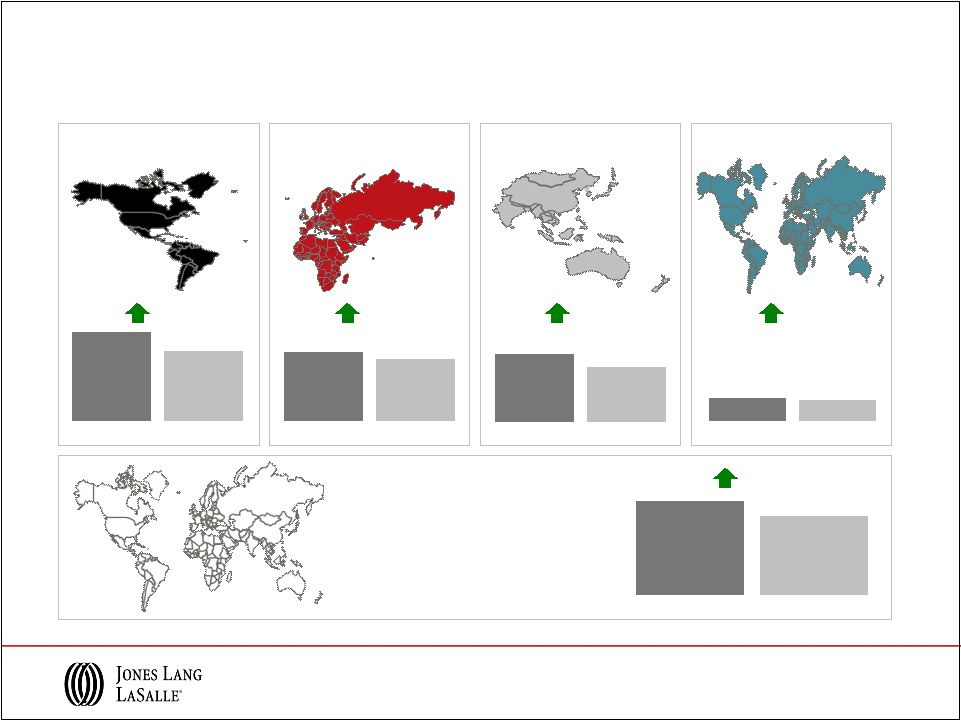
Capital Values
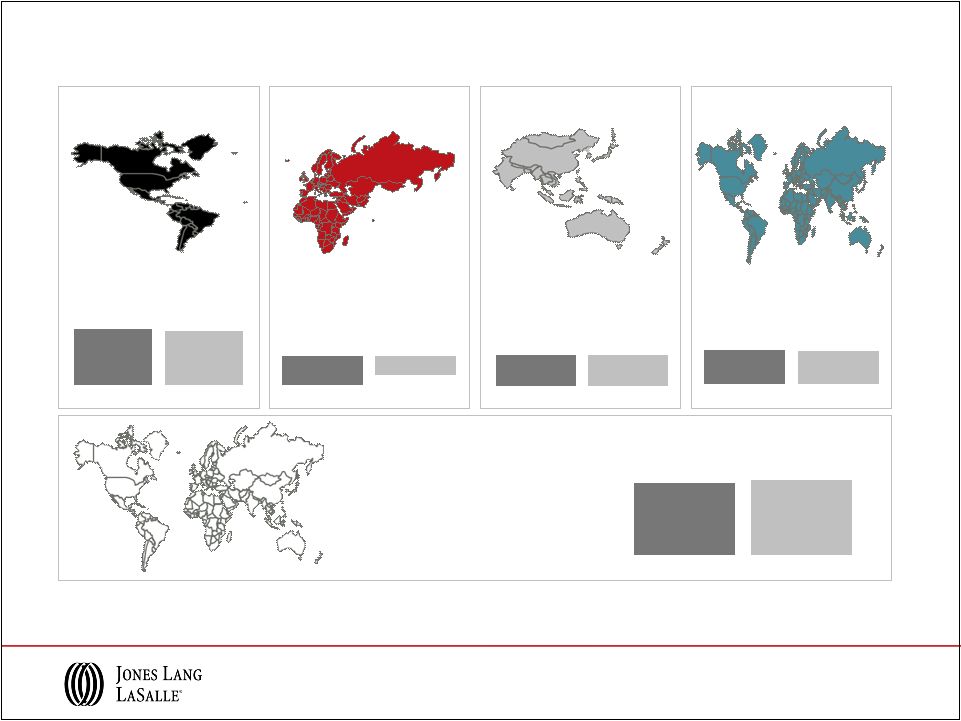
Q1 2011
As of Q1 2011
The
Jones
Lang
LaSalle
Property
Clocks
SM
Washington DC
London,
Hong Kong
Capital Value
growth slowing
Capital Value
growth
accelerating
Capital Value
bottoming out
Capital Value
falling
Chicago, Toronto
Mumbai,
Singapore, Sydney
Shanghai
Dallas, Detroit
Amsterdam, Brussels
Q1 2010
San Francisco,
Berlin
Paris,
Seoul
Tokyo
New York,
Moscow
Beijing,
Sao Paulo
Stockholm
Amsterdam,
Hong Kong
Washington DC, Sao Paulo
New York, San Francisco
Toronto,
Moscow
Chicago
Stockholm
Dallas,
Milan
Berlin, Paris,
Sydney
Detroit
Seoul, Tokyo
Brussels,
Mumbai
Shanghai
Beijing
Singapore
London
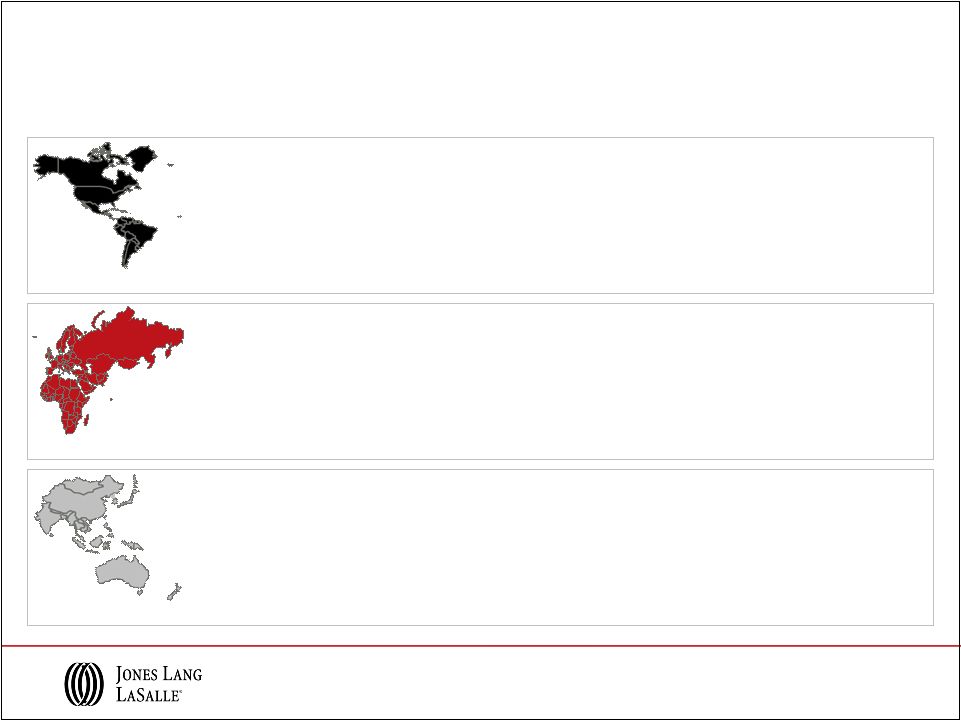
Americas
EMEA
Asia Pacific |
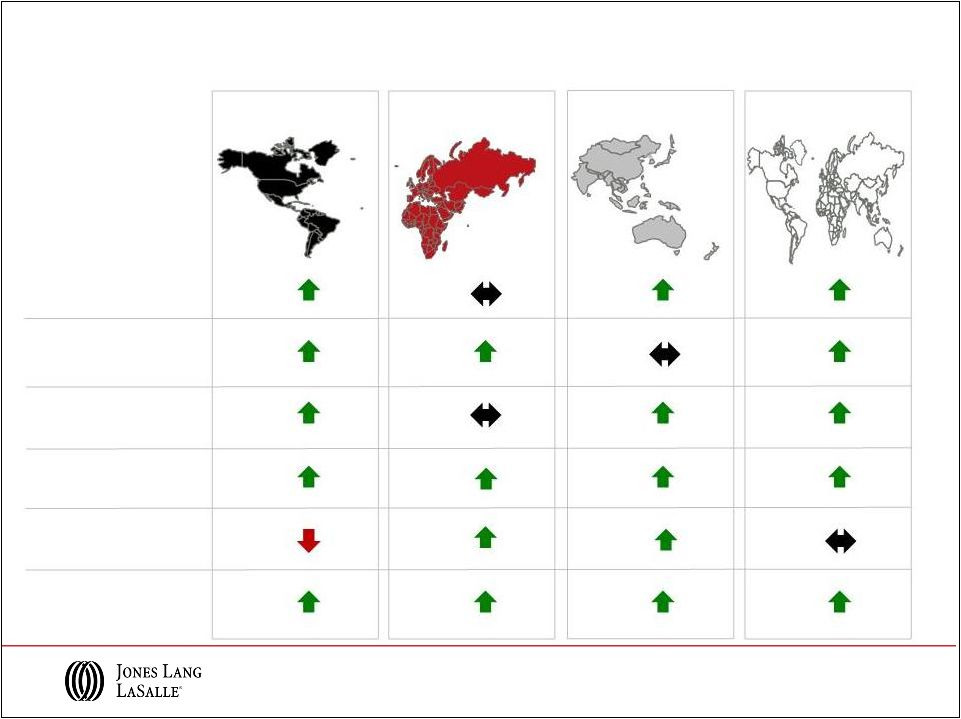
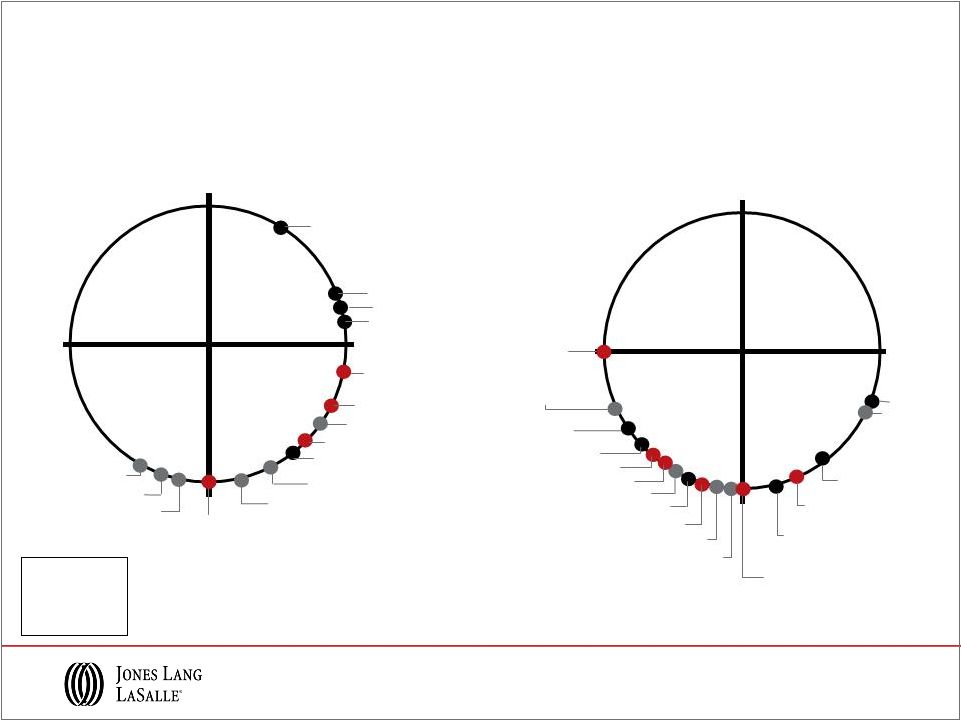 Leasing Market Fundamentals
Q1 2011
As of Q1 2011
The
Jones
Lang
LaSalle
Property
Clocks
SM
Sao Paulo,
Shanghai
Hong Kong
Rental Value
growth slowing
Rental Value
growth
accelerating
Rental Values
bottoming out
Rental Values
falling
Moscow
Milan, Stockholm
Chicago,
Singapore
Washington
DC,
Mumbai
Q1 2010
Rental Value
growth slowing
Rental Value
growth
accelerating
Rental Values
bottoming out
Rental Values
falling
Berlin, Brussels, Paris
San Francisco
Amsterdam
Americas
EMEA
Asia Pacific
Detroit
Dallas, New York
London,
Sydney
Toronto
Seoul
Tokyo
Beijing
Toronto
Beijing, Hong Kong
Washington DC
San Francisco
Singapore
New York,
Shanghai
Chicago
Amsterdam,
Dallas
Sao Paulo
London
Detroit
Seoul
Mumbai
Milan
Sydney
Moscow
Stockholm
Berlin, Paris
Brussels
Tokyo |
 Q1 Selected Business Wins and Expansions
5
–
Belk
–
28M
sf
–
Continental
Automotive
–
2.5M sf
–
Argonaut
Hotel,
San
Francisco
–
$84M
–
3344
Peachtree,
Atlanta
–
$167M
–
Multi-family
portfolio,
Washington,
D.C.
–
$460M
–
Canon Europe
–
20
Gresham
Street,
London
–
£235M
–
Montevetro,
Dublin
–
€100M+
–
Sapphire
Shopping
Centre,
Istanbul
–
323K sf
–
FedEx
–
883K sf
–
Australian
Customs
Service
–
2.9M sf
–
5
Transactions,
Singapore
–
$810M
–
Mapletree
Tower,
Beijing
–
410K sf
–
Aviapark,
Moscow
–
2.6M sf
–
Syncreon,
Germany
–
215K sf
–
Romagna
Retail
Park
–
€69M
–
Credit
Suisse,
Singapore
–
317K sf
–
HSBC,
Chennai
–
137K sf
–
Akzo
Nobel,
Shanghai
–
160K sf
Americas
EMEA
Asia Pacific
–
Nestlé,
Mexico
City
–
$100M+
–
NASA,
Washington
D.C.
–
600K sf
–
KBR
Inc.,
Houston
–
216K sf |
 Financial Information |
 7
Q1 2011 Revenue Performance
Note: Equity losses of $2.0M and $6.1M in 2011 and 2010, respectively, are included in
segment results, however, are excluded from Consolidated totals.
Americas
EMEA
Asia Pacific
$288.1
$228.4
2011
2010
$168.1
$151.4
2011
2010
$165.5
$135.7
2011
2010
$59.1
$64.2
2011
2010
Consolidated
$687.9
$580.7
2011
2010
($ in millions)
LIM
26%
11%
22%
9%
18% |
 Asia
Pacific Q1 2011 Real Estate Services Revenue
Americas
EMEA
Leasing
Capital Markets &
Hotels
Property & Facility
Management
Project &
Development Services
Advisory, Consulting
& Other
Total RES
Operating Revenue
$143.1
$19.8
$66.7
$37.2
$20.7
$287.5
35%
108%
15%
18%
9%
26%
$37.2
$28.7
$35.9
$38.4
$28.0
$168.2
4%
10%
4%
48%
8%
11%
$29.8
$17.5
$83.9
$18.1
$16.2
$165.5
17%
5%
24%
69%
7%
22%
$210.1
$66.0
$186.5
$93.7
$64.9
$621.2
23%
26%
16%
37%
21%
Total RES
Revenue
2%
($ in millions)
Note: Segment and Consolidated Real Estate Services (“RES”) operating
revenue exclude Equity earnings (losses). 8 |
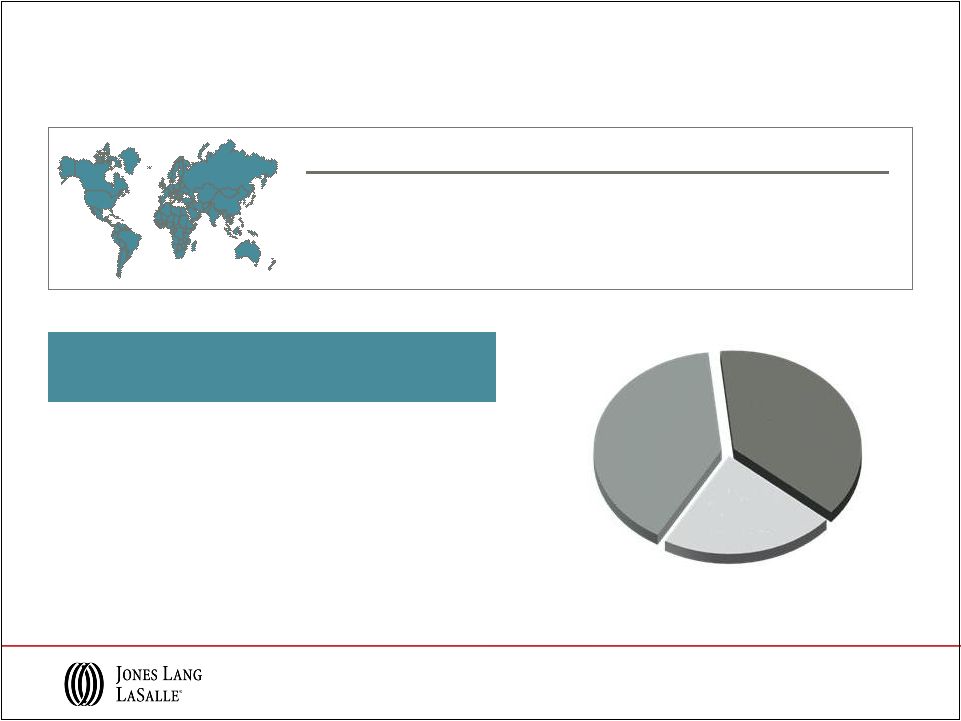 •
Strong capital raising continues, $1.5 billion of net new capital
commitments in Q1 2011
•
Momentum continues with new separate account mandates
A premier global investment manager
Q1 2011 Highlights
Product
Assets Under
Management
($ in billions)
Average
Performance
Private Equity
U.K.
$11.0
Above benchmark
Continental Europe
$4.3
Return: +1x equity
North America
$10.2
Above benchmark
Asia Pacific
$8.0
Return: +1x equity
Public Securities
$9.5
Above benchmark
Total Q1 2011 AUM
$43.0 B
AUM by Fund type
Note: AUM data reported on a one-quarter lag.
($ in billions)
LaSalle Investment Management
9
Public
Securities
$9.5
Separate
Accounts
$17.2
Fund
Management
$16.3 |
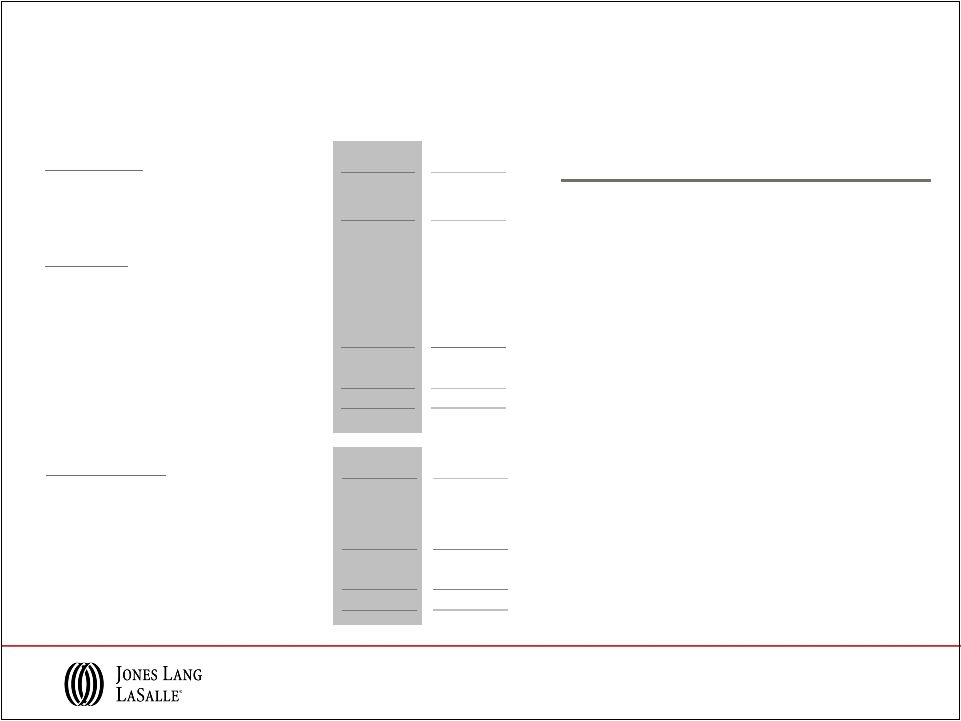 Solid Cash Flows and Balance Sheet Position
•
Healthy position after Q1 2011
incentive compensation payments
•
Net debt repayment of $184 million
over the last twelve months
•
Cash interest expense of $1.8 million,
down 51% from Q1 2010 expense of
$3.7 million
•
Investment grade ratings:
Standard & Poor’s:
BBB-
(Outlook: Stable)
Moody’s Investor Services:
Baa2
(Outlook: Stable)
Cash Flows
Q1 2011
Q1 2010
Cash from Earnings
$42
$46
Working Capital
(239)
(192)
Cash used in Operations
($197)
($146)
Primary Uses
Capital Expenses
(1)
(17)
(5)
Acquisitions & Deferred Payment Obligations
(25)
(27)
Co-Investment
(2)
(10)
Dividends
-
-
Net Cash Outflows
($44)
($42)
Net Share Activity & Other Financing
(4)
(5)
Net Bank Debt Borrowings
($245)
($193)
Balance Sheet
Q1 2011
Q1 2010
Cash
$101
$60
Short Term Borrowings
42
47
Credit Facility
278
335
Net Bank Debt
$219
$322
Deferred Business Obligations
293
374
Total Net Debt
$512
$696
($ in millions)
(1)
Capital Expenditures for Q1 2011 and Q1 2010 net of tenant improvement allowances
received were $16 million and $4 million, respectively. Q1 2011
Highlights 10 |
 Appendix |
 12
Q1 2011 EBITDA Performance
Americas
EMEA
Asia Pacific
LIM
$18.5
$18.0
2011
2010
($8.2)
($4.9)
2011
2010
$8.5
$8.5
2011
2010
$9.6
$9.1
2011
2010
Consolidated
$28.3
$29.4
2011
2010
* Refer to slide 13 for Reconciliation of GAAP Net Income to EBITDA for the three
months ended March 31, 2011, and 2010, for details relative to these EBITDA calculations.
Segment
EBITDA
is
calculated
by
adding
the
segment’s
Depreciation
and
amortization
to
its
reported
Operating
income
(loss),
which
excludes
Restructuring
charges.
Consolidated EBITDA is the sum of the EBITDA of the four segments less net income
attributable to non-controlling interests, dividends on unvested common stock and
Restructuring charges.
($ in millions) |
 13
($ in millions)
Reconciliation of GAAP Net Income to EBITDA
Three Months Ended
March 31,
2011
2010
Net Income
$1.5
$0.2
Add:
Interest expense, net of interest income
8.0
11.4
Provision for income taxes
0.5
0.1
Depreciation and amortization
18.3
17.7
EBITDA
$ 28.3
$ 29.4
|