Attached files
| file | filename |
|---|---|
| 8-K - FORM 8-K - EXELON GENERATION CO LLC | d8k.htm |
| EX-99.1 - PRESS RELEASE AND EARNINGS RELEASE - EXELON GENERATION CO LLC | dex991.htm |
 Earnings Conference Call
1
st
Quarter 2011
April 27, 2011
Exhibit 99.2 |
  2
Forward-Looking Statements
This presentation includes forward-looking statements within the meaning of the
Private Securities Litigation Reform Act of 1995, that are subject to risks
and uncertainties. The factors that could cause actual results to differ
materially from these forward-looking statements include those discussed
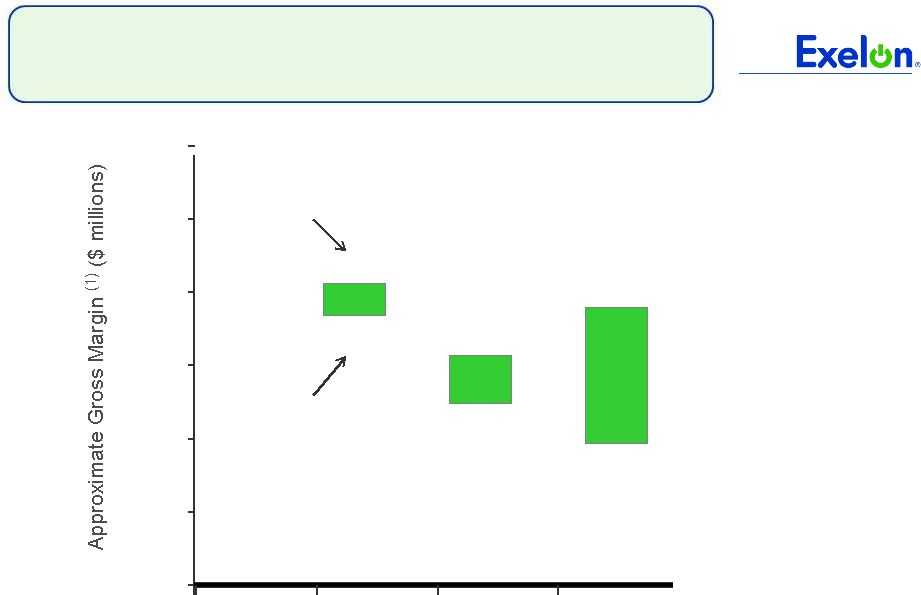
herein as well as those discussed in (1) Exelon’s 2010 Annual Report on Form
10-K in (a) ITEM 1A. Risk Factors, (b) ITEM 7. Management’s
Discussion and Analysis of Financial Condition and Results of Operations and
(c) ITEM 8. Financial Statements and Supplementary Data: Note 18; (2) Exelon’s
First Quarter 2011 Quarterly Report on Form 10-Q (to be filed on April 27,
2011) in (a) Part II, Other Information, ITEM 1A. Risk Factors, (b)
Part 1, Financial Information, ITEM 2. Management’s Discussion
and
Analysis
of
Financial
Condition
and
Results
of
Operations
and
(c)
Part
I
,
Financial
Information,
ITEM
1.
Financial
Statements:
Note
12
and
(3)
other
factors
discussed
in
filings
with
the
Securities and Exchange Commission (SEC) by Exelon Corporation, Commonwealth Edison
Company, PECO Energy Company and Exelon Generation Company, LLC (Companies).
Readers are cautioned not to place undue reliance on these
forward-looking statements, which apply only as of the date of this
presentation. None of the Companies undertakes any obligation to publicly release
any revision to its forward-looking statements to reflect events or
circumstances after the date of this presentation.
This presentation includes references to adjusted (non-GAAP) operating earnings
and non-GAAP cash flows that exclude the impact of certain factors. We
believe that these adjusted operating earnings and cash flows are
representative of the underlying operational results of the Companies.
Please refer to the appendix to this presentation for a reconciliation of adjusted
(non-GAAP) operating earnings
to
GAAP
earnings.
Please
refer
to
the
footnotes
of
the
following
slides
for
a
reconciliation
of
non-GAAP cash flows to GAAP cash flows. |
  3
2011 Operating Earnings Guidance
2011 Guidance
(2)
ComEd
PECO
Exelon
Generation
Holdco
Exelon
$3.90 -
$4.20
(1)
$0.55 -
$0.65
$0.50 -
$0.60
$2.85 -
$3.05
(1)
Refer
to
Earnings
Release
Attachments
for
additional
details
and
to
the
Appendix
for
a
reconciliation
of
adjusted
(non-GAAP)
operating
EPS
to
GAAP
EPS.
(2)
Earnings
guidance
for
OpCos
may
not
add
up
to
consolidated
EPS
guidance.
Strong operating and financial
results in first quarter
•
Higher than expected operating EPS of
$1.17 mainly driven by higher
Generation gross margin and PA bonus
depreciation
•
Nuclear capacity factor of 94.8%
Reaffirming 2011 operating earnings
guidance of $3.90 -
$4.20/share
(1) |
  4
Key Messages
EPA’s proposed Air Toxics and 316(b) rules largely as
expected
•
Expect final rules to be implemented on time
•
Impact to the industry is manageable
FERC ruling on PJM MOPR defends competitive markets
Exelon’s nuclear plants are safe
•
Continuing to work with NRC and other stakeholders to evaluate
lessons learned and respond to Fukushima event
Pursuing projects to increase value
•
Transmission projects near Clinton and Quad Cities will reduce
congestion |
  5
Key Financial Messages
1Q 2011 operating earnings of $1.17/share
(1)
•
Quarter results $0.17/share better than prior year
•
Quarter earnings exceeded guidance as a result of:
Favorable market conditions in the South region driven by weather
Pennsylvania bonus depreciation
Lower O&M cost than expected, primarily timing
Expect to generate $4.3 billion cash from operations in 2011
Expect 2Q 2011 operating earnings of $0.90 -
$1.00/share
(1)
(1) Refer to Earnings Release Attachments for additional details
and to the Appendix for a reconciliation of adjusted (non-GAAP) operating EPS to GAAP EPS. |
  6
Exelon Generation
Operating EPS Contribution
2010
2011
(1) Refer to the Earnings Release Attachments for additional details and to the
Appendix for a reconciliation of adjusted (non-GAAP) operating EPS to GAAP EPS.
(2) Outage days exclude Salem.
Outage Days
(2)
1Q10
1Q11
Refueling
101
44
Non-refueling
5
14
1Q
$0.66
$0.90
Note: PPA = Power Purchase Agreement
Key Drivers –
1Q11 vs. 1Q10
(1)
Higher margins due to expiration of
the PECO PPA: $0.19
Favorable capacity pricing: $0.06
Nuclear volume: $0.04
Increased depreciation expense:
$(0.02)
Higher nuclear fuel costs: $(0.01)
Higher interest expense: $(0.01) |
  Power
Fundamentals & Hedging Update |
  8
Key Drivers –
1Q11 vs. 1Q10
(1)
2010 uncollectible expense rider: $(0.06)
Appellate Court ruling: $(0.01)
ComEd Operating EPS Contribution
(1) Refer to the Earnings Release Attachments for additional details and to the
Appendix for a reconciliation of adjusted (non-GAAP) operating EPS to GAAP EPS.
2010
2011
1Q
$0.19
1Q11
Actual
Normal
% Change
Heating Degree-Days
3,332 3,208 3.9%
$0.11 |
  9
9
9
ComEd Load Trends |
  10
PECO Operating EPS Contribution
Key Drivers –
1Q11 vs. 1Q10
(1)
Electric and gas distribution rates: $0.05
2010 CTC collections, net of
amortization expense: $(0.05)
Lower interest expense: $0.01
2010
2011
(1) Refer to the Earnings Release Attachments for additional details and to the
Appendix for a reconciliation of adjusted (non-GAAP) operating EPS to GAAP EPS. 1Q
$0.17
1Q11
$0.19
Actual
Normal
% Change
Heating Degree-Days
2,506 2,510 (0.2)%
Note: CTC = Competitive Transition Charge |
  11
PECO Load Trends |
  12
2011 Projected Sources and Uses of Cash
(1)
Excludes counterparty collateral activity.
(2)
Cash Flow from Operations primarily includes net cash flows provided by operating
activities and net cash flows used in investing activities other than capital expenditures.
(3)
Assumes 2011 dividend of $2.10/share. Dividends are subject to declaration by
the Board of Directors. (4)
Includes $450 million in Nuclear Uprates and $225 million for Exelon Wind spend.
(5)
Represents new business, smart grid/smart meter investment and transmission growth
projects. (6)
Excludes ComEd’s $191 million of tax-exempt bonds that are backed by
letters of credit (LOCs). Excludes PECO’s $225 million Accounts Receivable (A/R) Agreement with Bank of Tokyo.
PECO’s A/R Agreement was extended in accordance with its terms through
September 6, 2011. (7)
“Other”
includes proceeds from options and expected changes in short-term debt.
(8) Includes cash flow activity from Holding Company, eliminations, and
other corporate entities. |
| 13
Exelon Generation Hedging Disclosures
(as of March 31, 2011)
*
*
*
*
*
*
*
*
*
*
*
*
*
*
*
*
*
*
* |
  14
14
Important Information
The following slides are intended to provide additional information regarding the hedging program at
Exelon Generation and to serve as an aid for the purposes of modeling Exelon Generation’s
gross margin (operating revenues less purchased power and fuel expense). The information on the
following slides is not intended to represent earnings guidance or a forecast of future
events. In fact, many of the factors that ultimately will determine Exelon
Generation’s actual gross margin are based upon highly variable market factors outside of
our control. The information on the following slides is as of March 31, 2011. We
update this information on a quarterly basis. Certain information on the following slides
is based upon an internal simulation model that incorporates assumptions regarding future market
conditions, including power and commodity prices, heat rates, and demand conditions, in addition
to operating performance and dispatch characteristics of our generating fleet. Our
simulation model and the assumptions therein are subject to change. For example, actual
market conditions and the dispatch profile of our generation fleet in future periods will likely differ
– and may differ significantly – from the assumptions underlying the simulation results
included in the slides. In addition, the forward-looking information included in the
following slides will likely change over time due to continued refinement of our simulation model
and changes in our views on future market conditions.
|
       15
15
Portfolio Management Objective
Align Hedging Activities with Financial Commitments
Power Team utilizes several product types
and channels to market
•
Wholesale and retail sales
•
Block products
•
Load-following products
and load auctions
•
Put/call options
Exelon’s hedging program is designed to
protect the long-term value of our
generating fleet and maintain an
investment-grade balance sheet
•
Hedge enough commodity risk to meet future cash
requirements if prices drop
•
Consider: financing policy (credit rating objectives,
capital structure, liquidity); spending (capital and
O&M); shareholder value return policy
Consider market, credit, operational risk
Approach to managing volatility
•
Increase hedging as delivery approaches
•
Have enough supply to meet peak load
•
Purchase fossil fuels as power is sold
•
Choose hedging products based on generation
portfolio –
sell what we own
•
Heat rate options
•
Fuel products
•
Capacity
•
Renewable credits
% Hedged
High End of Profit
Low End of Profit
Open Generation
with LT Contracts
Portfolio
Optimization
Portfolio
Management
Portfolio Management Over Time |
  16
16
Percentage of Expected
Generation Hedged
•
How many equivalent MW have been
hedged at forward market prices; all hedge
products used are converted to an
equivalent average MW volume
•
Takes ALL
hedges into account whether
they are power sales or financial products
Equivalent MWs Sold
Expected Generation
=
Our normal practice is to hedge commodity risk on a ratable basis
over the three years leading to the spot market
•
Carry operational length into spot market to manage forced outage and
load-following risks
•
By
using
the
appropriate
product
mix,
expected
generation
hedged
approaches
the
mid-90s percentile as the delivery period approaches
•
Participation in larger procurement events, such as utility auctions, and some
flexibility in the timing of hedging may mean the hedge program is not
strictly ratable from quarter to quarter
Exelon Generation Hedging Program |
  17
17
2011
2012
2013
Estimated Open Gross Margin ($ millions)
(1)(2)
$5,250
$4,900
$5,500
Open gross margin assumes all expected generation is sold
at the Reference Prices listed below
Reference Prices
(1)
Henry Hub Natural Gas ($/MMBtu)
NI-Hub ATC Energy Price ($/MWh)
PJM-W ATC Energy Price ($/MWh)
ERCOT North ATC Spark Spread ($/MWh)
(3)
$4.47
$31.32
$44.23
$4.42
$5.06
$31.32
$46.19
$1.88
$5.41
$32.83
$48.10
$2.06
Exelon Generation Open Gross Margin and
Reference Prices
(1)
Based on March 31, 2011 market conditions.
(2)
Gross margin is defined as operating revenues less fuel expense and purchased power
expense, excluding the impact of decommissioning and other incidental revenues. Open
gross margin is estimated based upon an internal model that is developed by
dispatching our expected generation to current market power and fossil fuel prices. Open gross margin
assumes
there
is
no
hedging
in
place
other
than
fixed
assumptions
for
capacity
cleared
in
the
RPM
auctions
and
uranium
costs
for
nuclear
power
plants.
Open
gross
margin
contains assumptions for other gross margin line items such as various ISO bill and
ancillary revenues and costs and PPA capacity revenues and payments. The estimation of open
gross margin incorporates management discretion and modeling assumptions that are
subject to change. (3)
ERCOT North ATC spark spread using Houston Ship Channel Gas, 7,200 heat rate, $2.50
variable O&M. |
  18
18
2011
2012
2013
Expected Generation
(GWh)
(1)
165,800
165,400
162,800
Midwest
99,000
97,800
96,100
Mid-Atlantic
56,300
57,200
56,400
South & West
10,500
10,400
10,300
Percentage of Expected Generation Hedged
(2)
93-96%
73-76%
38-41%
Midwest
93-96
75-78
35-38
Mid-Atlantic
94-97
72-75
42-45
South & West
76-79
59-62
40-43
Effective Realized Energy Price
($/MWh)
(3)
Midwest
$43.00
$41.00
$41.00
Mid-Atlantic
$56.50
$50.50
$50.50
South & West
$4.50
$0.00
($3.00)
Generation Profile
(1)
Expected generation represents the amount of energy estimated to
be generated or purchased through owned or contracted for capacity. Expected
generation is based upon a simulated
dispatch
model
that
makes
assumptions
regarding
future
market
conditions,
which
are
calibrated
to
market
quotes
for
power,
fuel,
load
following
products,
and
options.
Expected generation assumes 12 refueling outages in 2011 and 10 refueling outages
in 2012 and 2013 at Exelon-operated nuclear plants and Salem. Expected generation assumes
capacity factors of 93.0%, 93.6% and 93.1% in 2011, 2012 and 2013 at
Exelon-operated nuclear plants. These estimates of expected generation in 2012 and 2013 do not represent
guidance or a forecast of future results as Exelon has not completed its planning
or optimization processes for those years. (2)
Percent of expected generation hedged is the amount of equivalent sales divided by
the expected generation. Includes all hedging products, such as wholesale and retail sales of power,
options and swaps. Uses expected value on options. Reflects decision to
permanently retire Cromby Station and Eddystone Units 1&2 as of May 31, 2011.
(3)
Effective realized energy price is representative of an all-in hedged price, on
a per MWh basis, at which expected generation has been hedged. It is developed by considering the energy
revenues
and
costs
associated
with
our
hedges
and
by
considering
the
fossil
fuel
that
has
been
purchased
to
lock
in
margin.
It
excludes
uranium
costs
and
RPM
capacity
revenue,
but
includes
the
mark-to-market
value
of
capacity
contracted
at
prices
other
than
RPM
clearing
prices
including
our
load
obligations.
It
can
be
compared
with
the
reference
prices
used
to
calculate open gross margin in order to determine the mark-to-market value
of Exelon Generation's energy hedges. |
  19
19
Gross Margin Sensitivities with Existing Hedges ($ millions)
(1)
Henry Hub Natural Gas
+ $1/MMBtu
-
$1/MMBtu
NI-Hub ATC Energy Price
+$5/MWH
-$5/MWH
PJM-W ATC Energy Price
+$5/MWH
-$5/MWH
Nuclear Capacity Factor
+1% / -1%
2011
$5
$(5)
$15
$(10)
$10
$(10)
+/-
$30
2012
$145
$(65)
$145
$(125)
$90
$(90)
+/-
$45
2013
$425
$(380)
$315
$(310)
$180
$(175)
+/-
$45
Exelon Generation Gross Margin Sensitivities
(with Existing Hedges)
(1)
Based on March 31, 2011 market conditions and hedged position. Gas price
sensitivities are based on an assumed gas-power relationship derived from an internal
model
that
is
updated
periodically.
Power
prices
sensitivities
are
derived
by
adjusting
the
power
price
assumption
while
keeping
all
other
prices
inputs
constant.
Due
to
correlation
of
the
various
assumptions,
the
hedged
gross
margin
impact
calculated
by
aggregating
individual
sensitivities
may
not
be
equal
to
the
hedged
gross margin
impact calculated when correlations between the various assumptions are also
considered. |
  20
20
95% case
5% case
$5,500
$7,100
$6,800
$6,200
Exelon Generation Gross Margin Upside / Risk
(with Existing Hedges)
$3,000
$4,000
$5,000
$6,000
$7,000
$8,000
$9,000
2011
2012
2013
(1)
Represents
an
approximate
range
of
expected
gross
margin,
taking
into
account
hedges
in
place,
between
the
5th
and
95th
percent
confidence
levels
assuming
all
unhedged
supply
is
sold
into
the
spot
market.
Approximate
gross
margin
ranges
are
based
upon
an
internal
simulation
model
and
are
subject
to
change
based
upon
market
inputs,
future
transactions
and
potential
modeling
changes.
These
ranges
of
approximate
gross
margin
in
2012
and
2013
do
not
represent
earnings
guidance
or
a
forecast
of
future
results
as
Exelon
has
not
completed
its
planning
or
optimization
processes
for
those
years.
The
price
distributions
that
generate
this
range
are
calibrated
to
market
quotes
for
power,
fuel,
load
following
products
and
options
as
of
March
31,
2011.
$6,900
$4,900 |
  21
21
Midwest
Mid-Atlantic
South & West
Step 1
Start with fleetwide open gross margin
$5.25 billion
Step 2
Determine the mark-to-market
value
of energy hedges
99,000GWh * 94% *
($43.00/MWh-$31.32MWh)
= $1.09 billion
56,300GWh * 95% *
($56.50/MWh-$44.23MWh)
= $0.66 billion
10,500GWh * 77% *
($4.50/MWh-$4.42/MWh)
= $0.00 billion
Step 3
Estimate hedged gross margin
by
adding open gross margin to mark-to-
market value of energy hedges
Open gross
margin: $5.25 billion
MTM value of energy
hedges: $1.09billion + $0.66billion + $0.00 billion
Estimated hedged gross margin:
$7.00 billion
Illustrative Example
of Modeling Exelon Generation 2011 Gross Margin
(with Existing Hedges) |
  22
22
35
40
45
50
55
60
65
70
75
4/10
5/10
6/10
7/10
8/10
9/10
10/10
11/10
12/10
1/11
2/11
3/11
4/11
4.0
4.5
5.0
5.5
6.0
6.5
7.0
7.5
8.0
4/10
5/10
6/10
7/10
8/10
9/10
10/10
11/10
12/10
1/11
2/11
3/11
4/11
22
22
20
25
30
35
40
45
4/10
5/10
6/10
7/10
8/10
9/10
10/10
11/10
12/10
1/11
2/11
3/11
4/11
50
55
60
65
70
75
80
85
90
4/10
5/10
6/10
7/10
8/10
9/10
10/10
11/10
12/10
1/11
2/11
3/11
4/11
Market Price Snapshot
Forward NYMEX Natural Gas
PJM-West and Ni-Hub On-Peak Forward Prices
PJM-West and Ni-Hub Wrap Forward Prices
2012
$5.26
2013 $5.54
Rolling 12 months, as of April 15th
2011. Source: OTC quotes and electronic trading system. Quotes
are daily.
Forward NYMEX Coal
2012
$77.69
2013
$81.53
2012 Ni-Hub $40.67
2013 Ni-Hub
$42.74
2013 PJM-West $54.38
2012 PJM-West
$52.35
2012 Ni-Hub
$25.20
2013 Ni-Hub
$27.30
2013 PJM-West
$40.85
2012 PJM-West
$38.94 |
  23
23
23
23
4.5
5.5
6.5
7.5
8.5
9.5
10.5
11.5
12.5
13.5
4/10
5/10
6/10
7/10
8/10
9/10
10/10
11/10
12/10
1/11
2/11
3/11
4/11
8.0
8.2
8.4
8.6
8.8
9.0
9.2
9.4
9.6
9.8
10.0
4/10
5/10
6/10
7/10
8/10
9/10
10/10
11/10
12/10
1/11
2/11
3/11
4/11
35
40
45
50
55
60
65
70
4/10
5/10
6/10
7/10
8/10
9/10
10/10
11/10
12/10
1/11
2/11
3/11
4/11
3.5
4.0
4.5
5.0
5.5
6.0
6.5
7.0
7.5
8.0
4/10
5/10
6/10
7/10
8/10
9/10
10/10
11/10
12/10
1/11
2/11
3/11
4/11
Market Price Snapshot
2013
9.35
2012
9.21
2012
$47.30
2013
$50.61
2012
$5.14
2013
$5.42
Houston Ship Channel Natural Gas
Forward Prices
ERCOT North On-Peak Forward Prices
ERCOT North On-Peak v. Houston Ship Channel
Implied Heat Rate
2012
$7.70
2013
$9.02
ERCOT North On Peak Spark Spread
Assumes a 7.2 Heat Rate, $1.50 O&M, and $.15 adder
Rolling 12 months, as of April 15th
2011. Source: OTC quotes and electronic trading system. Quotes
are daily. |
| 24
Appendix
*
*
*
*
*
*
*
*
*
*
*
*
*
*
*
*
*
*
***************************
***************************
***************************
***************************
***************************
***************************
***************************
***************************
***************************
***************************
***************************
***************************
***************************
***************************
***************************
***************************
***************************
***************************
***************************
***************************
***************************
***************************
*************************** |
  25
2011 Events of Interest
Q1
Q2
Q3
Q4
RPM Auction results
(5/13)
Illinois Power Agency
RFP (5/16)
ALJ Proposed Order
–
DST Rate Case
(4/1)
Procurement RFP
(bids due 5/2; results
by 5/17)
DST Rate Case Final
Order (by 5/31)
EPA Final Toxics
Rule (November)
Retirement of Cromby
1 & Eddystone 1 units
(5/31)
Proposed Toxics Rule
(3/16)
Procurement RFP
(bids due 9/19;
results by 10/19)
Retirement of
Cromby 2 unit
(12/31)
Proposed 316(b) EPA
Regulation (3/28)
For
definition
of
the
EPA
regulations
referred
to
on
this
slide,
please
see
the
EPA’s
Terms
of
Environment
(http://www.epa.gov/OCEPAterms/).
EPA Final Transport
Rule (June) |
  26 |
  27
Exelon View on Proposed CWA Sec. 316(b) Rule |
  28
28
EPA Regulations Will Move Forward in 2011
2010
2011
2012
2013
2014
2015
2016
2017
2018
PJM RPM Auction
14/15
15/16
16/17
17/18
Hazardous Air
Pollutants
Criteria
Pollutants
Greenhouse
Gases
Coal
Combustion
By-Products
Cooling Water
Effluents
Develop Toxics Rule
Develop ICI
MACT
Pre Compliance Period
Compliance With Toxics Rule
Pre Compliance Period
Compliance With ICI MACT
Develop
Transport Rule
Compliance With Transport Rule
Interim CAIR
Develop O3
Transport
Rule (TR 2)
Estimated Compliance
Develop Criteria
NSPS revision
Compliance with Revised Criteria NSPS
Develop Revised
NAAQS
SIP provisions developed in response to revised NAAQS
(e.g., Ozone, PM2.5, SO2, NO2, NOx/SOx, CO)
Compliance with Federal GHG Reporting Rule
PSD/BACT and Title V Apply to GHG Emissions (PSD only for new and modified
sources) Develop GHG NSPS
Pre Compliance Period
Compliance With GHG NSPS
Develop Coal Combustion
By-Products Rule
Pre Compliance Period
Compliance With Federal CCB Regulations
Develop 316(b) Regulations
Pre Compliance Period
Phase In Of Compliance
Develop Effluent Regulations
Pre Compliance Period
Phase In Of
Compliance
Notes: RPM auctions take place annually in May.
For
definition
of
the
EPA
regulations
referred
to
on
this
slide,
please
see
the
EPA’s
Terms
of
Environment
(http://www.epa.gov/OCEPAterms/). |
  29
Factors Influencing PJM RPM Capacity Auction
(Comparison of PY 14/15 and PY 13/14 Price Drivers)
Exelon
Price Impact
Cost
of
Environmental
Upgrades
(1)
Higher Net CONE
(2)
Higher
Net
ACRs
for
Coal
Units
(3)
Import Transmission Limits and Objectives
(muted impact on portfolio revenues due to regional diversification)
NJ CCGT Proposal / PJM Minimum Offer Price Rules
Peak Load
(4)
Demand Response Growth
2014/15 PJM Capacity Auction: Expected
Changes Since Planning Year 2013/14
(1) We expect generators to reflect cost of capital expenditures into their
cost based offers at the upcoming auction. (2) Cost of new entry
(CONE) increased by 7.6% (for RTO) and 5.3% to 6.5% (within Locational Deliverability Areas (LDAs)).
(3) Replacing 2007 net revenues with significantly lower 2010 revenues in the
Net ACR (avoidable cost rate) calculations for coal generators may increase offer caps for certain
coal
generators
in
the
next
auction.
However,
some
coal
units
may
not
be
affected
due
to
high
net
revenues
compared
to
avoidable
costs.
(4) Peak load reduced by approx. 1% in RTO (excluding the impact from Duke
Ohio integration). Note:
RPM
=
Reliability
Pricing
Model;
CCGT
=
combined
cycle
gas
turbine
Expect overall results to be similar to last year’s auction
N/A |
  30
Exelon’s Nuclear Plants Are Designed to
Withstand Extreme Environmental Hazards
None of Exelon’s plants are in major earthquake zones
Designed
to
withstand
highest
level
of
seismic
activity
for
that
location,
with
additional margin
Regular seismic analyses are performed and the NRC reviews new
information on earthquake sources and ground motion models to
determine if changes are necessary
Emergency core cooling systems are protected from water incursion,
including water tight doors, elevation of equipment above potential flood
levels and/or special engineered flood barriers (on a site-specific
basis) Fuel tanks are buried underground or enclosed in buildings
Switchgear for emergency operations are elevated above flood levels
All but one of Exelon’s plants are in Illinois and Pennsylvania
Oyster
Creek
(in
NJ)
is
more
than
5
miles
inland,
behind
barrier
islands
•
Tsunamis are extremely rare in the mid-Atlantic
•
Oyster Creek is 23 feet above sea level, while the maximum recorded
high tide on the Barnegat Bay beachfront 5 miles away is 7 feet above
sea level
The NRC requires all nuclear plants in the US to be able to withstand the most
severe natural phenomena historically reported for each plant’s surrounding
area, with a significant margin for uncertainty
Tsunami
Flood
Earthquake |
  31
Exelon Nuclear Fleet Overview -
IL
Plant
Location
Type/
Containment
Water Body
License Extension
Status / License
Expiration
(1)
Ownership
Spent Fuel Storage/
Date to lose full
core discharge
capacity
(2)
Braidwood, IL
(Units 1 and 2)
PWR
Concrete/Steel
Lined
Kankakee
River
Expect to file
application in 2013/
2026, 2027
100%
Dry Cask (Summer
2011)
Byron, IL
(Units 1 and 2)
PWR
Concrete/Steel
Lined
Rock River
Expect to file
application in 2013/
2024, 2026
100%
Dry Cask
Clinton, IL
(Unit 1)
BWR
Concrete/Steel
Lined
Clinton Lake
2026
100%
2018
Dresden, IL
(Units 2 and 3)
BWR
Steel Vessel
Kankakee
River
Renewed / 2029,
2031
100%
Dry cask
LaSalle, IL
(Units 1 and 2)
BWR
Concrete/Steel
Lined
Illinois River
2022, 2023
100%
Dry Cask
Quad Cities, IL
(Units 1 and 2)
BWR
Steel Vessel
Mississippi
River
Renewed / 2032
75% Exelon, 25%
Mid-American
Holdings
Dry cask
(1)
Operating license renewal process takes approximately 4-5 years from
commencement until completion of NRC review. (2)
The date for loss of full core reserve identifies when the on-site storage pool
will no longer have sufficient space to receive a full complement of fuel from the
reactor core. Dry cask storage will be in operation at those sites prior to losing
full core discharge capacity in their on-site storage pools. Exelon
pursues
license
extensions
well
in
advance
of
expiration
to
ensure
adequate
time
for review by the NRC |
  32
Exelon Nuclear Fleet Overview –
PA and NJ
Plant, Location
Type,
Containment
Water Body
License
Extension Status /
License
Expiration
(1)
Ownership
Spent Fuel Storage/
Date to lose full
core discharge
capacity
(2)
Limerick, PA
(Units 1 and 2)
BWR
Concrete/Steel
Lined
Schuylkill
River
Expect to file
application in 2011/
2024, 2029
100%
Dry cask
Oyster Creek, NJ
(Unit 1)
BWR
Steel Vessel
Barnegat Bay
Renewed / 2029
(3)
100%
Dry cask
Peach Bottom, PA
(Units 2 and 3)
BWR
Steel Vessel
Susquehanna
River
Renewed / 2033,
2034
50% Exelon,
50% PSEG
Dry cask
TMI, PA (Unit 1)
PWR
Concrete/Steel
Lined
Susquehanna
River
Renewed / 2034
100%
2023
Salem, NJ (Units 1
and 2)
PWR
Concrete/Steel
Lined
Delaware
River
In process
(decision in 2011-
2012) / 2016, 2020
42.6% Exelon,
57.4% PSEG
Dry Cask
(1)
Operating license renewal process takes approximately 4-5 years from
commencement until completion of NRC review. (2)
The date for loss of full core reserve identifies when the on-site storage pool
will no longer have sufficient space to receive a full complement of fuel from the
reactor core. Dry cask storage will be in operation at those sites prior to losing
full core discharge capacity in their on-site storage pools. (3)
On December 8, 2010, Exelon announced that Generation will permanently cease
generation operations at Oyster Creek by December 31, 2019. The current NRC
license for Oyster Creek expires in 2029. Exelon
pursues
license
extensions
well
in
advance
of
expiration
to
ensure
adequate
time
for review by the NRC |
  33
33
33
ComEd 2010 Rate Case Update
ComEd Reply Brief (2/23/11)
$343M increase requested
11.50% ROE / 47.28% equity ratio
Rate base $7,349M
2009 test year with pro forma plant additions through 6/30/11
ICC Staff Reply Brief Position (2/23/11)
$113M increase proposed
10.00% ROE / 47.11% equity ratio
Rate base $6,480M
Pro forma plant additions and depreciation reserve through 12/31/10
ALJ Proposed Order (4/1/11)
$152M increase proposed (after correcting ~$14M calculation error)
10.50% ROE / 47.28% equity ratio
Rate base $6,629M
Pro forma plant additions and depreciation reserve through 12/31/10 with very
limited exceptions (ICC Docket No. 10-0467)
Illinois Commerce Commission Final Order will be issued by May 31
|
  34
34
ComEd –
Proposed Infrastructure
Investment and Modernization Legislation
Proposed Grid Modernization
Legislation Key Concepts
Incremental investment of $2.6B of capital
over 10 years
•
$1.5B smart grid/smart meter
•
$1.1B infrastructure improvements
Incorporates an annual formula rate
proceeding, similar to FERC Transmission
rate
•
Protocols clarify treatment of several
significant items, including pension costs
and pension asset
•
ROE formula based on average 30-year
Treasury yield
Reduces proceeding timeframe from 11
months to less than 9 months
ComEd is driving innovative regulatory and legislative strategy to benefit customers,
improve the transparency of the ratemaking process and enable economic
development |
  35
PECO Procurement Plan
(1)
See PECO Procurement website (http://www.pecoprocurement.com) for additional
details regarding PECO’s procurement plan and RFP results. (2)
For Large C&I customers who previously opted to participate in the 2011
fixed-priced full requirements product. (3)
Large C&I tranches which were not fully subscribed in the fall 2010
procurement Customer Class
Products
Residential
75% full requirements
20% block energy
5% energy only spot
Small Commercial
(peak demand <100 kW)
90% full requirements
10% full requirements spot
Medium Commercial
(peak demand >100 kW but
<= 500 kW)
85% full requirements
15% full requirements spot
Large Commercial &
Industrial (peak demand
>500 kW)
Fixed-Priced Full
requirements
(2)
Hourly Full requirements
PECO Procurement Plan
(1)
Residential
80 MW of baseload (24x7) block energy product (for Jan-Dec 2012)
70 MW of Jun-Aug 2011 summer on-peak block energy product
40 MW of Dec 2011-Feb 2012 winter on-peak block energy product
Large
Commercial
and
Industrial
-
Hourly
36%
of
Hourly
Full
requirements
product
(Jun
2011-May
2012)
(3)
May 2, 2011 RFP -
Fifth in a series
of nine procurements for the PUC-
approved Default Service Plan
Spring 2011 RFP to be held on May 2, 2011, with results public 15 days
thereafter |
  36
36
ComEd Customer Usage Breakdown |
  37
PECO Customer Usage Breakdown |
  38
Sufficient Liquidity
(1) Excludes commitments from Exelon’s Community and Minority Bank Credit Facility.
(2) Available Capacity Under Facilities represents the unused bank commitments under the
borrower’s credit agreements net of outstanding letters of credit and facility draws. The
amount of commercial paper outstanding does not reduce the available capacity under the credit
agreements.
(3) Includes other corporate entities. |
  39
Key Credit Metrics
0.0x
2.0x
4.0x
6.0x
8.0x
10.0x
12.0x
2009A
2010A
2011E
ExGen/Corp
ComEd
PECO
Exelon
0%
5%
10%
15%
20%
25%
30%
35%
40%
45%
50%
2009A
2010A
2011E
ExGen/Corp
ComEd
PECO
Exelon
FFO / Debt
(1)
(1)
See slide 40 for reconciliations to GAAP.
(2)
Current senior unsecured ratings for Exelon and Exelon Generation and senior
secured ratings for ComEd and PECO as of April 21, 2011. (3)
FFO/Debt Target Range reflects Generation FFO/Debt in addition to the debt
obligations of Exelon Corp. Moody’s
Credit
Ratings
(2)
S&P
Credit
Ratings
(2)
Fitch
Credit
Ratings
(2)
FFO / Debt
Target
Range
(2)
Exelon:
Baa1
BBB-
BBB+
ComEd:
Baa1
A-
BBB+
15-18%
PECO:
A1
A-
A
15-18%
Generation:
A3
BBB
BBB+
30-35%
(3)
Interest Coverage
(1)
0%
10%
20%
30%
40%
50%
60%
70%
80%
90%
100%
2009A
2010A
2011E
ExGen/Corp
ComEd
PECO
Exelon
Debt / Cap
(1) |
  40
Exelon Consolidated Metric Calculations and Ratios
Exelon 2010 YE Adjustments
FFO Calculation
2010 YE
Source - 2010 Form 10-K (.pdf version)
Net Cash Flows provided by Operating Activities
5,244
Pg 159 - Stmt. of Cash Flows
+/- Change in Working Capital
644
Pg 159 - Stmt. of Cash Flows
(1)
- PECO Transition Bond Principal Paydown
(392)
Pg 174 - Stmt. of Cash Flows
(2)
+ PPA Depreciation Adjustment
207
Pg 295 - Commitments and Contingencies
(3)
+/- Pension/OPEB Contribution Normalization
448
Pg 268-269 - Post-retirement Benefits
(4)
+ Operating Lease Depreciation Adjustment
35
Pg 299 - Commitments and Contingencies
(5)
+/- Decommissioning activity
(143)
Pg 159- Stmt. of Cash Flows
+/- Other Minor FFO Adjustments
(6)
(54)
= FFO (a)
5,989
Debt Calculation
Long-term Debt (incl. Current Maturities and A/R agreement)
12,828
Pg 161 - Balance Sheet
Short-term debt (incl. Notes Payable / Commercial Paper)
- Pg 161 - Balance Sheet
- PECO Transition Bond Principal Paydown
- N/A - no debt outstanding at year-end
+ PPA Imputed Debt
1,680
Pg 295 - Commitments and Contingencies
(7)
+ Pension/OPEB Imputed Debt
3,825
Pg 268 - Post-retirement benefits
(8)
+ Operating Lease Imputed Debt
428
Pg 299 - Commitments and Contingencies
(9)
+ Asset Retirement Obligation
- Pg 261-267 - Asset Retirement Obligations
(10)
+/- Other Minor Debt Equivalents
(11)
84
= Adjusted Debt (b)
18,845
Interest Calculation
Net Interest Expense
817
Pg 158 - Statement of Operations
- PECO Transition Bond Interest Expense
(22)
Pg 182 - Significant Accounting Policies
+ Interest on Present Value (PV) of Operating Leases
29
Pg 299 - Commitments and Contingencies
(12)
+ Interest on PV of Purchased Power Agreements (PPAs)
99
Pg 295 - Commitments and Contingencies
(13)
+/- Other Minor Interest Adjustments
(14)
37
= Adjusted Interest (c)
960
Equity Calculation
Total Equity
13,563
Pg 161 - Balance Sheet
+ Preferred Securities of Subsidaries
87
Pg 161 - Balance Sheet
+/- Other Minor Equity Equivalents
(15)
111
= Adjusted Equity (d)
13,761
(1)
Includes changes in A/R, Inventories, A/P and other accrued expenses, option
premiums, counterparty collateral and income taxes. Impact to FFO is
opposite of impact to cash flow (2)
Reflects retirement of variable interest entity + change in restricted cash
(3)
Reflects
net
capacity
payment
–
interest
on
PV
of
PPAs
(using
weighted
average
cost
of
debt)
(4)
Reflects
employer
contributions
–
(service
costs
+
interest
costs
+
expected
return
on
assets),
net
of
taxes at 35%
(5)
Reflects
operating
lease
payments
–
interest
on
PV
of
future
operating
lease
payments
(using
weighted average cost of debt)
(6)
Includes AFUDC / capitalized interest
(7)
Reflects PV of net capacity purchases (using weighted average cost of debt)
$ in millions
(8)
Reflects unfunded status, net of taxes at 35%
(9)
Reflects PV of minimum future operating lease payments (using weighted average cost
of debt) (10)
Nuclear decommissioning trust fund balance > asset retirement obligation.
No debt imputed (11)
Includes accrued interest less securities qualifying for hybrid treatment (50% debt
/ 50% equity) (12)
Reflects interest on PV of minimum future operating lease payments (using weighted
average cost of debt)
(13)
Reflects interest on PV of PPAs (using weighted average cost of debt)
(14)
Includes
AFUDC
/
capitalized
interest
and
interest
on
securities
qualifying
for
hybrid
treatment
(50%
debt / 50% equity)
(15)
Includes interest on securities qualifying for hybrid treatment (50% debt / 50%
equity) FFO / Debt Coverage =
FFO (a)
Adjusted Debt (b)
FFO Interest Coverage =
FFO (a) + Adjusted Interest (c)
Adjusted Interest (c)
Adjusted Capitalization (e) =
Adjusted Debt (b) + Adjusted Equity (d)
=
32,606
Rating Agency Debt Ratio =
Adjusted Debt (b)
Adjusted Capitalization (e)
32%
7.2x
58%
=
=
=
2010A Credit Metrics |
  41
1Q GAAP EPS Reconciliation
Three Months Ended March 31, 2011
ExGen
ComEd
PECO
Other
Exelon
2011 Adjusted (non-GAAP) Operating Earnings (Loss) Per Share
$0.90
$0.11
$0.19
$(0.03)
$1.17
Mark-to-market impact of economic hedging activities
(0.14)
-
-
-
(0.14)
Unrealized gains related to nuclear decommissioning trust funds
0.04
-
-
-
0.04
Retirement of fossil generating units
(0.02)
-
-
-
(0.02)
Non-cash charge resulting from Illinois tax rate change legislation
(0.03)
(0.01)
-
-
(0.04)
1Q 2011 GAAP Earnings (Loss) Per Share
$0.75
$0.10
$0.19
$(0.03)
$1.01
NOTE: All amounts shown are per Exelon share and represent contributions to
Exelon's EPS. Amounts may not add due to rounding. Three Months Ended
March 31, 2010 ExGen
ComEd
PECO
Other
Exelon
2010 Adjusted (non-GAAP) Operating Earnings (Loss) Per Share
$0.66
$0.19
$0.17
$(0.02)
$1.00
Mark-to-market impact of economic hedging activities
0.21
-
-
-
0.21
Unrealized gains related to nuclear decommissioning trust funds
0.03
-
-
-
0.03
Retirement of fossil generating units
(0.01)
-
-
-
(0.01)
Non-cash charge resulting from health care legislation
(0.04)
(0.02)
(0.02)
(0.02)
(0.10)
1Q 2010 GAAP Earnings (Loss) Per Share
$0.85
$0.17
$0.15
$(0.04)
$1.13 |
  42
GAAP to Operating Adjustments
Exelon’s 2011 adjusted (non-GAAP) operating earnings outlook excludes the
earnings effects of the following:
•
Mark-to-market adjustments from economic hedging activities
•
Unrealized gains and losses from nuclear decommissioning trust fund investments to
the extent not offset by contractual accounting as described in the notes
to the consolidated financial statements
•
Significant impairments of assets, including goodwill
•
Any changes in decommissioning obligation estimates
•
Non-cash charge to remeasure deferred taxes at higher Illinois corporate tax
rates •
Financial impacts associated with the planned retirement of fossil generating
units •
Other unusual items
•
Significant changes to GAAP
Operating
earnings
guidance
assumes
normal
weather
for
remainder
of
the
year |