Attached files
| file | filename |
|---|---|
| 8-K - FORM 8-K - Western Union CO | d8k.htm |
| EX-99.1 - PRESS RELEASE - Western Union CO | dex991.htm |
 Western Union
First Quarter 2011
Earnings Webcast & Conference Call
April 26, 2011
Exhibit 99.2 |
 Mike
Salop Senior Vice President, Investor Relations
*
*
*
*
*
*
*
*
* |
 Safe
Harbor 3
This
press
release
contains
certain
statements
that
are
forward-looking
within
the
meaning
of
the
Private
Securities
Litigation
Reform
Act
of
1995.
These
statements
are
not
guarantees
of
future
performance
and
involve
certain
risks,
uncertainties
and
assumptions
that
are
difficult
to
predict.
Actual
outcomes
and
results
may
differ
materially
from
those
expressed
in,
or
implied
by,
our
forward-looking
statements.
Words
such
as
“expects,”
“intends,”
“anticipates,”
“believes,”
“estimates,”
“guides,”
“provides
guidance,”
“provides
outlook”
and
other
similar
expressions
or
future
or
conditional
verbs
such
as
“will,”
“should,”
“would”
and
“could”
are
intended
to
identify
such
forward-looking
statements.
Readers
of
this
press
release
by
The
Western
Union
Company
(the
“Company,”
“Western
Union,”
“we,”
“our”
or
“us”)
should
not
rely
solely
on
the
forward-looking
statements
and
should
consider
all
uncertainties
and
risks
discussed
in
the
Risk
Factors
section
and
throughout
the
Annual
Report
on
Form
10-K
for
the
year
ended
December
31,
2010.
The
statements
are
only
as
of
the
date
they
are
made,
and
the
Company
undertakes
no
obligation
to
update
any
forward-looking
statement.
Possible
events
or
factors
that
could
cause
results
or
performance
to
differ
materially
from
those
expressed
in
our
forward-looking
statements
include
the
following:
changes
in
immigration
laws,
patterns
and
other
factors
related
to
migrants;
our
ability
to
adapt
technology
in
response
to
changing
industry and consumer needs or trends; our failure to develop and introduce new
products, services and enhancements, and gain market acceptance of
such
products;
the
failure
by
us,
our
agents
or
subagents
to
comply
with
our
business
and
technology
standards
and
contract
requirements
or
applicable
laws
and
regulations,
especially
laws
designed
to
prevent
money
laundering,
terrorist
financing
and
anti-competitive
behavior,
and/or
changing
regulatory
or
enforcement
interpretations
of
those
laws;
the
impact
on
our
business
of
the
Dodd-Frank
Wall
Street
Reform
and
Consumer
Protection
Act
and the rules promulgated there-under; changes in United States or foreign
laws, rules and regulations including the Internal Revenue Code, and
governmental
or
judicial
interpretations
thereof;
changes
in
general
economic
conditions
and
economic
conditions
in
the
regions
and
industries
in
which
we
operate;
political
conditions
and
related
actions
in
the
United
States
and
abroad
which
may
adversely
affect
our
businesses
and
economic
conditions
as
a
whole;
interruptions
of
United
States
government
relations
with
countries
in
which
we
have
or
are
implementing
material
agent
contracts;
changes
in,
and
failure
to
manage
effectively
exposure
to,
foreign
exchange
rates,
including
the
impact
of
the
regulation
of
foreign
exchange
spreads
on
money
transfers
and
payment
transactions;
our
ability
to
resolve
tax
matters
with
the
Internal
Revenue
Service
and
other
tax
authorities
consistent
with
our
reserves;
failure
to
comply
with
the
settlement
agreement
with
the
State
of
Arizona;
liabilities
and
unanticipated
developments
resulting
from
litigation
and
regulatory
investigations
and
similar
matters,
including
costs,
expenses,
settlements
and
judgments;
mergers,
acquisitions
and
integration
of
acquired
businesses
and
technologies
into
our
Company,
and
the
realization
of
anticipated
financial
benefits
from
these
acquisitions;
failure
to
maintain
sufficient
amounts
or
types
of
regulatory
capital
to
meet
the
changing
requirements
of
our
regulators
worldwide;
deterioration
in
consumers'
and
clients'
confidence
in
our
business,
or
in
money
transfer
providers
generally;
failure
to
manage
credit
and
fraud
risks
presented
by
our
agents,
clients
and
consumers
or
non-performance
by
our
banks,
lenders,
other
financial
services
providers
or
insurers;
any
material
breach
of
security
of
or
interruptions
in
any
of
our
systems;
our
ability
to
attract
and
retain
qualified
key
employees
and
to
manage
our
workforce
successfully;
our
ability
to
maintain
our
agent
network
and
business
relationships
under
terms
consistent
with
or
more
advantageous
to
us
than
those
currently
in
place;
failure
to
implement
agent
contracts
according
to
schedule;
adverse
rating
actions
by
credit
rating
agencies;
failure
to
compete
effectively
in
the
money
transfer
industry
with
respect
to
global
and
niche
or
corridor
money
transfer
providers,
banks
and
other
money
transfer
services
providers,
including
telecommunications
providers,
card
associations,
card-based
payment
providers
and
electronic
and
internet
providers;
our
ability
to
protect
our
brands
and
our
other
intellectual
property
rights;
our
failure
to
manage
the
potential
both
for
patent
protection
and
patent
liability
in
the
context
of
a
rapidly
developing
legal
framework
for
intellectual
property
protection;
cessation
of
various
services
provided
to
us
by
third-party
vendors;
adverse
movements
and
volatility
in
capital
markets
and
other
events
which
affect
our
liquidity,
the
liquidity
of
our
agents
or
clients,
or
the
value
of,
or
our
ability
to
recover
our
investments
or
amounts
payable
to
us;
decisions
to
downsize,
sell
or
close
units,
or
to
transition
operating
activities
from
one
location
to
another
or
to
third
parties,
particularly
transitions
from
the
United
States
to
other
countries;
changes
in
industry
standards
affecting
our
business;
changes
in
accounting
standards,
rules
and
interpretations;
significantly
slower
growth
or
declines
in
the
money
transfer
market
and
other
markets
in
which
we
operate;
adverse
consequences
from
our
spin-off
from
First
Data
Corporation;
decisions
to
change
our
business
mix;
catastrophic
events;
and
management's
ability
to
identify
and
manage
these
and
other
risks. |
 *
*
*
*
*
*
*
*
*
Hikmet Ersek
President
& Chief Executive Officer |
 Q1
Highlights Total revenue increased 4%
Strong trends continue in C2C
5% revenue growth, reported and constant currency
Domestic money transfer revenue increased 8%
Bill Payments
Revenue decline moderated to -2%
Margins improved versus Q4
Business Solutions revenue grew 13%
5
Good Start to 2011
Note: See appendix for reconciliation of Non-GAAP to GAAP measures.
|
 Electronic Channels & Prepaid Q1 Highlights
Account-based money transfer
Over 35% transaction growth
Agreements in place with over 45 banks globally
Westernunion.com
Over 40% transaction growth in international markets
Transactions increased by over 15% globally
Mobile
16 agreements in place
Over 85,000 locations enabled for cash-to-mobile in 49 countries
Prepaid
Over one million prepaid cards-in-force
Approximately $180 million principal loaded through 500,000+ loads
6
Electronic Channels 3% of Total Revenue |
 7
Go To Market Leadership
•
Consumer Money Transfer and Bill Payments
•
Global Sales and Network Management
•
New Products and Services
•
Business Solutions
•
Electronic Channels
•
Stored Value Programs
•
Global Marketing
•
Communications and Social Responsibility
David Yates
EVP & President
Business Development and Innovation
Stewart Stockdale
EVP & President
Global Consumer Financial Services
Diane Scott
EVP & Chief Marketing Officer |
 *
*
*
*
*
*
*
*
*
Scott Scheirman
Executive Vice President
& Chief Financial Officer |
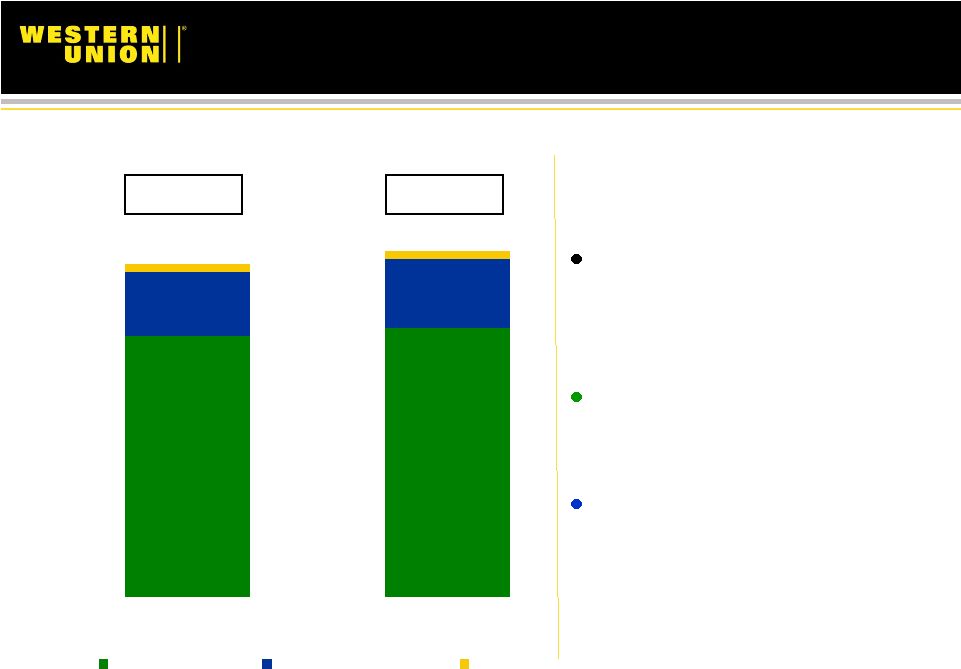 Revenue
9
($ in millions)
$1,233
$1,283
Note: See appendix for reconciliation of Non-GAAP to GAAP measures.
Consolidated revenue up 4%,
reported and constant
currency
Transaction fees increased
3%
Foreign exchange revenue
increased 8%
$29
$29
$256
$238
$966
$988
Q1 2010
Q1 2011
Transaction Fee
Foreign Exchange
Other |
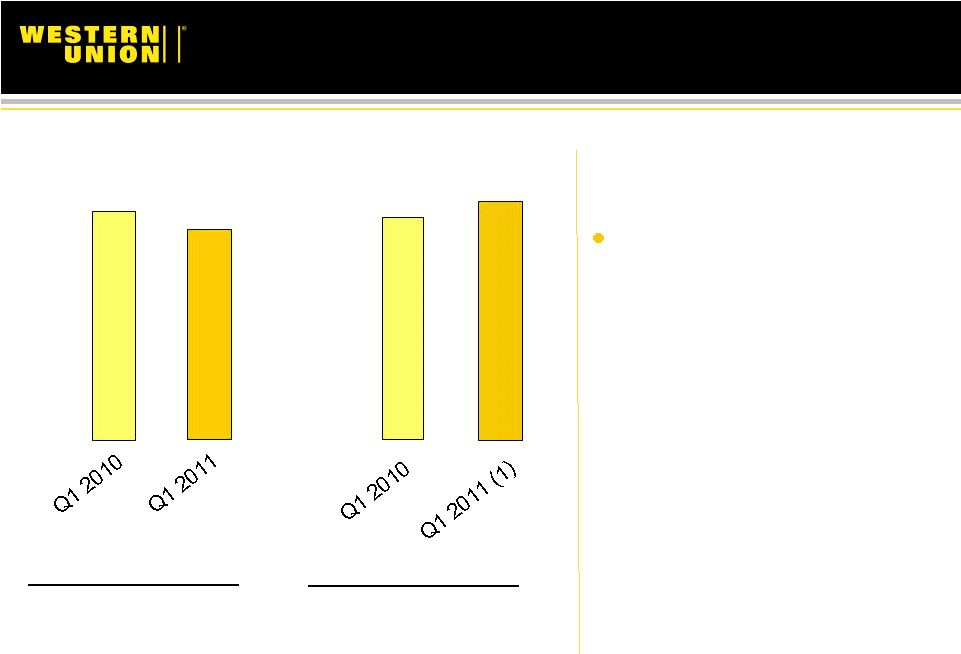
 C2C
Remittance Trends 10
+7%
C2C Transactions
(millions)
Note: See appendix for reconciliation of Non-GAAP to GAAP measures.
C2C Revenue growth 5%,
reported and constant currency
Total Q1 Western Union cross-
border principal of $17 billion
Increased 7% on a reported basis
Increased 6% constant currency
Principal per transaction
Increased 1% on a reported and
constant currency basis
50
53
Q1 2010
Q1 2011 |
 Consumer-to-Consumer
11
Revenue
Transactions
Q1 2011
2%
4%
Europe, Middle East, Africa, S. Asia
43% of Western Union revenue
Europe constant currency revenue trends similar to Q4
India grew revenue 8% and transactions 6%
Completed acquisition of super-agent, Angelo Costa, earlier this month
|
 12
Revenue
Transactions
Americas
6%
8%
32% of Western Union revenue
Domestic money transfer grew revenue 8% and transactions 21%
Mexico grew revenue and transactions 1%
Signed US Bank to account based money transfer
Q1 2011
Consumer-to-Consumer |
 13
Revenue
Transactions
Asia Pacific
14%
11%
9% of Western Union revenue
Many markets contributing to growth
China grew revenue 12% and transactions 5%
Signed China Construction Bank
Q1 2011
Consumer-to-Consumer |
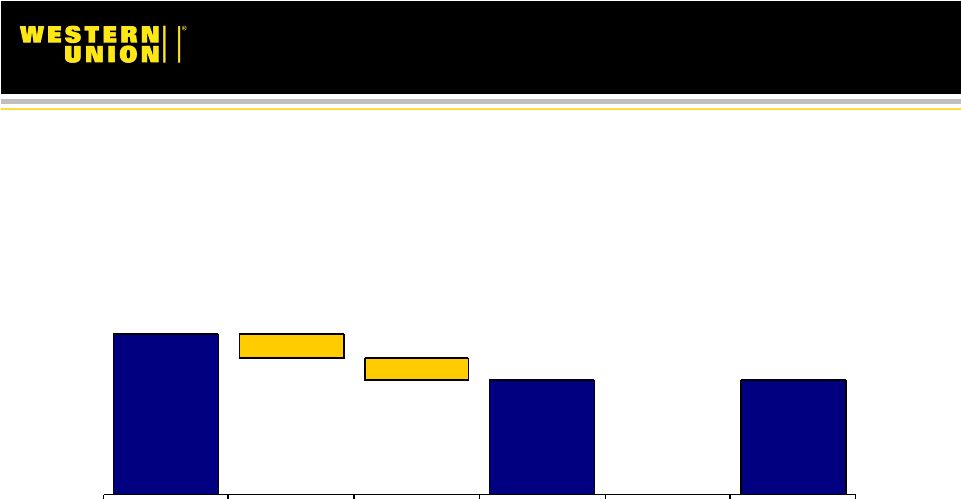 C2C
Transaction and Revenue Growth 14
Note: See appendix for reconciliation of Non-GAAP to GAAP measures.
+7%
+5%
+5%
Transaction
Growth
Price Reductions
Other Mix
Constant
Currency
Revenue Growth
Currency Impact
Reported
Revenue Growth
Q1 2011 |
 Global Business Payments
15
Revenue
Transactions
Global Business Payments
0%
8%
14% of Western Union revenue
Bill payments revenue decline moderated to -2%
Business Solutions grew revenue 13%
Q1 2011 |
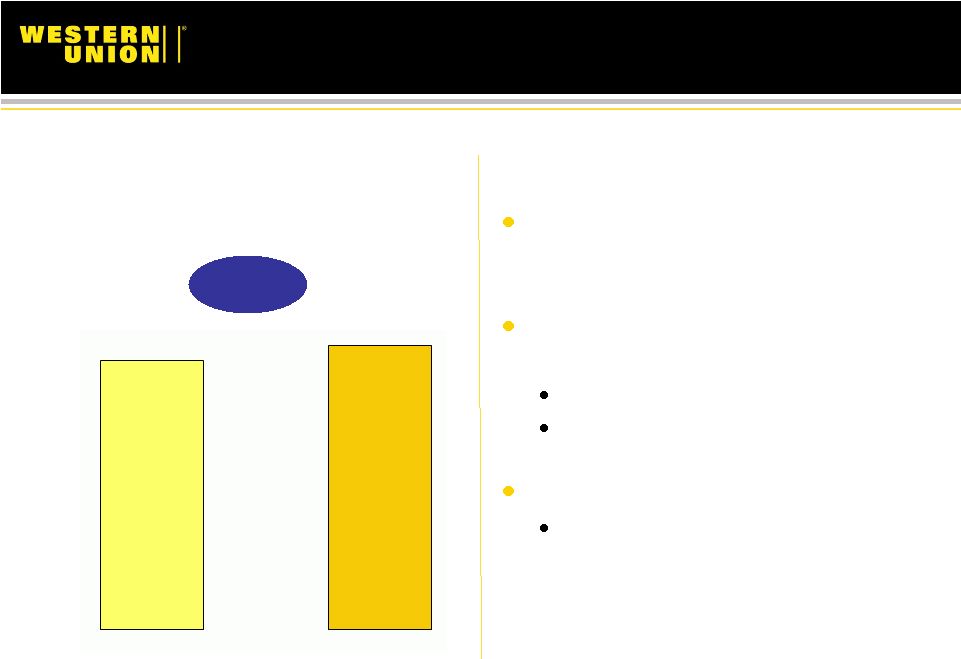
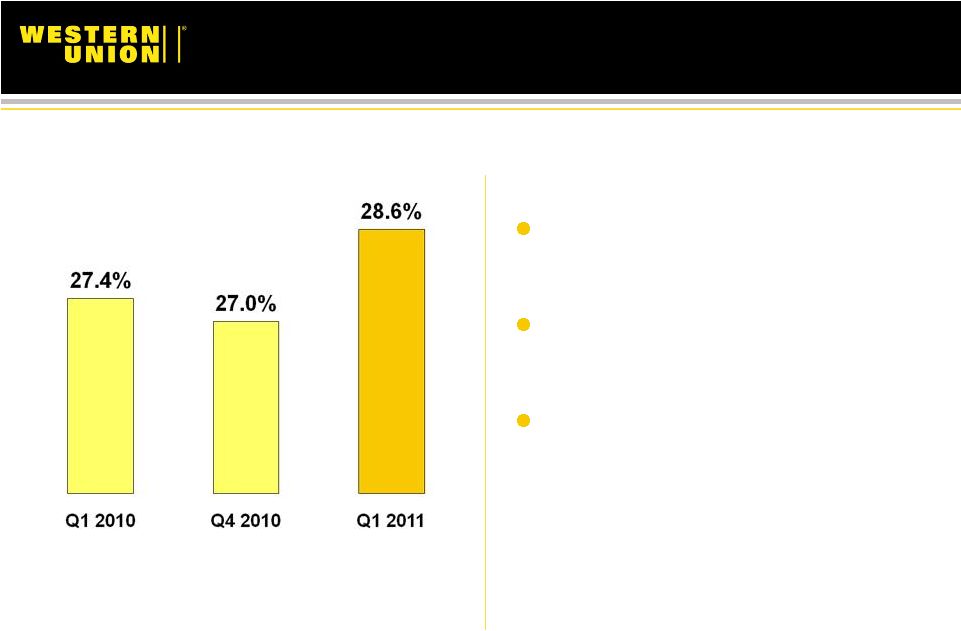
 16
Operating Margin –
Q1 2011
Note: See appendix for reconciliation of Non-GAAP to GAAP measures
GAAP
Excluding
Restructuring
(1)
Q1 2011 consolidated operating margin excludes restructuring charges
Operating margin excluding
restructuring, +70 basis points
•
Revenue leverage
•
Other efficiencies, including
restructuring savings
•
Negative foreign exchange
impact
•
Increased investment spending
25.6%
24.4%
25.6%
26.3% |
 17
C2C Operating Margin
C2C 84% of total company
revenue
Operating Margin +120 basis
points YoY
Improvement due to the same
factors as for consolidated
margin |
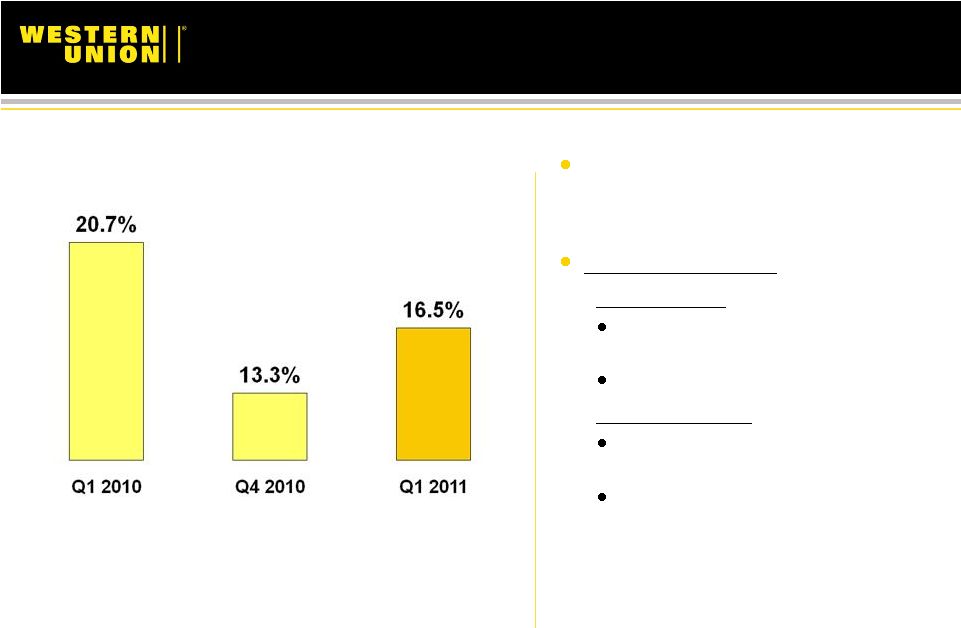 18
Global Business Payments
Operating Margin
GBP 14% of total company
revenue
Operating margin:
vs. Prior Year
Revenue declines and mix shifts in
U.S. bill payments
Investments in Business Solutions
vs. Prior Quarter
Lower integration expenses in
Business Solutions
Restructuring savings and other
cost structure changes in bill
payments |
 19
Financial Strength
Q1 2011
Cash Flow from Operations
$252 million
Capital Expenditures
$22 million
Stock Repurchases
$525 million
Dividends Paid
$45 million
Cash Balance, March 31, 2011
$2.2 billion
Debt Outstanding, March 31, 2011
$3.6 billion |
 2011
Outlook 20
Note: See appendix for reconciliation of Non-GAAP to GAAP measures.
Constant currency revenue in the range of 3% to 4%
GAAP revenue growth similar to constant currency
GAAP operating margin of approximately 26%
Operating margin of approximately 27%, excluding restructuring
charges
GAAP EPS of $1.41 to $1.46
EPS excluding restructuring charges of $1.47 to $1.52
GAAP cash flows from operating activities of $1.2 billion to $1.3 billion
|
 *
*
*
*
*
*
*
*
*
Questions & Answers |
 Appendix
First Quarter 2011 Earnings
Webcast & Conference Call
April 26, 2011
22 |
 Non-GAAP Measures
23
Western
Union's
management
believes
the
non-GAAP
measures
presented
provide
meaningful
supplemental
information
regarding
our
operating
results
to
assist
management,
investors,
analysts,
and
others
in
understanding
our
financial
results
and
to
better
analyze
trends
in
our
underlying
business,
because
they
provide
consistency
and
comparability
to
prior
periods.
These
non-GAAP
measurements
include
revenue
change
constant
currency
adjusted,
operating
income
margin
and
earnings
per
share
excluding
restructuring
expenses,
effective
tax
rate
excluding
restructuring
expenses,
consumer-to-consumer
segment
revenue
change
constant
currency
adjusted,
consumer-to-consumer
segment
principal
per
transaction
change
constant
currency
adjusted,
consumer-to-consumer
cross-border
principal
change
constant
currency
adjusted,
consumer-to-consumer
international
revenues
constant
currency
adjusted,
2011
earnings
per
share
outlook
excluding
restructuring
expenses,
and
2011
operating
income
margin
outlook
excluding
restructuring
expenses.
A
non-GAAP
financial
measure
should
not
be
considered
in
isolation
or
as
a
substitute
for
the
most
comparable
GAAP
financial
measure.
A
non-GAAP
financial
measure
reflects
an
additional
way
of
viewing
aspects
of
our
operations
that,
when
viewed
with
our
GAAP
results
and
the
reconciliation
to
the
corresponding
GAAP
financial
measure,
provide
a
more
complete
understanding
of
our
business.
Users
of
the
financial
statements
are
encouraged
to
review
our
financial
statements
and
publicly-filed
reports
in
their
entirety
and
not
to
rely
on
any
single
financial
measure.
A
reconciliation
of
non-GAAP
measures
to
the
most
directly
comparable
GAAP
financial
measures
is
included
below. |
 Reconciliation of Non-GAAP Measures
24
1Q10
2Q10
3Q10
4Q10
FY2010
1Q11
Consolidated Metrics
Revenues, as reported (GAAP)
1,232.7
$
1,273.4
$
1,329.6
$
1,357.0
$
5,192.7
$
1,283.0
$
Foreign currency translation impact (a)
(20.0)
16.1
22.2
18.5
36.8
2.3
Revenues, constant currency
adjusted 1,212.7
$
1,289.5
$
1,351.8
$
1,375.5
$
5,229.5
$
1,285.3
$
Prior year revenues, as reported (GAAP)
1,201.2
$
1,254.3
$
1,314.1
$
1,314.0
$
5,083.6
$
1,232.7
$
Revenue change, as reported (GAAP)
3
%
2
%
1
%
3
%
2
%
4
%
Revenue change, constant currency adjusted
1
%
3
%
3
%
5
%
3
%
4
%
Operating income, as reported (GAAP)
315.8
$
311.0
$
351.2
$
322.1
$
1,300.1
$
312.9
$
Reversal of restructuring and related expenses (b)
N/A
34.5
14.0
11.0
59.5
24.0
Operating income, excluding
restructuring 315.8
$
345.5
$
365.2
$
333.1
$
1,359.6
$
336.9
$
Operating income margin, as reported (GAAP)
25.6
%
24.4
%
26.4
%
23.7
%
25.0
%
24.4
%
Operating income margin, excluding restructuring
N/A
27.1
%
27.5
%
24.5
%
26.2
%
26.3
%
Effective tax rate, as reported (GAAP)
24.7
%
18.8
%
22.7
%
15.9
%
20.5
%
23.5
%
Impact from restructuring expenses, net of income tax benefit (b)
N/A
1.9
%
0.5
%
0.6
%
0.7
%
0.6
%
Effective tax rate, restructuring adjusted
24.7
%
20.7
%
23.2
%
16.5
%
21.2
%
24.1
%
Net income, as reported (GAAP)
207.9
$
221.0
$
238.4
$
242.6
$
909.9
$
210.2
$
Foreign currency translation impact, net of income tax (a)
(0.7)
5.5
2.4
1.4
8.6
4.8
Reversal of restructuring and
related expenses, including foreign currency translation impacts, net of income tax benefit (b)
N/A
22.4
9.5
6.4
38.3
16.4
Net income, constant currency and
restructuring adjusted 207.2
$
248.9
$
250.3
$
250.4
$
956.8
$
231.4
$
Diluted earnings per share ("EPS"), as reported (GAAP)
($ - dollars) 0.30
$
0.33
$
0.36
$
0.37
$
1.36
$
0.32
$
Impact from restructuring and related expenses, net
of income tax benefit (b) ($ - dollars) N/A
0.03
0.01
0.01
0.06
0.03
Diluted EPS, restructuring adjusted ($ -
dollars) 0.30
$
0.36
$
0.37
$
0.38
$
1.42
$
0.35
$
Foreign currency translation impact, net of income
tax (a) ($ - dollars) -
0.01
0.01
-
0.01
-
Diluted EPS, constant currency and
restructuring adjusted ($ - dollars) 0.30
$
0.37
$
0.38
$
0.38
$
1.43
$
0.35
$
Diluted weighted-average shares
outstanding 684.2
671.6
661.3
658.4
668.9
652.1
|
 Reconciliation of Non-GAAP Measures
25
1Q10
2Q10
3Q10
4Q10
FY2010
1Q11
Consumer-to-Consumer Segment
Revenues, as reported (GAAP)
1,030.2
$
1,073.1
$
1,128.3
$
1,151.8
$
4,383.4
$
1,078.1
$
Foreign currency translation impact (a)
(21.9)
15.0
21.2
18.0
32.3
2.2
Revenues, constant currency
adjusted 1,008.3
$
1,088.1
$
1,149.5
$
1,169.8
$
4,415.7
$
1,080.3
$
Prior year revenues, as reported (GAAP)
1,003.7
$
1,065.5
$
1,117.8
$
1,113.7
$
4,300.7
$
1,030.2
$
Revenue change, as reported (GAAP)
3
%
1
%
1
%
3
%
2
%
5
%
Revenue change, constant currency adjusted
0
%
2
%
3
%
5
%
3
%
5
%
Principal per transaction, as reported ($ - dollars)
357
$
351
$
355
$
356
$
355
$
360
$
Foreign currency translation impact (a) ($
- dollars) (11)
2
7
5
1
(1)
Principal per transaction, constant currency adjusted ($ -
dollars) 346
$
353
$
362
$
361
$
356
$
359
$
Prior year principal per transaction, as
reported ($ - dollars) 358
$
358
$
371
$
365
$
363
$
357
$
Principal per transaction change, as
reported 0
%
(2)%
(4)%
(3)%
(2)%
1
%
Principal per transaction change, constant currency adjusted
(3)%
(2)%
(3)%
(1)%
(2)%
1
%
Cross-border principal, as reported ($ - billions)
16.1
$
16.8
$
17.6
$
18.1
$
68.6
$
17.1
$
Foreign currency translation impact (a) ($ -
billions) (0.5)
0.1
0.4
0.3
0.3
-
Cross-border principal,
constant currency adjusted ($ - billions) 15.6
$
16.9
$
18.0
$
18.4
$
68.9
$
17.1
$
Prior year cross-border principal, as reported
($ - billions) 15.0
$
15.9
$
17.0
$
17.1
$
65.0
$
16.1
$
Cross-border principal change, as reported
7
%
6
%
4
%
6
%
6
%
7
%
Cross-border principal change, constant currency adjusted
4
%
7
%
6
%
7
%
6
%
6
%
International revenues, as reported (GAAP)
862.0
$
890.8
$
944.0
$
972.4
$
3,669.2
$
901.7
$
Foreign currency translation impact (a)
(20.8)
15.7
21.7
18.4
35.0
2.6
International revenues, constant
currency adjusted 841.2
$
906.5
$
965.7
$
990.8
$
3,704.2
$
904.3
$
Prior year international revenues, as reported (GAAP)
814.8
$
875.0
$
926.5
$
943.4
$
3,559.7
$
862.0
$
International revenue change, as reported (GAAP)
6
%
2
%
2
%
3
%
3
%
5
%
International revenue change, constant currency adjusted
3
%
4
%
4
%
5
%
4
%
5
% |
 Reconciliation of Non-GAAP Measures
26
2011 EPS Outlook
EPS guidance (GAAP) ($ - dollars)
1.41
$
1.46
$
Impact from restructuring and related expenses, net of income tax
benefit (b) ($ - dollars) 0.06
0.06
EPS guidance, restructuring adjusted ($ -
dollars) 1.47
$
1.52
$
2011 Operating Income Margin Outlook
Operating income margin (GAAP)
26.0
%
Impact from restructuring and related expenses (b)
1.0
%
Operating income margin, restructuring adjusted
27.0
%
Range |
 Footnote explanations
27
a)
Represents
the
impact
from
the
fluctuation
in
exchange
rates
between
all
foreign
currency
denominated
amounts
and
the
United
States
dollar.
Constant
currency
results
exclude
any
benefit
or
loss
caused
by
foreign
exchange
fluctuations
between
foreign
currencies
and
the
United
States
dollar,
net
of
foreign
currency
hedges,
which
would
not
have
occurred
if
there
had
been
a
constant
exchange
rate.
In
addition,
to
compute
constant
currency
earnings
per
share,
the
Company
assumes
the
impact
of
fluctuations
in
foreign
currency
derivatives
not
designated
as
hedges
and
the
portion
of
fair
value
that
is
excluded
from
the
measure
of
effectiveness
for
those
contracts
designated
as
hedges
was
consistent
with
the
prior
year.
b)
Restructuring
and
related
expenses
consist
of
direct
and
incremental
expenses
including
the
impact
from
fluctuations
in
exchange
rates
associated
with
restructuring
and
related
activities,
consisting
of
severance,
outplacement
and
other
related
benefits;
facility
closure
and
migration
of
the
Company's
IT
infrastructure;
and
other
expenses
related
to
the
relocation
of
various
operations
to
new
or
existing
Company
facilities
and
third-party
providers,
including
hiring,
training,
relocation,
travel,
and
professional
fees.
Also
included
in
the
facility
closure
expenses
are
non-cash
expenses
related
to
fixed
asset
and
leasehold
improvement
write-offs
and
the
acceleration
of
depreciation
and
amortization.
Restructuring
and
related
expenses
were
not
allocated
to
the
segments. |