Attached files
| file | filename |
|---|---|
| 8-K - TAIWAN FUND INC | v219159_8-k.htm |
|
THE TAIWAN FUND, INC. (THE ‘FUND’)
MONTHLY INSIGHT
|
|
|
AT MARCH 31, 2011
|
|
IN BRIEF
|
||||||||
|
Net asset value per share
|
US$20.33 | |||||||
|
Market price
|
US$18.67 | |||||||
|
Premium/(discount)
|
(8.17 | %) | ||||||
|
Fund size
|
US$377.5m | |||||||
|
Source: State Street Fund Bank and Trust Company.
|
||||||||
|
At March 31, 2011
|
US$ return
|
|||||||
|
Fund*
|
TAIEX Index†
|
|||||||
|
%
|
%
|
|||||||
|
One month
|
3.7 | 2.1 | ||||||
|
Three months
|
(2.5 | ) | (4.1 | ) | ||||
|
One year
|
28.0 | 22.7 | ||||||
|
Three years % pa
|
2.3 | 5.6 | ||||||
|
Past performance is not a guide to future returns.
|
||||||||
|
Returns are annualized, except for periods of less
|
||||||||
|
than one year.
|
||||||||
|
*Source: State Street Bank and Trust Company.
|
||||||||
|
NAV performance.
|
||||||||
|
†Source for index data: TWSE.
|
||||||||
SHANGHAI TEAM

The Martin Currie Shanghai Team
MANAGER’S COMMENTARY
That seemed like a very long month. The Tohoku earthquake and tsunami on March 11, 2011, and the nuclear meltdown that followed, hit the Taiwanese stockmarket particularly hard, as investors struggled to work out the implications of the catastrophe for the island’s large technology sector. Taiwan has close links with Japanese suppliers of advanced materials and components (Japan accounts for 29% of Taiwan’s total imports), making it vulnerable to disruption there. The market staged an impressive recovery, however, to gain 2.1% for the month as panic subsided and news of the supply chain’s gradual recovery came through. The Fund did better, up 3.7%, thanks to its relatively low exposure to the technology sector.
Among the Japanese companies in difficulty because of damaged facilities, restricted power supply or missing labor were Mitsubishi Gas Chemical, which accounts for 50% of global supply of BT resin (the material for the smartphone IC substrate) and Shin-Etsu, which accounts for 20% of global supply of 12” silicon wafers. This hit Taiwan’s IT industry, already under pressure from the iPad’s assault on the traditional PC industry and rising costs at its mainland assembly plants. The automotive sector was another area still trying to assess the impact from disruptions at Toyota, Honda and, especially, Nissan. Although share prices have rebounded, it remains to be seen whether supply chains can be restored before inventories are exhausted over the next month. The events also raise longer-term questions about the viability of just-in-time systems and encourage a return to a wider sourcing of parts. Some Taiwanese companies stand to benefit from the events as substitutes for Japanese suppliers.
We saw the first shot in President Ma Ying-jeou’s campaign to win re-election next January or March, with a proposed luxury tax. As well as the safe target of yachts, expensive cars and imported furniture (to show that President Ma is not on the side of the fat cats), this measure mainly takes aim at property speculation, levying 15% of transaction value on property held for less than one year and 10% for less than two years. This has cast a temporary chill on market volumes and caused a sharp correction in property stocks. But by its introduction in July, it will be a fact of life and probably seen as sensible, given the affordability problems for people working in Taipei. The government also aims to raise the tax levied on retained earnings from 10% to 15%. This will improve the dividend yield on the market even further and, at the margin, boost consumption.
Seen from outside, it is difficult to explain why Ma’s re-election should still be in any doubt, given good economic growth, falling unemployment, a reduction in income and inheritance tax, progress in transport infrastructure and decent asset markets, but such it is. The danger is that the economically beneficial improvement in cross-strait links is slowed to avoid accusations that Ma is China’s man.
After the month-end, the island’s central bank increased the re-discount rate for the fourth time since June 2010, albeit by just 25 basis points to 1.75%, although inflation remains quiescent (CPI 1.4% in February). The NT dollar broke the NT$29/US$ barrier, outperforming the yuan.
MONTHLY INSIGHT
INVESTMENT STRATEGY
The Fund is 97.1% invested with holdings in 58 companies.
Stock exchange figures show that at present 79% of all foreign portfolio investment in Taiwanese stocks is in the technology and telecom sectors, and 41.6% is in just seven technology names (TSMC, HTC, Hon Hai, Delta, Mediatek, ASE and TPK). The Fund’s exposure to the electronics sector is just 25.6%, and of these popular stocks, we hold only a modest position in Taiwan Semiconductor, the world’s leading IC fabricator.
In the post-earthquake panic, we added to existing positions in Clevo (3C superstores in China), Taiflex Scientific (flexible PCBs for smartphones) and Farglory FTZ Investment Holding (provider of warehouse services). On the pullback in property names because of the luxury tax we added King’s Town Construction (property in Kaohsiung), Ruentex Development (which also happens to have a stake in RT-Mart, China’s leading hypermarket operator, which will list in Hong Kong soon) and Hung Poo Real Estate. The strength in building materials on both sides of the straits encouraged us to buy leading ready-mixed-concrete supplier Goldsun Development & Construction. We also added to the position in Yuanta Financial, which after the month’s close made an agreed bid for Polaris Securities. This will cement its position as Taiwan’s leading broker, with a market share of 15.5%.
To fund these purchases, we sold Apple cable-maker Longwell and reduced our holdings in autolight exporter Depo and nylon maker Li Peng, all of whose margins are seeing pressure from rising material costs and currency appreciation. We also took some profits on China Steel Chemical (boosted by high oil prices), Far EasTone (high-yielding mobile operator but limited growth potential) and MPI (which might be hurt by the disruption to the IT industry).
Chris Ruffle, Martin Currie Inc*
*Martin Currie Ltd and Heartland Capital Management Ltd (HCML) have established MC China Ltd (MCCL), as a joint venture company, to provide investment management or investment advisory services to the range of China investment products managed by Martin Currie.
MCCL has appointed Martin Currie Investment Management Ltd (MCIM), or its affiliates, as investment manager of Martin Currie’s China investment products. HCML has seconded both Chris Ruffle and Shifeng Ke to MCIM, or its affiliates, on a full time basis with the same roles and responsibilities as if they were full time employees.
Martin Currie Inc took over management of the Fund on May 8, 2010.
|
FUND DETAILS
|
||||
|
March 31, 2011
|
||||
|
Market cap
|
$ | US346.8m | ||
|
Shares outstanding
|
18,575,214 | |||
|
Exchange listed
|
NYSE
|
|||
|
Listing date
|
1986 | |||
|
Investment manager
|
Martin Currie Inc | |||
|
Source: State Street Bank and Trust Company.
|
||||
|
PERFORMANCE
|
(US$ RETURNS)
|
|||||||
|
(US$ returns)
|
NAV %
|
Market price %
|
||||||
|
One month
|
3.7 | 4.4 | ||||||
|
Three months
|
(2.5 | ) | (3.0 | ) | ||||
|
Three years % pa
|
2.3 | 1.0 | ||||||
|
Past performance is not a guide to future returns. Returns are annualized, except for
|
||||||||
|
periods of less than one year.
|
||||||||
|
Source: State Street Bank and Trust Company.
|
||||||||
|
SECTOR ALLOCATION
|
||||||||
|
Fund %*
|
Benchmark %†
|
|||||||
|
Electronics
|
25.6 | 51.0 | ||||||
|
Finance
|
16.6 | 13.3 | ||||||
|
Wholesale and retail
|
13.2 | 5.5 | ||||||
|
Plastics
|
8.0 | 9.5 | ||||||
|
Construction
|
7.6 | 1.7 | ||||||
|
Textiles
|
3.7 | 2.0 | ||||||
|
Foods
|
3.7 | 1.6 | ||||||
|
Healthcare
|
3.7 | — | ||||||
|
Electric and machinery
|
3.1 | 1.2 | ||||||
|
Steel and iron
|
3.1 | 3.0 | ||||||
|
Transportation
|
2.3 | 2.4 | ||||||
|
Chemicals
|
2.1 | 2.1 | ||||||
|
Rubber
|
2.1 | 1.3 | ||||||
|
Others
|
1.6 | 1.8 | ||||||
|
Cement
|
0.7 | 1.2 | ||||||
|
Automobile
|
— | 0.9 | ||||||
|
Electrical appliance & cable
|
— | 0.5 | ||||||
|
Glass and ceramics
|
— | 0.4 | ||||||
|
Tourism
|
— | 0.3 | ||||||
|
Paper and pulp
|
— | 0.3 | ||||||
|
Other assets and liabilities
|
2.9 | — | ||||||
|
*Source: State Street Bank and Trust Company.
|
||||||||
|
†Source for index data: TWSE.
|
||||||||
|
15 LARGEST HOLDINGS
|
|||||
|
45.9% of holdings
|
Sector
|
% of net
|
|||
|
assets
|
|||||
|
China Petrochemical Development
|
Plastics
|
4.0 | |||
|
Far Eastern Department Stores
|
Wholesale and retail
|
3.7 | |||
|
Chinatrust Financial Holding
|
Finance
|
3.6 | |||
|
Wah Lee Industrial
|
Electronics
|
3.5 | |||
|
Clevo
|
Electronics
|
3.4 | |||
|
President Chain Store
|
Wholesale and retail
|
3.3 | |||
|
SinoPac Financial Holdings
|
Finance
|
3.2 | |||
|
Tung Ho Steel Enterprise
|
Steel and iron
|
3.1 | |||
|
Yuanta Financial Holding
|
Finance
|
3.0 | |||
|
KGI Securities
|
Finance
|
2.7 | |||
|
Synnex Technology International
|
Electronics
|
2.6 | |||
|
Fubon Financial Holding
|
Finance
|
2.6 | |||
|
Nan Ya Plastics
|
Plastics
|
2.5 | |||
|
Uni-President Enterprises
|
Foods
|
2.4 | |||
|
Powercom
|
Electronics
|
2.3 | |||
|
*Source: State Street Bank and Trust Company.
|
|||||
|
PERFORMANCE
|
(US$ returns at March 31, 2011)
|
|||||||||||||||||||||||||||||||
|
One month
|
Three months
|
Calendar year
|
One year
|
Three years
|
Five years
|
Ten years
|
Since launch
|
|||||||||||||||||||||||||
|
%
|
%
|
to date
|
%
|
% pa
|
% pa
|
% pa
|
% pa
|
|||||||||||||||||||||||||
|
%
|
||||||||||||||||||||||||||||||||
|
The Taiwan Fund, Inc
|
3.7 | (2.5 | ) | (2.5 | ) | 28.0 | 2.3 | 7.2 | 5.6 | 9.7 | ||||||||||||||||||||||
|
TAIEX Index
|
2.1 | (4.1 | ) | (4.1 | ) | 18.4 | 1.5 | 7.7 | 5.3 | 9.6 | ||||||||||||||||||||||
|
TAIEX Total Return Index
|
2.1 | (4.1 | ) | (4.1 | ) | 22.7 | 5.6 | 11.9 |
na
|
na
|
||||||||||||||||||||||
|
MSCI Taiwan Index
|
1.7 | (4.3 | ) | (4.3 | ) | 22.2 | 2.9 | 8.1 | 6.0 |
na
|
||||||||||||||||||||||
Past performance is not a guide to future returns. Source: State Street Bank and Trust Company. Launch date December 23, 1986. Returns for the Fund are historical total returns that reflect changes in net asset value per share during each period and assume that dividends and capital gains, if any, were reinvested. Returns are annualized, except for periods of less than one year.
Source for index data: MSCI for the MSCI Taiwan Index and TWSE for the TAIEX Total Return Index and the TAIEX Index. For a full description of each index please see the index descriptions section.
Returns for the TAIEX Index are not total returns and reflect only changes in the share price but do not assume that cash dividends, if any, were reinvested, and thus are not strictly comparable to the Fund returns.
The TAIEX Total Return Index commenced January 1, 2003.
MONTHLY INSIGHT
|
PORTFOLIO IN FULL
|
||||||||
|
Company
|
% of
|
|||||||
|
Sector
|
(BGB ticker)
|
Price
|
Holding
|
Value US$
|
net assets
|
|||
|
ELECTRONICS
|
25.6
|
|||||||
|
Wah Lee Industrial
|
3010
|
TT
|
NT$58.0
|
6,644,000
|
$13,104,314
|
3.5
|
||
|
Clevo
|
2362
|
TT
|
NT$59.6
|
6,288,000
|
$12,744,284
|
3.4
|
||
|
Synnex Technology International
|
2347
|
TT
|
NT$68.6
|
4,238,544
|
$9,887,750
|
2.6
|
||
|
Powercom
|
3043
|
TT
|
NT$67.5
|
3,801,000
|
$8,724,857
|
2.3
|
||
|
WT Microelectronics
|
3036
|
TT
|
NT$44.9
|
5,056,000
|
$7,719,871
|
2.0
|
||
|
Taiwan Semiconductor Manufacturing
|
2330
|
TT
|
NT$70.6
|
3,100,000
|
$7,442,572
|
2.0
|
||
|
Tatung
|
2371
|
TT
|
NT$6.8
|
26,073,000
|
$5,984,825
|
1.6
|
||
|
WPG Holdings
|
3702
|
TT
|
NT$49.5
|
2,947,725
|
$4,961,909
|
1.3
|
||
|
Aurora
|
2373
|
TT
|
NT$49.9
|
2,711,000
|
$4,595,696
|
1.2
|
||
|
MPI
|
6223
|
TT
|
NT$119.5
|
1,077,000
|
$4,376,634
|
1.1
|
||
|
Advantech
|
2395
|
TT
|
NT$91.0
|
1,341,000
|
$4,149,797
|
1.1
|
||
|
Taiwan Surface Mounting Technology
|
6278
|
TT
|
NT$69.8
|
1,632,000
|
$3,873,756
|
1.0
|
||
|
Chunghwa Telecom
|
2412
|
TT
|
NT$91.6
|
1,190,400
|
$3,708,046
|
1.0
|
||
|
Taiflex Scientific
|
8039
|
TT
|
NT$66.8
|
1,600,000
|
$3,634,571
|
1.0
|
||
|
CHIPBOND Technology
|
6147
|
TT
|
NT$42.9
|
1,316,000
|
$1,917,624
|
0.5
|
||
|
FINANCE
|
16.6
|
|||||||
|
Chinatrust Financial Holding
|
2891
|
TT
|
NT$25.0
|
16,067,000
|
$13,659,395
|
3.6
|
||
|
SinoPac Financial Holdings
|
2890
|
TT
|
NT$13.3
|
26,935,000
|
$12,136,390
|
3.2
|
||
|
Yuanta Financial Holding
|
2885
|
TT
|
NT$21.2
|
15,741,000
|
$11,321,379
|
3.0
|
||
|
KGI Securities
|
6008
|
TT
|
NT$14.1
|
20,740,000
|
$9,944,536
|
2.7
|
||
|
Fubon Financial Holding
|
2881
|
TT
|
NT$39.1
|
7,349,624
|
$9,759,843
|
2.6
|
||
|
China Life Insurance
|
2823
|
TT
|
NT$29.7
|
4,191,254
|
$4,233,086
|
1.1
|
||
|
Union Bank of Taiwan
|
2838
|
TT
|
NT$10.4
|
4,408,000
|
$1,558,948
|
0.4
|
||
|
WHOLESALE AND RETAIL
|
13.2
|
|||||||
|
Far Eastern Department Stores
|
2903
|
TT
|
NT$46.5
|
8,794,500
|
$13,891,641
|
3.7
|
||
|
President Chain Store
|
2912
|
TT
|
NT$130.5
|
2,840,000
|
$12,603,336
|
3.3
|
||
|
Test-Rite International
|
2908
|
TT
|
NT$22.6
|
10,622,000
|
$8,145,346
|
2.2
|
||
|
PC Home Online
|
8044
|
TT
|
NT$181.5
|
922,125
|
$5,691,452
|
1.5
|
||
|
Mercuries & Associates
|
2905
|
TT
|
NT$21.5
|
6,680,100
|
$4,884,027
|
1.3
|
||
|
Taiwan Tea
|
2913
|
TT
|
NT$16.9
|
8,231,000
|
$4,716,384
|
1.2
|
||
|
PLASTICS
|
8.0
|
|||||||
|
China Petrochemical Development
|
1314
|
TT
|
NT$37.5
|
11,711,000
|
$14,914,286
|
4.0
|
||
|
Nan Ya Plastics
|
1303
|
TT
|
NT$86.7
|
3,217,000
|
$9,484,770
|
2.5
|
||
|
Yem Chio
|
4306
|
TT
|
NT$29.2
|
5,701,316
|
$5,661,280
|
1.5
|
||
|
CONSTRUCTION
|
7.6
|
|||||||
|
Ruentex Development
|
9945
|
TT
|
NT$47.8
|
3,829,000
|
$6,224,005
|
1.7
|
||
|
Prince Housing & Development
|
2511
|
TT
|
NT$17.8
|
9,899,760
|
$5,975,575
|
1.6
|
||
|
Hung Poo Real Estate Development
|
2536
|
TT
|
NT$34.9
|
4,482,000
|
$5,311,672
|
1.4
|
||
|
Taiwan Land Development
|
2841
|
TT
|
NT$14.5
|
7,142,183
|
$3,521,727
|
0.9
|
||
|
King’s Town Construction
|
2524
|
TT
|
NT$28.6
|
3,453,000
|
$3,352,427
|
0.9
|
||
|
Continental Holdings
|
3703
|
TT
|
NT$12.3
|
7,468,000
|
$3,123,677
|
0.8
|
||
|
Good Friend International Holdings
|
2398
|
TT
|
NT$26.9
|
825,000
|
$753,277
|
0.2
|
||
|
Goldsun Development & Construction
|
2504
|
TT
|
NT$13.0
|
1,167,000
|
$513,922
|
0.1
|
||
|
TEXTILES
|
3.7
|
|||||||
|
Li Peng Enterprise
|
1447
|
TT
|
NT$14.8
|
9,716,000
|
$4,889,966
|
1.3
|
||
|
Far Eastern New Century
|
1402
|
TT
|
NT$45.5
|
3,121,200
|
$4,824,054
|
1.3
|
||
|
Makalot Industrial
|
1477
|
TT
|
NT$69.0
|
1,828,000
|
$4,289,256
|
1.1
|
|
Company
|
% of
|
|||||||
|
Sector
|
(BGB ticker)
|
Price
|
Holding
|
Value US$
|
net assets
|
|||
|
FOODS
|
3.7
|
|||||||
|
Uni-President Enterprises
|
1216
|
TT
|
NT$40.3
|
6,600,000
|
$9,044,939
|
2.4
|
||
|
Lien Hwa Industrial
|
1229
|
TT
|
NT$20.5
|
4,815,000
|
$3,356,656
|
0.9
|
||
|
Gourmet Master
|
2723
|
TT
|
NT$229.0
|
204,000
|
$1,588,628
|
0.4
|
||
|
HEALTHCARE
|
3.7
|
|||||||
|
ST Shine Optical
|
1565
|
TT
|
NT$362.0
|
392,000
|
$4,825,600
|
1.3
|
||
|
Excelsior Medical
|
4104
|
TT
|
NT$88.5
|
1,507,729
|
$4,537,569
|
1.2
|
||
|
Pacific Hospital Supply
|
4126
|
TT
|
NT$119.0
|
1,099,948
|
$4,451,186
|
1.2
|
||
|
ELECTRIC AND MACHINERY
|
3.1
|
|||||||
|
Yungtay Engineering
|
1507
|
TT
|
NT$46.3
|
3,274,000
|
$5,154,854
|
1.4
|
||
|
Depo Auto Parts Industrial
|
6605
|
TT
|
NT$71.9
|
1,570,000
|
$3,838,709
|
1.0
|
||
|
Awea Mechantronic
|
1530
|
TT
|
NT$34.5
|
2,204,000
|
$2,585,755
|
0.7
|
||
|
STEEL AND IRON
|
3.1
|
|||||||
|
Tung Ho Steel Enterprise
|
2006
|
TT
|
NT$34.2
|
10,099,000
|
$11,728,048
|
3.1
|
||
|
TRANSPORTATION
|
2.3
|
|||||||
|
Farglory F T Z Investment Holding
|
5607
|
TT
|
NT$30.0
|
6,540,000
|
$6,671,994
|
1.8
|
||
|
Taiwan High Speed Rail
|
2633
|
TT
|
NT$5.8
|
9,275,715
|
$1,813,727
|
0.5
|
||
|
CHEMICALS
|
2.1
|
|||||||
|
China Steel Chemical
|
1723
|
TT
|
NT$157.0
|
1,510,000
|
$8,061,823
|
2.1
|
||
|
RUBBER
|
2.1
|
|||||||
|
TSRC
|
2103
|
TT
|
NT$75.5
|
3,057,000
|
$7,848,724
|
2.1
|
||
|
OTHERS
|
1.6
|
|||||||
|
Globe Union Industrial
|
9934
|
TT
|
NT$35.1
|
5,128,000
|
$6,120,851
|
1.6
|
||
|
CEMENT
|
0.7
|
|||||||
|
Wei Mon Industry
|
8925
|
TT
|
NT$18.4
|
4,204,296
|
$2,630,679
|
0.7
|
||
|
OTHER ASSETS AND LIABILITIES
|
$11,074,840
|
2.9
|
MONTHLY INSIGHT
THE TAIWAN FUND, INC. PREMIUM/DISCOUNT
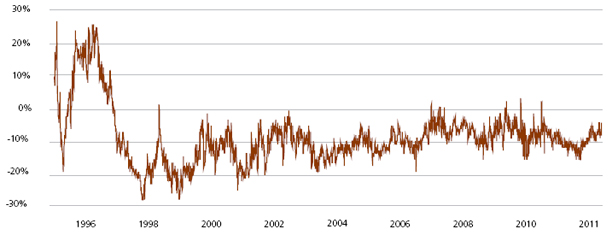
Source: State Street Bank and Trust Company as of January 31, 2011.
INDEX DESCRIPTIONS
MSCI Taiwan Index
The MSCI Total Return Taiwan Index is a free-float adjusted market capitalization index. The index represents Taiwanese companies that are available to investors worldwide. The Index has a base date of December 31, 1987. As of June 24, 2010 it contained 117 constituents.
TAIEX Index
The TWSE, or TAIEX Index is a capitalization-weighted index of all listed common shares traded on the Taiwan Stock Exchange. The index was based in 1966 and does not include re-invested dividends.
TAIEX Total Return Index
The TAIEX Total Return Index is a capitalization-weighted index of all listed common shares traded on the Taiwan Stock Exchange, based in 1966, which includes re-invested dividends.
The Fund was launched on December 23, 1986 to allow US and other investors to access and participate in the growth of the economy and the stock market in Taiwan, the Republic of China. The Fund’s investment objective is to seek long-term capital appreciation primarily through investments in equity securities listed in Taiwan. The Fund is a diversified, closed-end management investment company listed on the New York Stock Exchange (NYSE) under the symbol ‘TWN’.
Taiwan, with its global market leadership in high technology goods and its significant investments throughout mainland China and Southeast Asian economies, is now an integral economic player in the Asia Pacific Region as well as around the world. Investing in Taiwan not only allows investors to capitalize on Taiwan’s dynamic economy, but also allows investors to reap the growth and investment potential of the mainland China and other emerging economies of the region.
CONTACTS
The Taiwan Fund, Inc.
c/o State Street Bank and Trust Company
2 Avenue de Lafayette
PO Box 5049
Boston, MA 02111
Tel: (1) 877-864-5056
www.thetaiwanfund.com
IMPORTANT INFORMATION
This document is issued and approved by Martin Currie Inc (MC Inc), as investment adviser of The Taiwan Fund, Inc. (the ‘Fund’). MC Inc is authorised and regulated by the Financial Services Authority (FSA) and incorporated under limited liability in New York, USA. Registered in Scotland (No BR2575), registered address Saltire Court, 20 Castle Terrace, Edinburgh, EH1 2ES. Information herein is believed to be reliable but has not been verified by MC Inc. MC Inc makes no representation or warranty and does not accept any responsibility in relation to such information or for opinion or conclusion which the reader may draw from this newsletter.
The Fund is classified as a diversified investment company under the US Investment Company Act of 1940 as amended. It meets the criteria of a closed ended US mutual fund and its shares are listed on the New York Stock Exchange. MC Inc has been appointed investment adviser to the Fund.
Investors are advised that they will not generally benefit from the rules and regulations of the United Kingdom Financial Services and Markets Act 2000 and the FSA for the protection of investors, nor benefit from the United Kingdom Financial Services Compensation Scheme, nor have access to the Financial Services Ombudsman in the event of a dispute. Investors will also have no rights of cancellation under the FSA’s Conduct of Business Sourcebook of the United Kingdom.
This newsletter does not constitute an offer of shares. MC Inc, its ultimate and intermediate holding companies, subsidiaries, affiliates, clients, directors or staff may, at any time, have a position in the market referred to herein, and may buy or sell securities, currencies, or any other financial instruments in such markets. The information or opinion expressed in this newsletter should not be construed to be a recommendation to buy or sell the securities, commodities, currencies or financial instruments referred to herein.
The information provided in this report should not be considered a recommendation to purchase or sell any particular security. There is no assurance that any securities discussed herein will remain in an account’s portfolio at the time you receive this report or that securities sold have not been repurchased.
It should not be assumed that any of the securities transactions or holdings discussed here were or will prove to be profitable, or that the investment recommendations or decisions we make in the future will be profitable or will equal the investment performance of the securities discussed herein.
Investing in the Fund involves certain considerations in addition to the risks normally associated with making investments in securities. The value of the shares issued by the Fund, and the income from them, may go down as well as up and there can be no assurance that upon sale, or otherwise, investors will receive back the amount originally invested. There can be no assurance that you will receive comparable performance returns, or that investments will reflect the performance of the stock examples contained in this document. Movements in foreign exchange rates may have a separate effect, unfavorable as well as favorable, on the gain or loss otherwise experienced on an investment. Past performance is not a guide to future returns. Accordingly, the Fund is only suitable for investment by investors who are able and willing to withstand the total loss of their investment. In particular, prospective investors should consider the following risks:
– it should be noted that investment in the Fund is only suitable for sophisticated investors who are aware of the risk of investing in Taiwan and should be regarded as long term. Funds which invest in one country carry a higher degree of risk than those with portfolios diversified across a number of markets.
– investment in the securities of smaller and unquoted companies can involve greater risk than is customarily associated with investment in larger, more established, companies. In particular, smaller companies often have limited product lines, markets or financial resources and their management may be dependent on a smaller number of key individuals. In addition, the market for stock in smaller companies is often less liquid than that for stock in larger companies, bringing with it potential difficulties in acquiring, valuing and disposing of such stock. Proper information for determining their value, or the risks to which they are exposed, may not be available.
– investments within emerging markets such as Taiwan can be of higher risk. Many emerging markets, and the companies quoted on their stock exchanges, are exposed to the risks of political, social and religious instability, expropriation of assets or nationalization, rapid rates of inflation, high interest rates, currency depreciation and fluctuations and changes in taxation which may affect the Fund’s income and the value of its investments.
– the marketability of quoted shares may be limited due to foreign investment restrictions, wide dealing spreads, exchange controls, foreign ownership restrictions, the restricted opening of stock exchanges and a narrow range of investors. Trading volume may be lower than on more developed stockmarkets, and equities are less liquid. Volatility of prices can also be greater than in more developed stockmarkets. The infrastructure for clearing, settlement and registration on the primary and secondary markets may be undeveloped. Under certain circumstances, there may be delays in settling transactions in some of the markets.

Martin Currie Inc, registered in Scotland (no BR2575)
Registered office: Saltire Court, 20 Castle Terrace, Edinburgh EH1 2ES
Tel: 44 (0) 131 229 5252 Fax: 44 (0) 131 228 5959 www.martincurrie.com
North American office: 1350 Avenue of the Americas, Suite 3010, New York, NY
10019, USA Tel: (1) 212 258 1900 Fax: (1) 212 258 1919
Authorised and registered by the Financial Services Authority and incorporated with
limited liability in New York, USA.
Please note: calls to the above numbers may be recorded.