Attached files
| file | filename |
|---|---|
| 8-K - SOMERSET HILLS BANCORP | c65411_8k.htm |
Ex 99.1

Annual Meeting of Stockholders
April 27, 2011

Forward-Looking Statements
2
This investor presentation contains certain forward-looking statements which are based on certain assumptions and describe future plans, strategies and expectations of the Company. These forward-looking statements are generally identified by use of the words “believe,” “expect,” “intend,” “anticipate,” “estimate,” “project,” or similar expressions. The Company’s ability to predict results or the actual effect of future plans or strategies is inherently uncertain. Factors which could have a material adverse effect on the operations of the Company and the subsidiaries include, but are not limited to, those set forth in the Company’s Form 10-k under the caption “Risk Factors” and changes in interest rates, general economic conditions, legislative/regulatory changes, monetary and fiscal policies of the U.S. Government, including policies of the U.S. Treasury and the Federal Reserve Board, the quality or composition of the loan or investment portfolios, demand for loan products, deposit flows, competition, demand for financial services in the Company’s market area and accounting principles and guidelines. These risks and uncertainties should be considered in evaluating forward-looking statements and undue reliance should not be placed on such statements. The Company does not undertake -- and specifically disclaims any obligation -- to publicly release the result of any revisions which may be made to any forward-looking statements to reflect events or circumstances after the date of such statements or to reflect the occurrence of anticipated or unanticipated events.

Company Profile
3
Commercial banking franchise in Northern NJ; founded in 1998
A relationship-based lender located in one of the Nation’s wealthiest regions
$329 million in assets at year-end 2010
Strong capital; tangible common equity ratio 12.0%
Sound asset quality; greater than 99.9% of all loans are performing
First quarter 2011 blended cost of deposits was 55 basis points
Record earnings in 2010, marking the 9th consecutive year of profitability
85% of deposits core; 25% noninterest-bearing demand
NASDAQ listed--Ticker: SOMH

Branch Network
4
Phil.

Valuable New Jersey Franchise
5
Superior asset quality
We rank #1 out of 28 in asset quality versus NJ Banks (see note)
Rank based on SOMH nonperforming asset ratio of 0.08% versus NJ average of 2.88%
Exceptional deposit mix
We rank #2 out of 28 in deposit mix
Rank based on SOMH core (non-CD) deposits percentage of 85% versus NJ average of 64%
Wealthy operating area
We rank #2 out of 28 in HH Income
Rank based on weighted avg. median HH Income in SOMH trade area of $99,000
versus NJ Bank Avg. of
$76,000 (National Avg. is $55,000)
Scarcity Value - very few banking franchises in the Nation possess all three of these attributes
Note: Rankings based on publicly traded commercial banks headquartered in New Jersey with total assets greater than $170 MM. All data obtained from SNL Financial as of December 31, 2010. Nonperforming asset ratio calculated as nonaccrual loans plus OREO divided by Total Assets.

Balance Sheet Trends
($ thousands, quarterly avg.)
6
Total Assets
Core
Deposits
Loans

Net Income Trend
($ thousands)
7
Strong Earnings Momentum

Profitability Ratios (Annual)
8

Profitability Ratios (1st
Quarter)
9
2010Q1
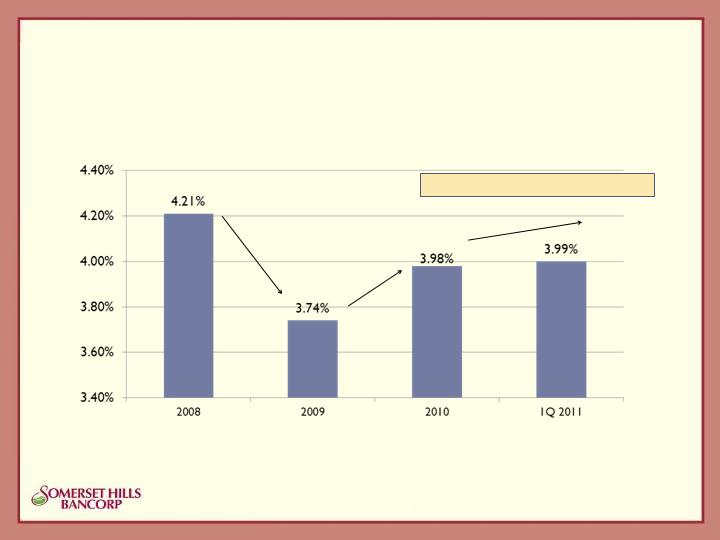
Net Interest Margin Trend
10
Reflects strategy to
increase liquidity
Unwinding of
strategy
Loan growth
Working our way back to 4.00%+

11
Operating Efficiency
($ millions)
Always determined to do
more with less

Capital Strength
12
An additional $4+
million of capital
is held at holding
company.
All regulatory capital ratios are more
than 500 bps in excess of well-
capitalized levels.

Credit Quality
13
Source: SNL Financial. Commercial banks between $100mm and $1billion in total assets. SNL’s definition of
nonperforming assets includes troubled
debt restructurings.
Somerset Hills Bank
Somerset Hills has significantly
less problem assets

Asset Quality-How Do We Do It?
14
Credit Culture
Conservative Strict Underwriting standards (Low LTV, Recourse, etc.)
Philosophy of “careful growth” since inception in 1998
Owner-occupied collateral - focusing on professionals (e.g., lawyers, accountants,
doctors)
Economic Strength of Operating Area
Our borrowers tend to have greater financial cushion than those in other regions
Better positioned, although not immune, to withstand economic downturn
We are NOT in the following businesses:
Indirect auto, credit cards, leasing, and SBA lending
Focus on Loan Monitoring and Collection
We continuously monitor borrower financial condition
Have always been aggressive collectors in all business cycles
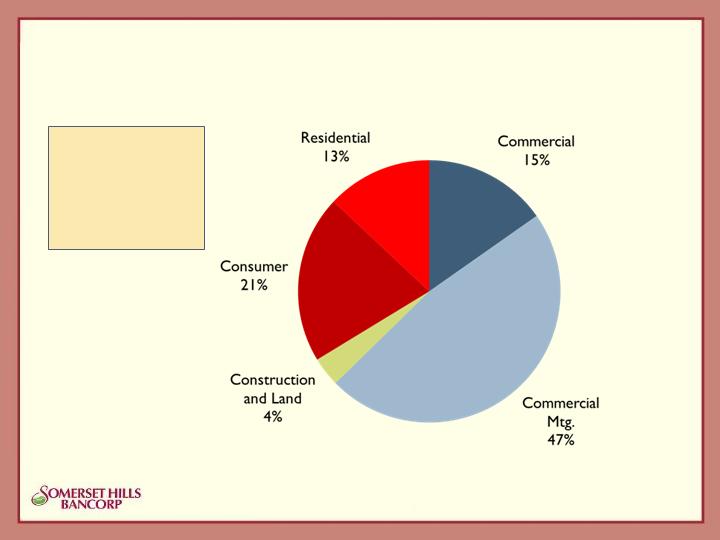
Loan Mix at Year-end 2010
15
Total Loan
Portfolio =
$207.1 million
Well-diversified
by Loan Type

Commercial Mortgage Portfolio
(information as of December 31, 2010)
16
Portfolio totals $98.2 million
We’ve never had a loss in this portfolio
100% of portfolio is secured by NJ properties
Diversified with $659,000 average exposure per loan
Average LTV at origination was 57%
Approximately 56% of portfolio is owner-occupied by local businesses
More than 90% of portfolio carries personal guarantees

Commercial Loan Portfolio
(information as of December 31, 2010)
17
Portfolio totals $31.6 million
No nonperforming loans
Average loan size of less than $200,000 reflecting a diverse local customer
base, with strong cross sell and referral opportunities
Virtually all commercial loans supported by personal guarantees and by
collateral including:
First- and second-liens on residential and/or commercial properties
Liquid assets, such as marketable securities
Other business assets including equipment, inventory and trade receivables

18
$42.9 million outstanding (98% Home Equity)
Historical charge-offs in home equity portfolio = ZERO
No nonaccrual loans
100% in State of NJ
Self-originated, individually underwritten in-house
We do not use automated underwriting models
Majority originated with a CLTV of 50% to 65%; maximum of 80%
85% of portfolio represented by home equity lines of credit, which are additionally
underwritten on a cash flow basis
Consumer Loan Portfolio
(information as of December 31, 2010)

Residential Mortgage Lending
(information as of December 31, 2010)
19
Residential portfolio totals $26.9 million
Primarily “accommodation” jumbos to local high net worth individuals
Avg. LTV of portfolio at origination is less than 50%
No nonaccrual or loans past-due 30 days or more
We have never had a loss in this portfolio
Sullivan Financial Services, Inc. (wholly-owned subsidiary)
Residential Mortgages sold on a flow basis, servicing released (i.e., fee-based model)
Efficient and scalable platform
Managed by mortgage banking veterans
Very low fixed cost of operations
Contributed 11% to consolidated net income in 2010.

Investment Portfolio at Year-end 2010
20
We have never taken an OTTI charge, largely due
to our
conservative investment philosophy
We avoid reaching for yield and stick to high
quality investments
Approximately 75% of the portfolio is guaranteed
by U.S. Gov’t/Agencies
The fair market value of our municipal securities
portfolio exceeds book value. It is a highly
granular portfolio comprised of 36 investments
(avg. $257,000) in regional municipalities.
Our corporate securities portfolio is relatively
small. All investments are rated A or higher.
The tax-equivalent yield is 4.37%, which is the
4th highest in NJ. The weighted
average re-
pricing interval is 4.4 years.

Liquidity
21
As a financial institution and, in particular, a community bank, we pay close
attention to liquidity management.
Currently, approximately 10% of the balance sheet ($30-$35 million) is held
at the Federal Reserve in an overnight position
We have substantial amounts of collateral, both securities and loans, held at
the FHLB and the Federal Reserve
At year-end 2010, we had $93.9 million additional borrowing capacity at the FHLB
At year-end 2010, we had $9.7 million additional borrowing capacity at the Federal
Reserve Discount Window.
We have an additional aggregate $13 million of unsecured Fed Funds
borrowing capacity from several large banks.

Positioned for Rising Interest Rates
22
We maintain a relatively large volume of overnight holdings
We have avoided reaching for yield in our securities portfolio
The duration of our loan portfolio is approximately 2 years
Our residential exposure (both securities and loans) remains low–approx. 17% of total assets
Approx. 50% of our loan portfolio re-prices in one year while only 20% re-prices in more
than 5 years.
Our strong capital and core deposit levels bode well for rising rates
33% of our earning assets are funded by capital and noninterest-bearing demand
The average ratio of NJ commercial banks is 20% (We rank #1)
These funds bear no interest cost to bank in any rate environment
54% of earning assets are funded by interest-bearing transaction deposits
We retain pricing control (subject to market conditions), but typically reprice at a much slower
pace than the general level of interest rates.
Note: #1 Rank based on publicly traded NJ banks with assets greater than $170 million. Data sourced from SNL Financial as of year-
end 2010.

Deposit Funding
23
Our business model relies almost exclusively on core and other local deposits
Core deposit (i.e., non-time) balances comprised 85% of total deposits, best in NJ
Relationship-driven commercial non-interest bearing demand accounts
Paramount account, an attractive interest-bearing checking account for retail customers and
not-for-profits
Escrow Ease trust accounts, servicing close to 100 Northern NJ law firms
Time deposits are raised through local branch marketing efforts only.
We do not accept brokered deposits
We rarely advertise
Average core deposits grew by 9.7% in 2010 from 2009, driven principally from:
Favorable economic conditions
Superior customer service
Strength and soundness of our bank, which we believe is well-known in our operating area

24
Deposit Mix Trends
($ thousands, annual averages)
Core Deposits have increased by 14.3% over the past two years.

Expense Control
25
($ thousands)
Increase/(Decrease)
2010
2009
Amount
Pct.
Occupancy
$ 1,664.9
$ 1,881.6
$ (216.7)
-11.5%
Printing, Stat & Supplies
133.2
186.0
(52.9)
-28.4%
Legal Fees
38.4
85.9
(47.5)
-55.3%
Correspondent Bank Fees
58.6
94.0
(35.4)
-37.6%
Audits and Exams
261.1
286.3
(25.2)
-8.8%
Telephone
68.9
92.7
(23.8)
-25.7%
Total Reductions
2,225.1
2,626.4
(401.4)
-15.3%
All Other Expenses
7,414.9
7,482.6
(67.6)
-0.9%
Total Operating Expense
$ 9,640.0
$ 10,109.0
$ (469.0)
-4.6%
Continued success in reducing overhead, with a focus on the following
areas:
More efficient use of office space and equipment
Reduced branch lease expense upon renewal
Reduced use of outside consultants and advisors
Negotiating better terms with vendors (and changing vendors, if necessary)

Technology
26
As a community bank, we generally do not implement cutting-edge
technology; however, we have the capability to deploy cost-effective
technology, whenever advantageous
We recently enhanced our debit card fraud detection systems.
We are the first community bank to implement Trusteer’s Rapport identity
protection product
Remote deposit capture for our commercial customers
Expands our geographic reach and provides immediate cost savings
Mobile “Text” Banking
The fastest growing delivery channel
Recently implemented first stage functionality with strong initial customer adoption.

27
Yesterday, we declared a quarterly cash dividend of 6 cents per share
Represents a dividend yield of 2.7% (assuming $8.75 share price)
We were one of just a handful of banks nationwide that raised its cash
dividend in 2010.
Our financial strength and performance bode well for potentially higher cash
dividends and additional stock dividends in future periods.
Dividends

28
We have a unique and valuable community banking franchise
We operate in one of the wealthiest regions in the Nation
Our asset quality metrics are among the best
We have a superior deposit mix
We are strongly capitalized
We are positioned well for a higher rate environment
Our staff is highly experienced
Each of our key executives, and a majority of our staff, has significant industry experience at both
large and community-based banks
We are patient and disciplined
Our track record speaks for itself
We will not force growth, but will rather maintain our strict underwriting standards
Shareholder value focused
We will be opportunistic regarding acquisition and merger of equals opportunities
We recognize that our franchise is valuable to larger banks in region
Summary
