Attached files

April 26, 2011
First Quarter 2011 Conference Call

2
Forward-Looking Statements
This presentation contains forward-looking statements within the meaning of Section 27A of the Securities Act of
1933 and Section 21E of the Securities Exchange Act of 1934. All such statements, other than statements of
historical fact, are “forward-looking statements” within the meaning of the Private Securities Litigation Reform Act of
1995, including, without limitation, any projections of financial items; projections of contracting services activity; future
production volumes, results of exploration, exploitation, development, acquisition and operations expenditures, and
prospective reserve levels of properties or wells; projections of utilization; any statements of the plans, strategies and
objectives of management for future operations; any statements concerning developments; and any statements of
assumptions underlying any of the foregoing. These statements involve certain assumptions we made based on our
experience and perception of historical trends, current conditions, expected future developments and other factors
we believe are reasonable and appropriate under the circumstances. The forward-looking statements are subject to
a number of known and unknown risks, uncertainties and other factors that could cause our actual results to differ
materially. The risks, uncertainties and assumptions referred to above include the performance of contracts by
suppliers, customers and partners; actions by governmental and regulatory authorities; operating hazards and
delays; employee management issues; local, national and worldwide economic conditions; uncertainties inherent in
the exploration for and development of oil and gas and in estimating reserves; complexities of global political and
economic developments; geologic risks, volatility of oil and gas prices and other risks described from time to time in
our reports filed with the Securities and Exchange Commission (“SEC”), including the Company’s most recently filed
Annual Report on Form 10-K and in the Company’s other filings with the SEC. Free copies of the reports can be
found at the SEC’s website, www.SEC.gov. You should not place undue reliance on these forward-looking
statements which speak only as of the date of this presentation and the associated press release. We assume no
obligation or duty and do not intend to update these forward-looking statements except as required by the securities
laws.
References to quantities of oil or gas include amounts we believe will ultimately be produced, and may include
“proved reserves” and quantities of oil or gas that are not yet classified as “proved reserves” under SEC definitions.
Statements of oil and gas reserves are estimates based on assumptions and may be imprecise. Investors are urged
to consider closely the disclosure regarding reserves in our most recently filed Annual Report on Form 10-K and any
subsequent Quarterly Reports on Form 10-Q.
3
Presentation Outline
• Executive Summary
Summary of Q1 2011 Results (pg. 4)
• Operational Highlights by Segment
Contracting Services (pg. 9)
Oil & Gas (pg. 16)
• Key Balance Sheet Metrics (pg. 19)
• 2011 Outlook (pg. 21)
• Non-GAAP Reconciliations (pg. 25)
• Questions & Answers

4
Executive
Summary
Summary

5
Executive Summary
(A) Included a $16.7 million non-cash charge to write off goodwill associated with our Southeast Asia well operations subsidiary in fourth quarter 2010.
(B) Included a $7.1 million deferred tax asset valuation allowance associated with our Southeast Asia well operations subsidiary in fourth quarter 2010.
(C) See non-GAAP reconciliations on slides 26-27.

6
Executive Summary
• Q1 2011 EPS of $0.24 per diluted share
• Balance sheet continues to improve
o Cash increased to $441 million at 3/31/2011 from $391 million at 12/31/2010
o Liquidity* increased to $837 million at 3/31/2011 from $787 million at 12/31/2010
o Net debt decreased to $916 million at 3/31/2011 from $967 million at 12/31/2010
• Contracting Services and Production Facilities
o Continuing strength in well intervention business in the Gulf of Mexico and North Sea
o Weak subsea construction and robotics market in the Gulf of Mexico reflecting regulatory impact
on drilling and development activity
on drilling and development activity
o Strong international robotics utilization
o Caesar spent the quarter in the shipyard undergoing planned upgrades
o Helix Producer I produced 12.1 MBoe/d (net to our interest) in Phoenix field
*Liquidity as we define it is equal to cash and cash equivalents ($441 million), plus available capacity under our revolving credit facility ($396 million).

7
Executive Summary
• Oil and Gas
o First quarter average production rate of 160 Mmcfe/d (63% oil)
o Q2 production through April 22 averaged approximately 140 Mmcfe/d (~67% oil)
§ Phoenix production averaged 10.3 MBoe/d for the same period
§ Little Burn on track for first production in July (est. 4,500 bpd net)
• Oil and gas production totaled 14.4 Bcfe in Q1 2011 versus 13.7 Bcfe in Q4 2010
o Avg realized price for oil of $90.49 / bbl ($80.11 / bbl in Q4 2010), inclusive of hedges
o Avg realized price for gas of $5.77 / Mcfe ($6.11 / Mcfe in Q4 2010), inclusive of hedges
§ Gas price realizations benefited from sales of natural gas liquids
§ NGL production of 0.8 Bcfe in Q1 2011 and 0.6 Bcfe in Q4 2010

8
Operational Highlights

9
($ in millions, except percentages)
(A) See non-GAAP reconciliation on slides 26-27. Amounts are prior to intercompany
eliminations.
eliminations.
Contracting Services
• 77% utilization in Well Intervention
• Weak GOM market impacts Subsea
Construction and Robotics
Construction and Robotics
• Caesar in shipyard undergoing
planned upgrades
planned upgrades
Express spooling pipe in Ingleside

10
($ in millions)
Equity in Earnings of Equity Investments

11
Contracting Services - Well Ops
GOM
• Q4000 worked for Mariner, W&T, Marathon and Shell in the
first quarter
first quarter
• 88% utilization in the first quarter
• Strong outlook anticipated for rest of 2011
North Sea
• Seawell and Well Enhancer posted a combined 68%
utilization in the first quarter. Both vessels experienced
downtime due to repair, maintenance and weather
utilization in the first quarter. Both vessels experienced
downtime due to repair, maintenance and weather
• Strong outlook anticipated for both vessels for rest of 2011
• Well Enhancer continues to establish its coiled tubing
capabilities with a second project booked in August 2011
capabilities with a second project booked in August 2011
Asia Pacific
• Deployed the Normand Clough on a day rate construction
project for COOEC offshore China through Q3
project for COOEC offshore China through Q3
• Wellhead cutting system to be deployed for 6 month project
starting in Q3
starting in Q3
MODU DP3 Q4000 operating in the Gulf of Mexico

12
Contracting Services - Robotics
• Weak Q1 utilization due to soft ROV market in the
Gulf of Mexico and chartered vessel
redeployments
Gulf of Mexico and chartered vessel
redeployments
• Visibility and outlook expected to improve for the
remainder of 2011
remainder of 2011
• New day rate contract with Reliance in India to
work the Olympic Canyon for up to 2 years
work the Olympic Canyon for up to 2 years
• Minimal trenching work for Island Pioneer with T-
750 and iTrencher in Q1; however fully booked
until Q4
750 and iTrencher in Q1; however fully booked
until Q4
• Deep Cygnus (spot charter vessel) currently
performing wind farm trenching project with
opportunity to extend into Q4
performing wind farm trenching project with
opportunity to extend into Q4
T-750 Supertrencher I being deployed in the North Sea

13
Contracting Services - Subsea Construction
Contracting Services - Subsea Construction
• Low Q1 utilization for Subsea Construction
vessels resulting from weak GOM market
vessels resulting from weak GOM market
• Customer permitting issues impacting
utilization
utilization
• Express completed pipelay operations for
ATP’s Anduin, Newfield’s Gladden and
Mariner’s Pluto projects in the GOM
ATP’s Anduin, Newfield’s Gladden and
Mariner’s Pluto projects in the GOM
• Intrepid completed a pipelay project for
Anadarko’s Boomvang project in the GOM
Anadarko’s Boomvang project in the GOM
• Caesar remains in the shipyard undergoing
planned maintenance and upgrades
planned maintenance and upgrades
DP Reel Lay Vessel Intrepid

14
Helix Fast Response System (HFRS)
• Utilizes vessels and subsea
systems proven in Macondo
spill response
systems proven in Macondo
spill response
• Capability to capture and
process up to 55,000 bpd in
water depths to 8,000 feet
(increasing to 10,000 feet later
in 2011)
process up to 55,000 bpd in
water depths to 8,000 feet
(increasing to 10,000 feet later
in 2011)
• 24 independent E&P operators
have signed on to include HFRS
in future drilling permits
have signed on to include HFRS
in future drilling permits
• Cited as spill response plan in 6
approved deepwater drilling
permits to date
approved deepwater drilling
permits to date

15
Contracting Services Utilization
• Express
• Caesar
• Island Pioneer (1)
• Deep Cygnus (1)
• Normand Clipper (1)
• Olympic Triton (1)
• Well Enhancer
• Q4000
• Normand Clough (1)
• 2 ROVDrill Units
• 5 Trenchers
(1) Chartered vessels.

16
(A) Fourth quarter 2010 impairment
primarily associated with the
reduction in carrying values of
certain oil and gas properties
due to year-end revisions in
reserves.
primarily associated with the
reduction in carrying values of
certain oil and gas properties
due to year-end revisions in
reserves.
(B) Primarily consisted of $6.4
million of costs associated with
expiring offshore leases in the
fourth quarter of 2010.
million of costs associated with
expiring offshore leases in the
fourth quarter of 2010.
(C) Including effect of settled hedges
and mark-to-market derivative
contracts.
and mark-to-market derivative
contracts.
Oil & Gas

17
Oil & Gas
(A) Included accretion expense.
(B) Excluded exploration expense and net hurricane-related costs (reimbursements).
Operating Costs ($ in millions, except per Mcfe data)
18
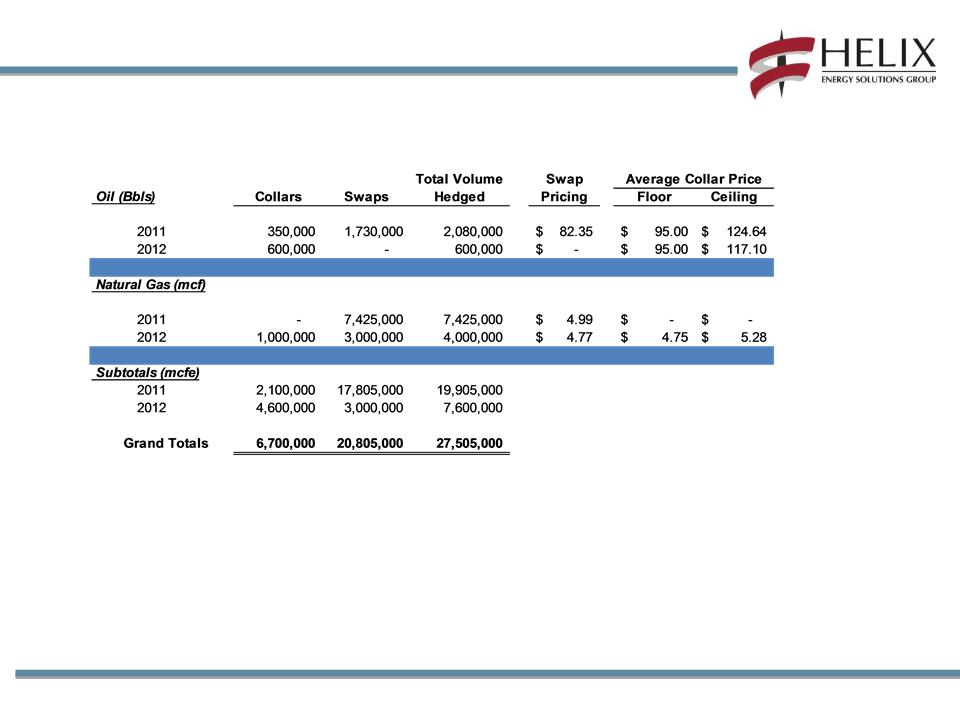
Summary of Apr 2011 - Dec 2012 Hedging Positions *
* As of April 22, 2011.

19
Key Balance
Sheet Metrics
Sheet Metrics

20
Debt and Liquidity Profile
(A) Includes impact of unamortized debt discount under our Convertible Senior Notes.
(B) Liquidity, as we define it, is equal to cash and cash equivalents ($441 million), plus available
capacity under our revolving credit facility ($396 million).
capacity under our revolving credit facility ($396 million).
21
2011 Outlook
22
2011 Outlook
|
Broad Metrics
|
2011 Forecast
(revised)
|
2011 Forecast
(original)
|
2010 Actual
|
|
Oil and Gas
Production |
50 Bcfe
|
49 Bcfe
|
47 Bcfe
|
|
EBITDAX
|
$550 million
|
$475 million
|
$430 million
|
|
CAPEX
|
$250 million
|
$225 million
|
$179 million
|
|
Commodity Price
Deck |
2011 Forecast
(revised)
|
2011 Forecast
(original)
|
2010 Actual
|
|
|
Hedged
|
Oil
|
$96.28 / bbl
|
$87.11 / bbl
|
$75.27 / bbl
|
|
Gas
|
$5.02/ mcf
|
$4.80/ mcf
|
$6.01 / mcf
|
|
We expect to continue to improve our liquidity position in 2011.

23
2011 Outlook
• Contracting Services
o Strong backlog for the Q4000, Well Enhancer and Seawell in 2011
o Robotics utilization recovery in second half of 2011, driven primarily by activity outside
the GOM
the GOM
o Current regulatory environment in the GOM limits short-term opportunities in Subsea
Construction and Robotics businesses
Construction and Robotics businesses
o Continued focus on trenching and cable burial business
• Production Facilities
o HP I continues production at Phoenix field and completes upgrades for spill response
capabilities
capabilities
• Oil and Gas
o Forecasted 2011 overall production up slightly from 2010 levels
§ 63% oil and 65% deepwater
§ Assumes no significant storm disruptions
§ Assumes Little Burn completed and producing by early Q3

24
2011 Outlook
• Capital Expenditures
o Contracting Services ($85 million)
§ No major vessel projects or dry docks planned for 2011
§ Caesar thruster upgrade in Q2 and Q3
§ Incremental investment in Robotics business
§ Capital expenditures related to the potential Statoil Cat B well intervention
project not included
project not included
o Oil and Gas ($165 million)
§ Focus capital investment on oil development with relatively fast payback
§ Little Burn completion by early Q3
§ Drill two wells in the 2nd half of the year (subject to permitting)
§ Kathleen in the Bushwood field
§ Wang in the Phoenix field
§ Shelf platform construction and opportunistic workovers

25
Non-GAAP
Reconciliations
Reconciliations

26
Non-GAAP Reconciliations
Adjusted EBITDAX ($ in millions)
We calculate Adjusted EBITDAX as earnings before net interest expense, taxes, depreciation and amortization and exploration expense. These
non-GAAP measures are useful to investors and other internal and external users of our financial statements in evaluating our operating
performance because they are widely used by investors in our industry to measure a company’s operating performance without regard to items
which can vary substantially from company to company, and help investors meaningfully compare our results from period to period. Adjusted
EBITDAX should not be considered in isolation or as a substitute for, but instead is supplemental to, income from operations, net income or other
income data prepared in accordance with GAAP. Non-GAAP financial measures should be viewed in addition to, and not as an alternative to our
reported results prepared in accordance with GAAP. Users of this financial information should consider the types of events and transactions which
are excluded.

Revenue and Gross Profit As Reported ($ in millions)
Non-GAAP Reconciliations

28