Attached files
| file | filename |
|---|---|
| 8-K - 8-K - Walter Energy, Inc. | a11-10837_18k.htm |
Exhibit 99.1
|
|
First Quarter 2011 Earnings Conference Call April 21, 2011 |
|
|
Safe Harbor Statement Except for historical information contained herein, the statements in this document are forward-looking and made pursuant to the safe harbor provisions of the Private Securities Litigation Reform Act of 1995 and may involve a number of risks and uncertainties. Forward-looking statements are based on information available to management at the time, and they involve judgments and estimates. There can be no assurance that the transaction with Western Coal will close. The transaction is subject to a number of closing conditions which may be outside of Walter Energy's control. Forward-looking statements include expressions such as "believe," "anticipate," "expect," "estimate," "intend," "may," “plan,” “predict,” "will," and similar terms and expressions. These forward-looking statements are made based on expectations and beliefs concerning future events affecting us and are subject to various risks, uncertainties and factors relating to our operations and business environment, all of which are difficult to predict and many of which are beyond our control, that could cause our actual results to differ materially from those matters expressed in or implied by these forward-looking statements. The following factors are among those that may cause actual results to differ materially from our forward-looking statements: the market demand for coal, coke and natural gas as well as changes in pricing and costs; the availability of raw material, labor, equipment and transportation; changes in weather and geologic conditions; changes in extraction costs, pricing and assumptions and projections concerning reserves in our mining operations; changes in customer orders; pricing actions by our competitors, customers, suppliers and contractors; changes in governmental policies and laws, including with respect to safety enhancements and environmental initiatives; availability and costs of credit, surety bonds and letters of credit; and changes in general economic conditions. Forward- looking statements made by us in this document, or elsewhere, speak only as of the date on which the statements were made. See also the “Risk Factors” in our 2010 Annual Report on Form 10-K and subsequent filings with the SEC which are currently available on our website at www.walterenergy.com. New risks and uncertainties arise from time to time, and it is impossible for us to predict these events or how they may affect us or our anticipated results. We have no duty to, and do not intend to, update or revise the forward-looking statements in this document, except as may be required by law. In light of these risks and uncertainties, readers should keep in mind that any forward-looking statement made in this press document may not occur. All data presented herein is as of the date of this document unless otherwise noted. |
|
|
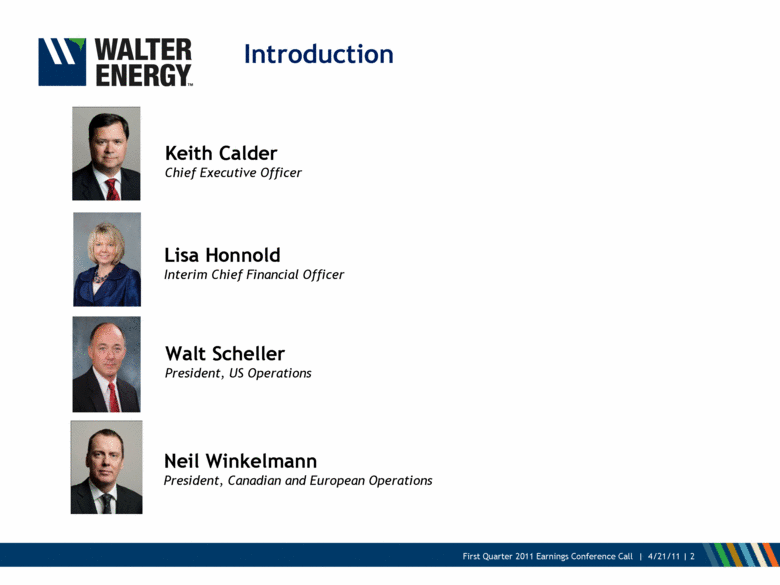
Introduction Keith Calder Chief Executive Officer Walt Scheller President, US Operations Neil Winkelmann President, Canadian and European Operations Lisa Honnold Interim Chief Financial Officer |
|
|
Agenda Safety Q1-2011 Highlights Q1-2011 Financial Review Q1-2011 Operations Review Overview of Western Coal Assets Market Update Moving Forward Q&A 1. 2. 3. 4. 5. 6. 7. 8. |
|
|
Walter Energy + Western Coal Keith Calder Chief Executive Officer |
|
|
The New Walter Energy The leading global, publicly traded, “pure-play” metallurgical coal producer 5 |
|
|
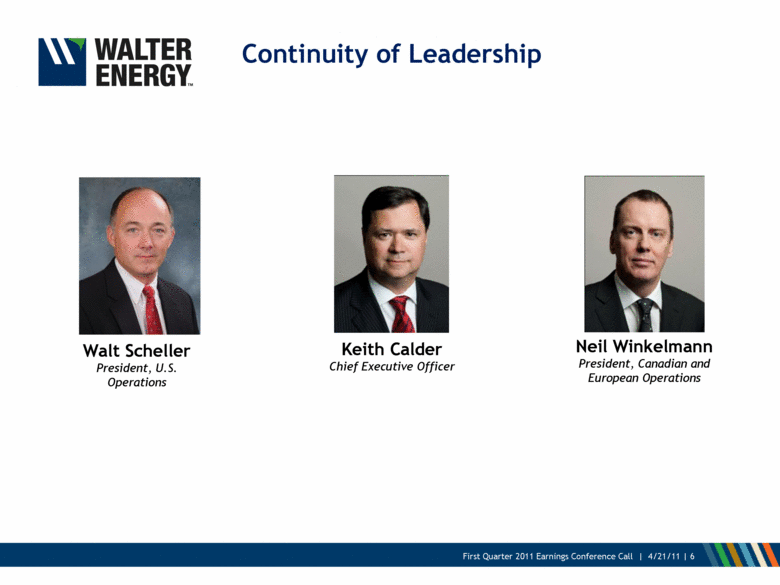
Continuity of Leadership Keith Calder Chief Executive Officer Walt Scheller President, U.S. Operations Neil Winkelmann President, Canadian and European Operations |
|
|
Highlights Keith Calder, CEO |
|
|
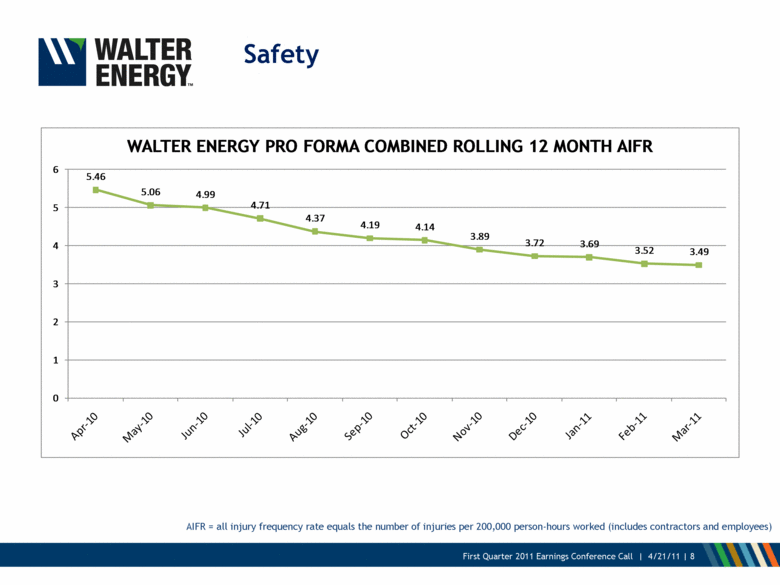
Safety AIFR = all injury frequency rate equals the number of injuries per 200,000 person-hours worked (includes contractors and employees) |
|
|
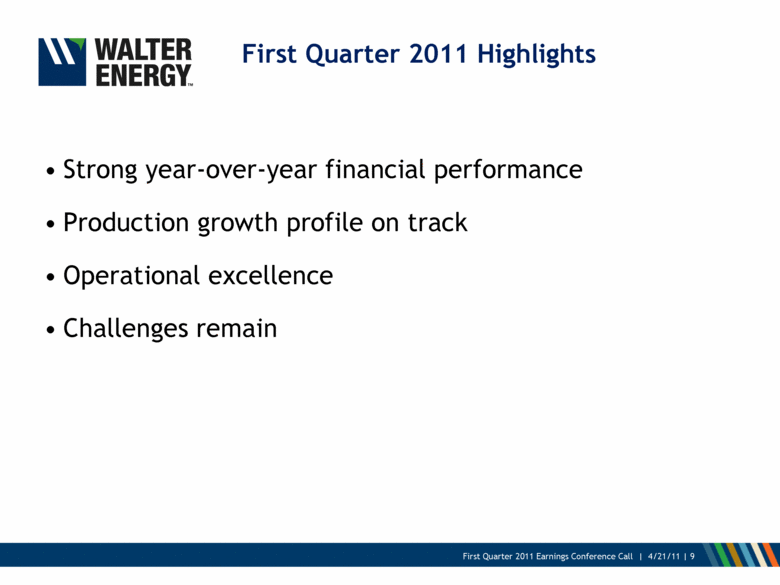
Strong year-over-year financial performance Production growth profile on track Operational excellence Challenges remain First Quarter 2011 Highlights |
|
|
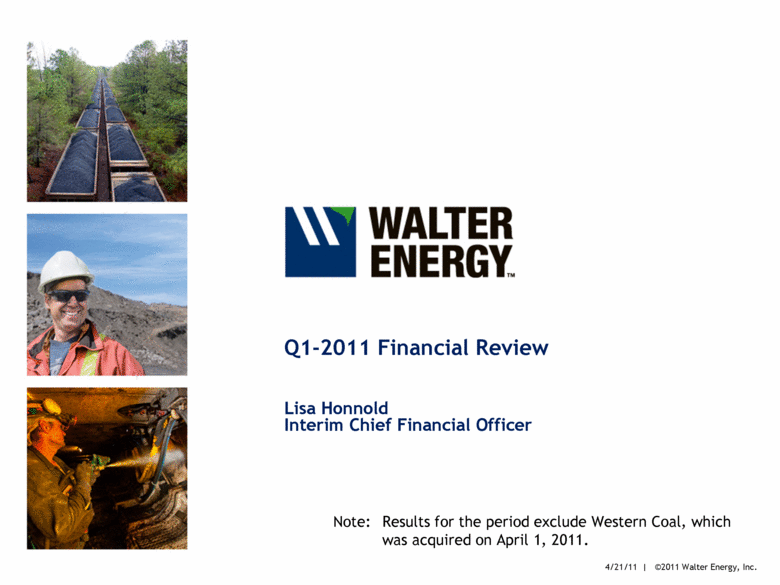
Q1-2011 Financial Review Lisa Honnold Interim Chief Financial Officer Note: Results for the period exclude Western Coal, which was acquired on April 1, 2011. |
|
|
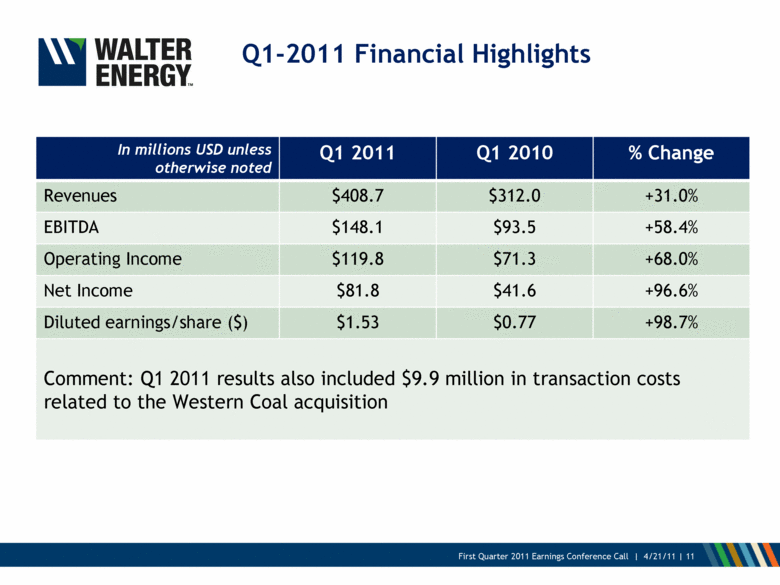
In millions USD unless otherwise noted Q1 2011 Q1 2010 % Change Revenues $408.7 $312.0 +31.0% EBITDA $148.1 $93.5 +58.4% Operating Income $119.8 $71.3 +68.0% Net Income $81.8 $41.6 +96.6% Diluted earnings/share ($) $1.53 $0.77 +98.7% Comment: Q1 2011 results also included $9.9 million in transaction costs related to the Western Coal acquisition Q1-2011 Financial Highlights |
|
|
Q1-2011 Operations Review Walt Scheller President - U.S. Operations |
|
|
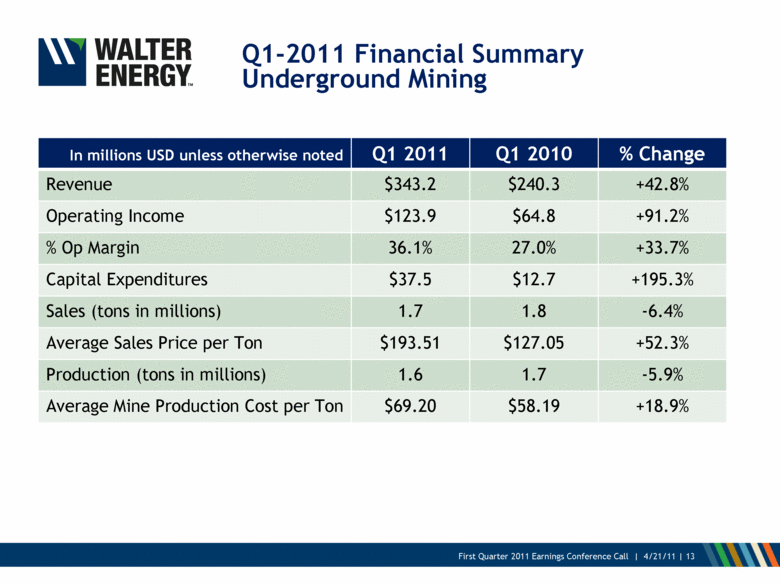
In millions USD unless otherwise noted Q1 2011 Q1 2010 % Change Revenue $343.2 $240.3 +42.8% Operating Income $123.9 $64.8 +91.2% % Op Margin 36.1% 27.0% +33.7% Capital Expenditures $37.5 $12.7 +195.3% Sales (tons in millions) 1.7 1.8 -6.4% Average Sales Price per Ton $193.51 $127.05 +52.3% Production (tons in millions) 1.6 1.7 -5.9% Average Mine Production Cost per Ton $69.20 $58.19 +18.9% Q1-2011 Financial Summary Underground Mining |
|
|
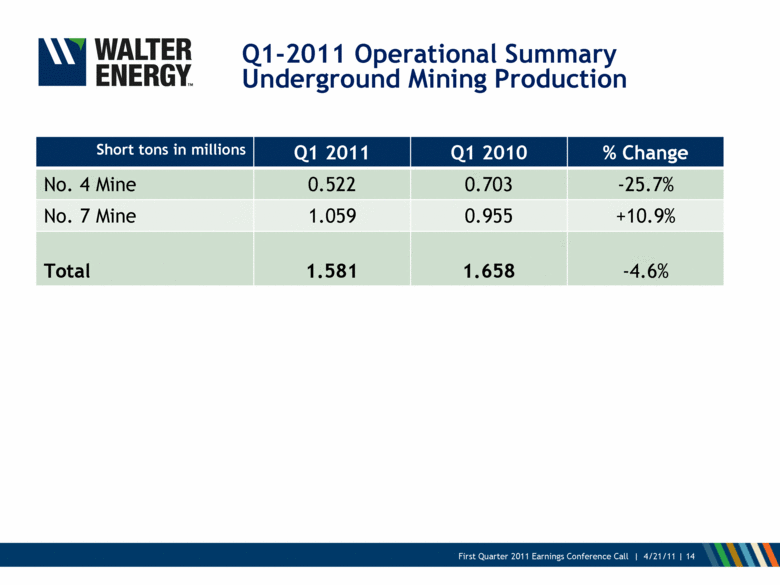
Short tons in millions Q1 2011 Q1 2010 % Change No. 4 Mine 0.522 0.703 -25.7% No. 7 Mine 1.059 0.955 +10.9% Total 1.581 1.658 -4.6% Q1-2011 Operational Summary Underground Mining Production |
|
|
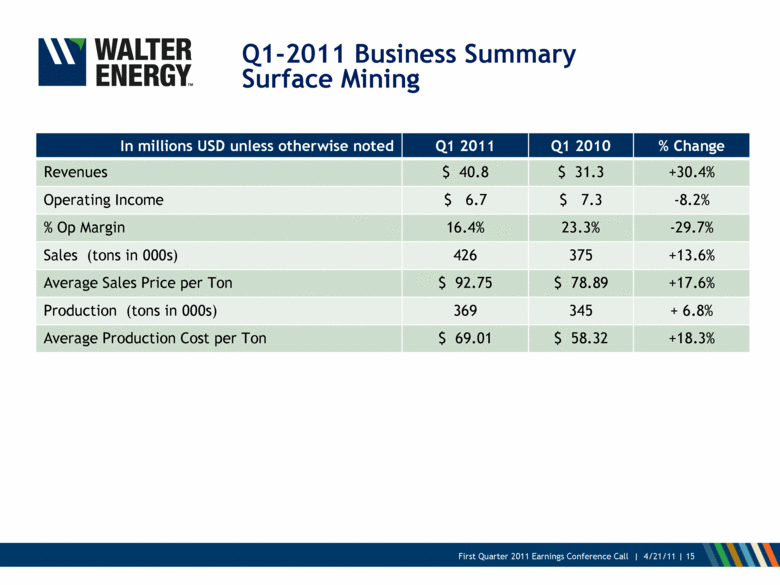
In millions USD unless otherwise noted Q1 2011 Q1 2010 % Change Revenues $ 40.8 $ 31.3 +30.4% Operating Income $ 6.7 $ 7.3 -8.2% % Op Margin 16.4% 23.3% -29.7% Sales (tons in 000s) 426 375 +13.6% Average Sales Price per Ton $ 92.75 $ 78.89 +17.6% Production (tons in 000s) 369 345 + 6.8% Average Production Cost per Ton $ 69.01 $ 58.32 +18.3% Q1-2011 Business Summary Surface Mining |
|
|
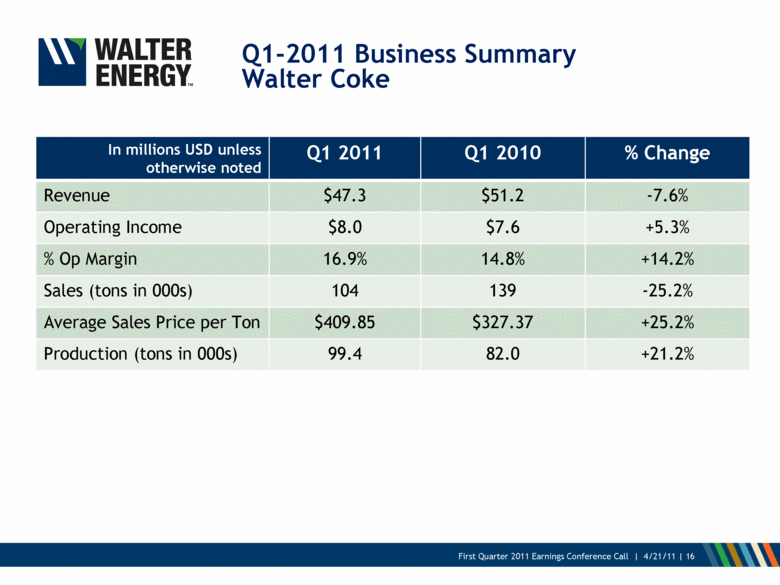
In millions USD unless otherwise noted Q1 2011 Q1 2010 % Change Revenue $47.3 $51.2 -7.6% Operating Income $8.0 $7.6 +5.3% % Op Margin 16.9% 14.8% +14.2% Sales (tons in 000s) 104 139 -25.2% Average Sales Price per Ton $409.85 $327.37 +25.2% Production (tons in 000s) 99.4 82.0 +21.2% Q1-2011 Business Summary Walter Coke |
|
|
An Introduction to Western Coal Neil Winkelmann President - Canadian and European Operations Note: All tonnage references in this section are provided in metric tons |
|
|
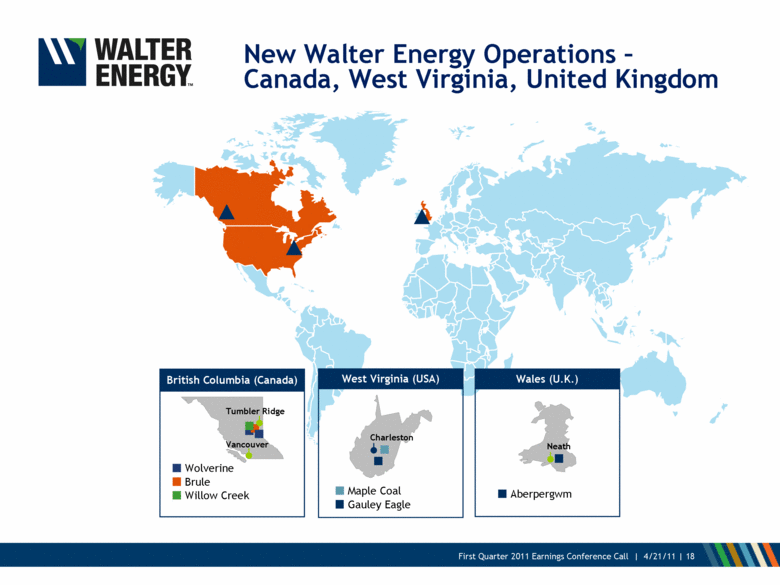
New Walter Energy Operations – Canada, West Virginia, United Kingdom Maple Coal Gauley Eagle Charleston Aberpergwm Neath Brule Willow Creek Tumbler Ridge Vancouver British Columbia (Canada) West Virginia (USA) Wales (U.K.) Wolverine |
|
|
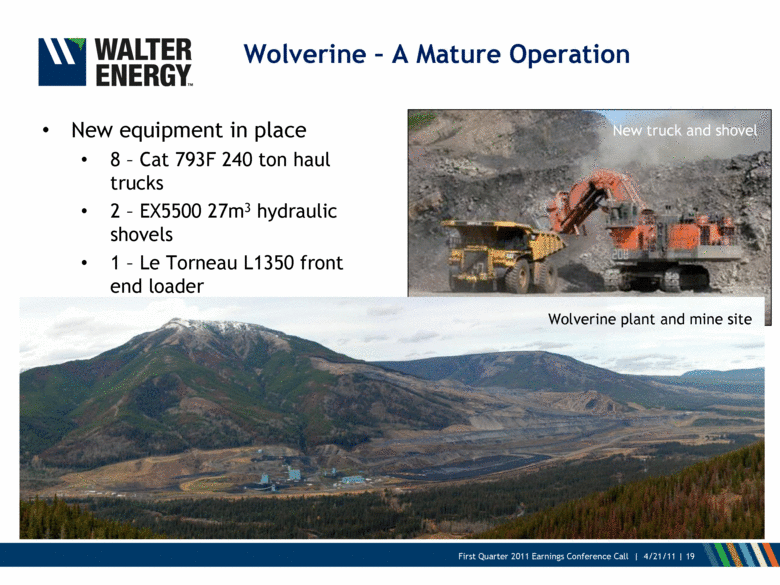
Wolverine - A Mature Operation New equipment in place 8 - Cat 793F 240 ton haul trucks 2 - EX5500 27m3 hydraulic shovels 1 - Le Torneau L1350 front end loader Wolverine plant and mine site New truck and shovel |
|
|
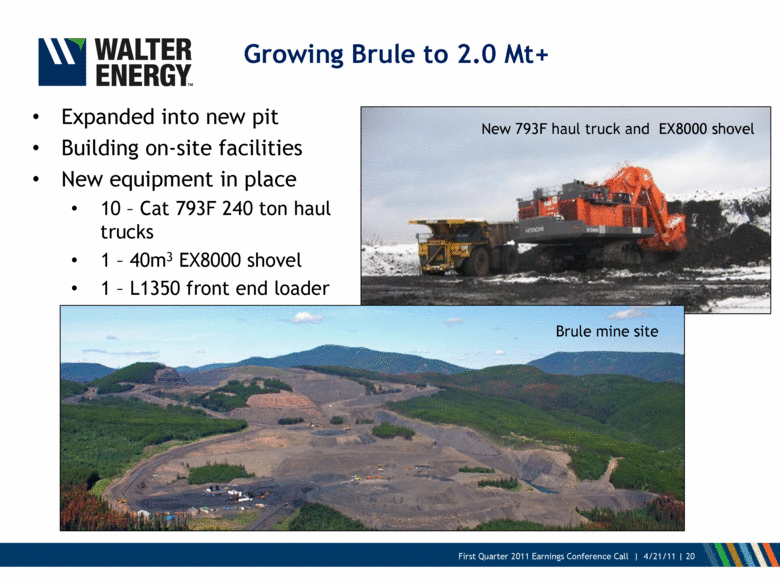
Growing Brule to 2.0 Mt+ Expanded into new pit Building on-site facilities New equipment in place 10 - Cat 793F 240 ton haul trucks 1 - 40m3 EX8000 shovel 1 - L1350 front end loader Brule mine site New 793F haul truck and EX8000 shovel |
|
|
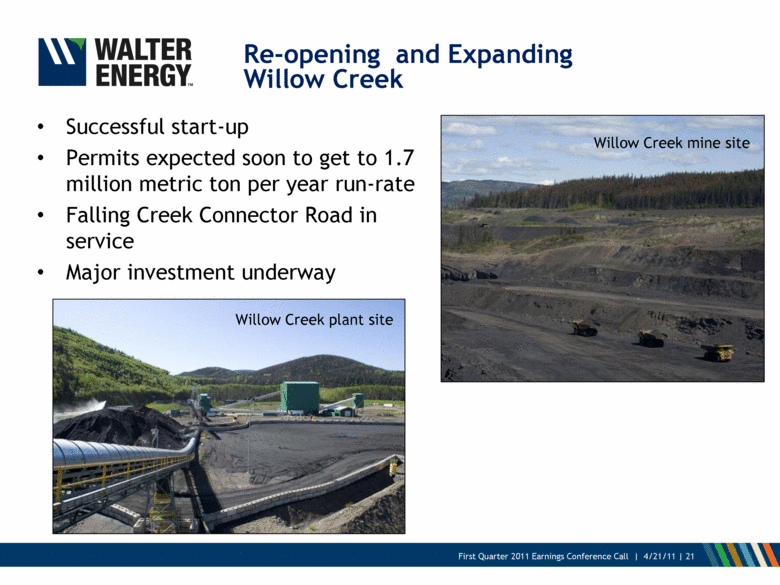
Re-opening and Expanding Willow Creek Successful start-up Permits expected soon to get to 1.7 million metric ton per year run-rate Falling Creek Connector Road in service Major investment underway Willow Creek mine site Willow Creek plant site |
|
|
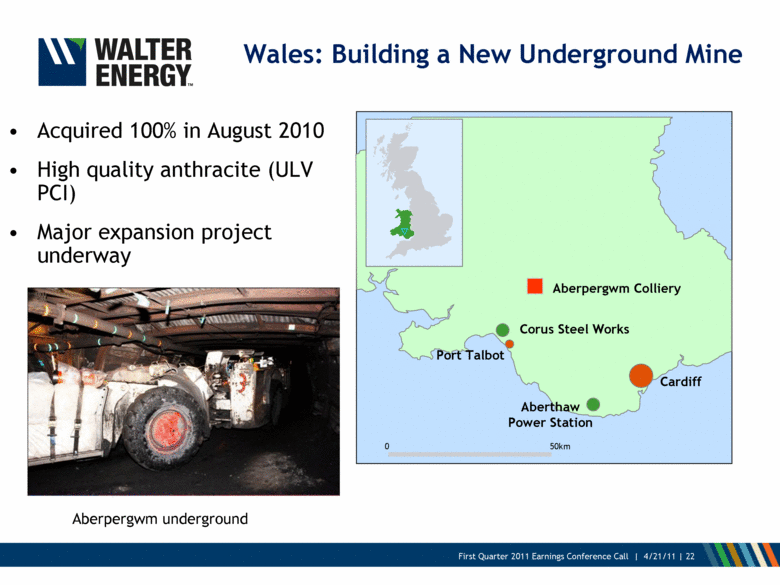
Wales: Building a New Underground Mine Acquired 100% in August 2010 High quality anthracite (ULV PCI) Major expansion project underway 22 Port Talbot 0 50km Cardiff Aberthaw Power Station Corus Steel Works Aberpergwm Colliery Aberpergwm underground |
|
|
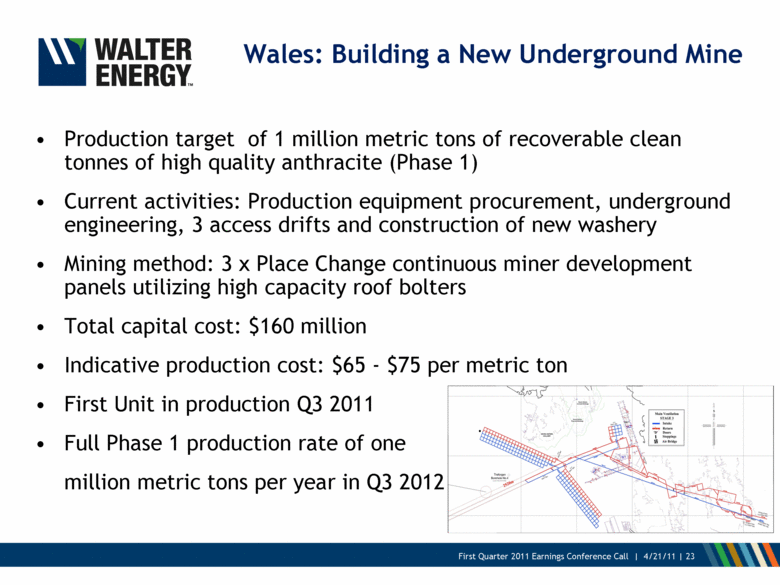
Wales: Building a New Underground Mine 23 Production target of 1 million metric tons of recoverable clean tonnes of high quality anthracite (Phase 1) Current activities: Production equipment procurement, underground engineering, 3 access drifts and construction of new washery Mining method: 3 x Place Change continuous miner development panels utilizing high capacity roof bolters Total capital cost: $160 million Indicative production cost: $65 - $75 per metric ton First Unit in production Q3 2011 Full Phase 1 production rate of one million metric tons per year in Q3 2012 |
|
|
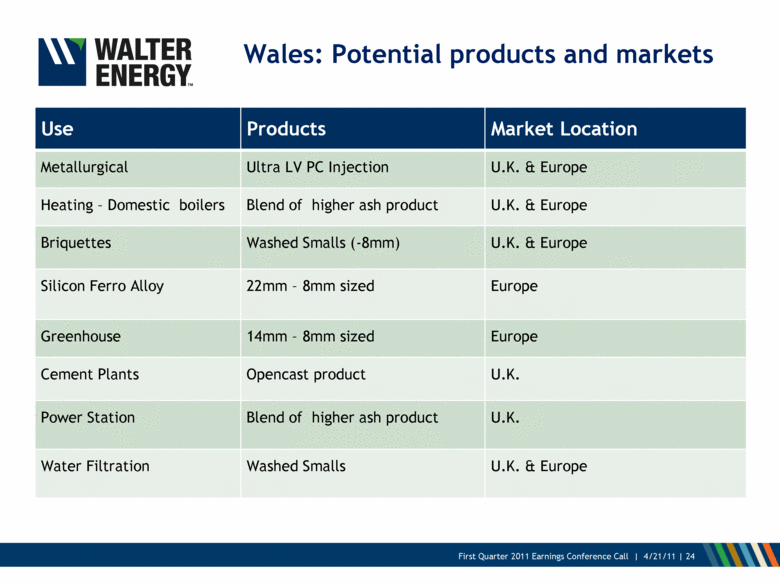
Wales: Potential products and markets 24 Use Products Market Location Metallurgical Ultra LV PC Injection U.K. & Europe Heating - Domestic boilers Blend of higher ash product U.K. & Europe Briquettes Washed Smalls (-8mm) U.K. & Europe Silicon Ferro Alloy 22mm - 8mm sized Europe Greenhouse 14mm - 8mm sized Europe Cement Plants Opencast product U.K. Power Station Blend of higher ash product U.K. Water Filtration Washed Smalls U.K. & Europe |
|
|
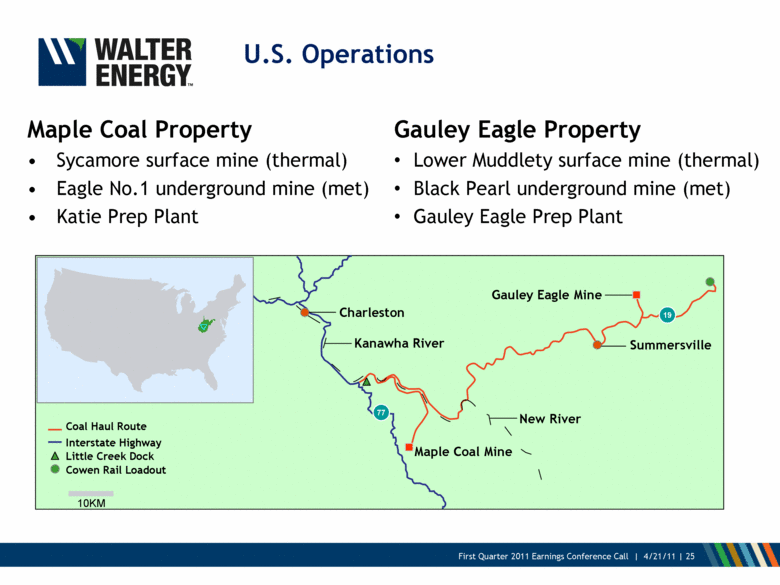
U.S. Operations Maple Coal Property Sycamore surface mine (thermal) Eagle No.1 underground mine (met) Katie Prep Plant Gauley Eagle Property Lower Muddlety surface mine (thermal) Black Pearl underground mine (met) Gauley Eagle Prep Plant 25 |
|
|
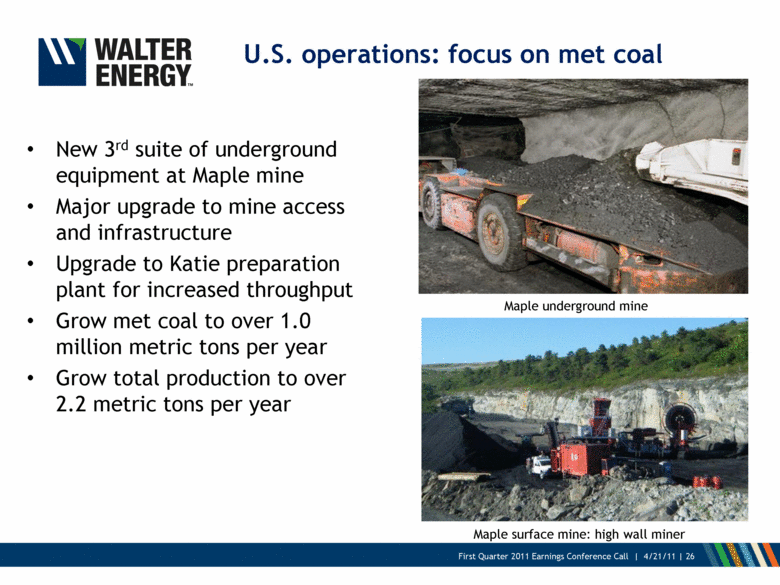
U.S. operations: focus on met coal New 3rd suite of underground equipment at Maple mine Major upgrade to mine access and infrastructure Upgrade to Katie preparation plant for increased throughput Grow met coal to over 1.0 million metric tons per year Grow total production to over 2.2 metric tons per year Maple underground mine Maple surface mine: high wall miner |
|
|
Market Update Keith Calder Chief Executive Officer |
|
|
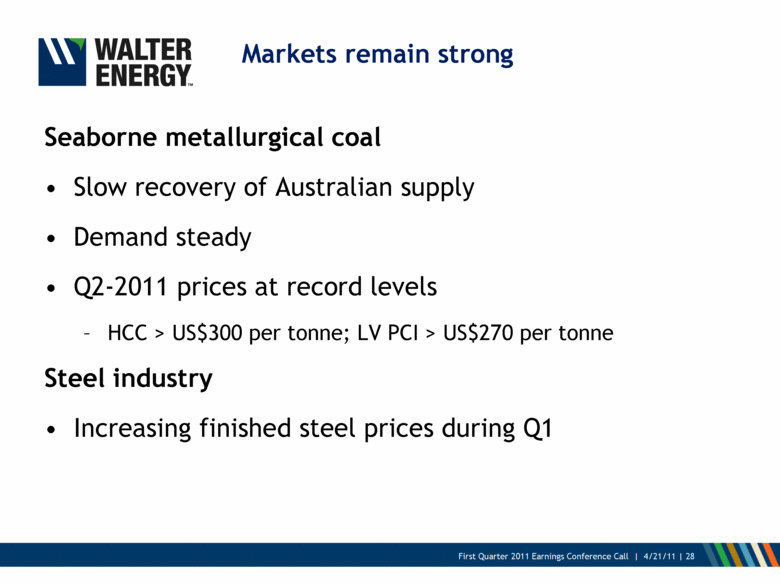
Markets remain strong Seaborne metallurgical coal Slow recovery of Australian supply Demand steady Q2-2011 prices at record levels HCC > US$300 per tonne; LV PCI > US$270 per tonne Steel industry Increasing finished steel prices during Q1 28 |
|
|
Moving Forward Keith Calder Chief Executive Officer |
|
|
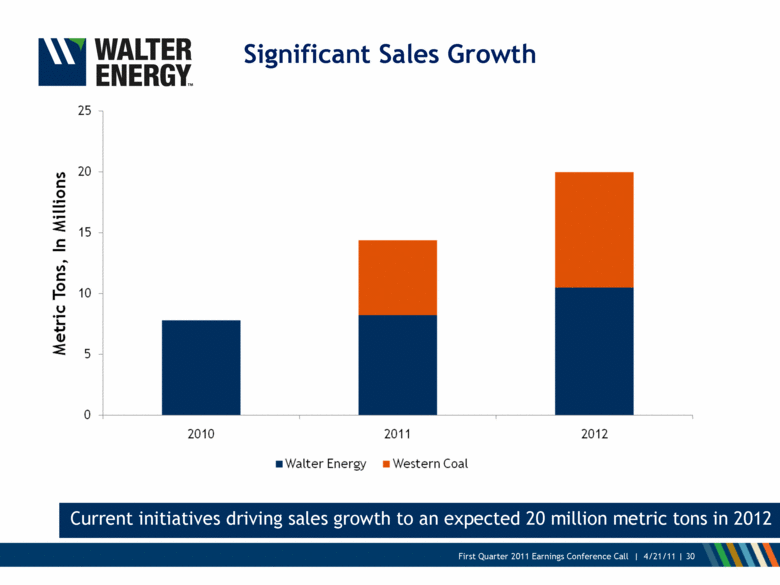
Significant Sales Growth Current initiatives driving sales growth to an expected 20 million metric tons in 2012 |
|
|
Make every ton a safe ton Deliver on our promises Integrate and evolve Remain poised to capitalize on additional growth opportunities Priorities Going Forward 31 |
|
|
Questions? |

