Attached files
| file | filename |
|---|---|
| 8-K - WESTERN ALLIANCE BANCORPORATION 8-K - WESTERN ALLIANCE BANCORPORATION | a6694490.htm |
| EX-99.1 - EXHIBIT 99.1 - WESTERN ALLIANCE BANCORPORATION | a6694490_ex99-1.htm |
Exhibit 99.2
Robert Sarver Chairman & CEO Ken Vecchione President & COO Dale Gibbons Executive Vice President & CFO 1st Quarter 2011 Earnings Call Western Alliance Bancorporation (NYSE: WAL) April 25, 2011
Forward-Looking Information This presentation contains forward-looking statements that relate to expectations, beliefs, projections, future plans and strategies, anticipated events or trends and similar expressions concerning matters that are not historical facts. The forward-looking statements contained herein reflect our current views about future events and financial performance and are subject to risks, uncertainties, assumptions and changes in circumstances that may cause our actual results to differ significantly from historical results and those expressed in any forward-looking statement. Some factors that could cause actual results to differ materially from historical or expected results include: factors listed in the Company’s annual report on Form 10-K as filed with the Securities and Exchange Commission; changes in general economic conditions, either nationally or locally in the areas in which we conduct or will conduct our business; inflation, interest rate, market and monetary fluctuations; increases in competitive pressures among financial institutions and businesses offering similar products and services; higher defaults on our loan portfolio than we expect; changes in management’s estimate of the adequacy of the allowance for loan losses; legislative or regulatory changes or changes in accounting principles, policies or guidelines; supervisory actions by regulatory agencies which may limit our ability to pursue certain growth opportunities; management’s estimates and projections of interest rates and interest rate policy; the execution of our business plan; and other factors affecting the financial services industry generally or the banking industry in particular.We do not intend and disclaim any duty or obligation to update or revise any industry information or forward-looking statements set forth in this presentation to reflect new information, future events or otherwise.
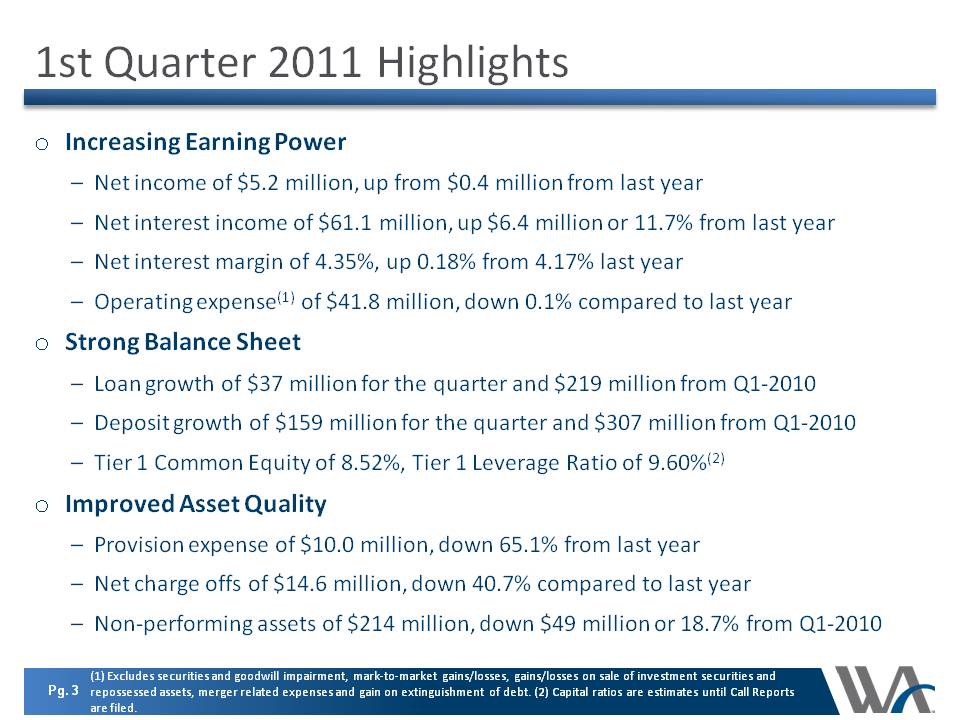
1st Quarter 2011 Highlights Increasing Earning Power Net income of $5.2 million, up from $0.4 million from last year Net interest income of $61.1 million, up $6.4 million or 11.7% from last year Net interest margin of 4.35%, up 0.18% from 4.17% last year Operating expense(1) of $41.8 million, down 0.1% compared to last year Strong Balance Sheet Loan growth of $37 million for the quarter and $219 million from Q1-2010 Deposit growth of $159 million for the quarter and $307 million from Q1-2010 Tier 1 Common Equity of 8.52%, Tier 1 Leverage Ratio of 9.60%(2) Improved Asset Quality Provision expense of $10.0 million, down 65.1% from last year Net charge offs of $14.6 million, down 40.7% compared to last year Non-performing assets of $214 million, down $49 million or 18.7% from Q1-2010 (1) Excludes securities and goodwill impairment, mark-to-market gains/losses, gains/losses on sale of investment securities and repossessed assets, merger related expenses and gain on extinguishment of debt. (2) Capital ratios are estimates until Call Reports are filed.
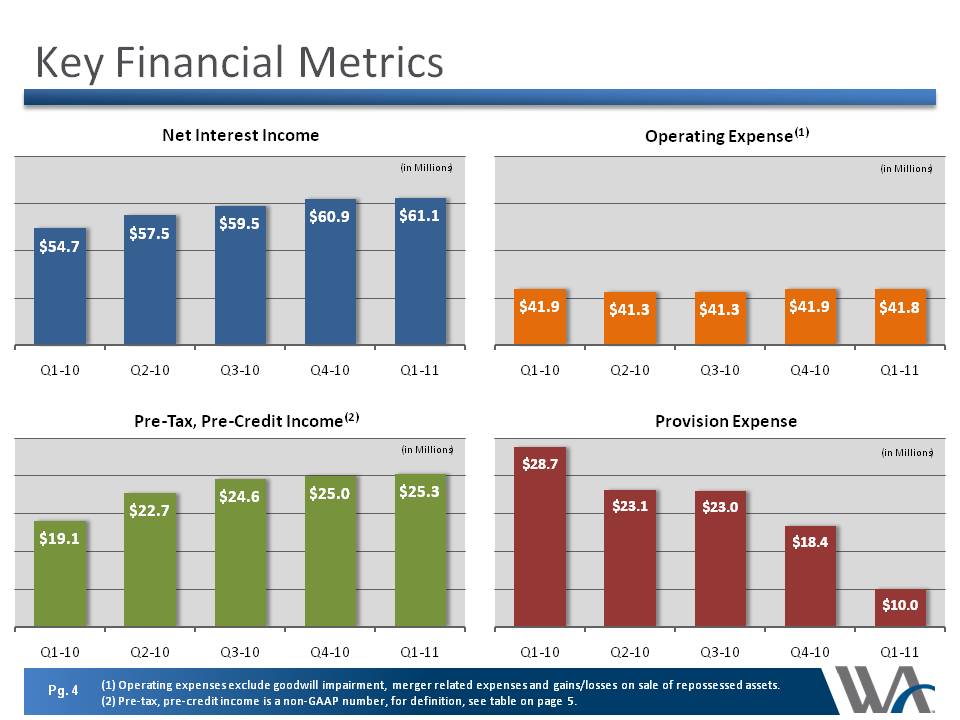
Key Financial Metrics (in Millions) (in Millions) (in Millions) (in Millions) Net Interest Income Operating Expense(1) Pre-Tax, Pre-Credit Income(2) Provision Expense Q1-10 Q2-10 Q3-10 Q4-10 Q1-11 Q1-10 Q2-10 Q3-10 Q4-10 Q1-11 Q1-10 Q2-10 Q3- 10 Q4-10 Q1-11 Q1-10 Q2-10 Q3-10 Q4-10 Q1-11 $54.7 $57.5 $59.5 $60.9 $61.1 $41.9 $41.3 $41.3 $41.9 $41.8 $19.1 $22.7 $24.6 $25.0 $25.3 $28.7 $23.1 $23.0 $18.4 $10.0 (1) Operating expenses exclude goodwill impairment, merger related expenses and gains/losses on sale of repossessed assets. (2) Pre-tax, pre-credit income is a non-GAAP number, for definition, see table on page 5.
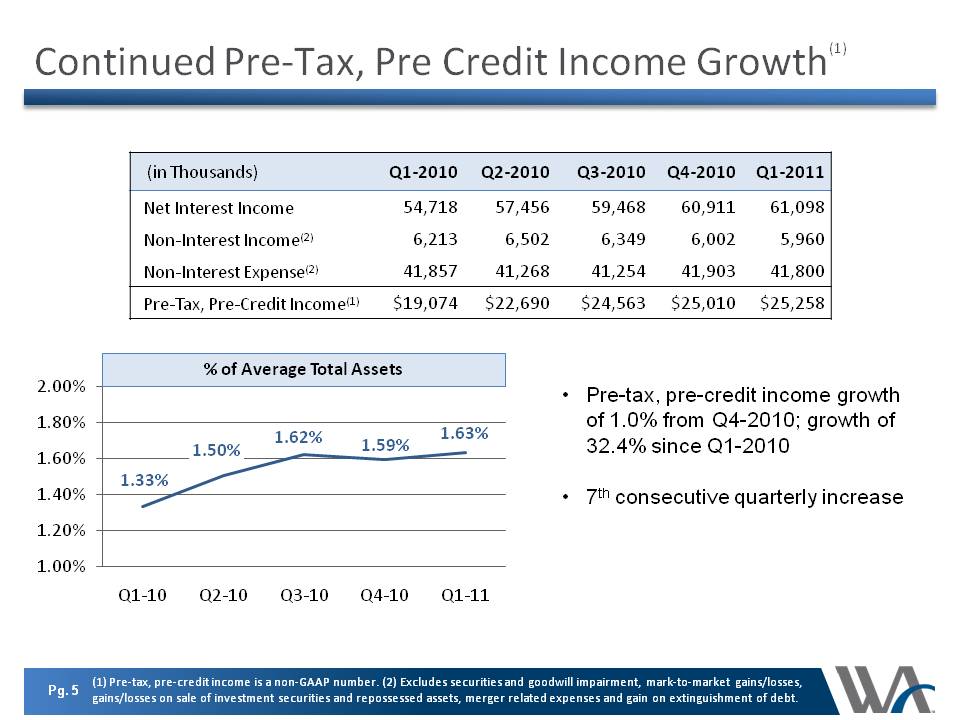
Continued Pre-Tax, Pre Credit Income Growth(1) Pre-tax, pre-credit income growth of 1.0% from Q4-2010; growth of 32.4% since Q1-2010 7th consecutive quarterly increase % of Average Total Assets (in Thousands) Q1-2010 Q2-2010 Q3-2010 Q4-2010 Q1-2011 2.00% 1.80% 1.60% 1.40% 1.20% 1.00% 1.33% 1.50% 1.62% 1.59% 1.63% Net Interest Income Non-Interest Income(2) Non-Interest Expense(2) 54,718 6,213 41,857 57,456 6,502 41,268 59,468 6,349 41,254 60,911 6,002 41,903 61,098 5,960 41,800 Pre-Tax, Pre-Credit Income(1) $19,074 $22,690 $24,563 $25,010 $25,258 (1) Pre-tax, pre-credit income is a non-GAAP number. (2) Excludes securities and goodwill impairment, mark-to-market gains/losses, gains/losses on sale of investment securities and repossessed assets, merger related expenses and gain on extinguishment of debt.
s
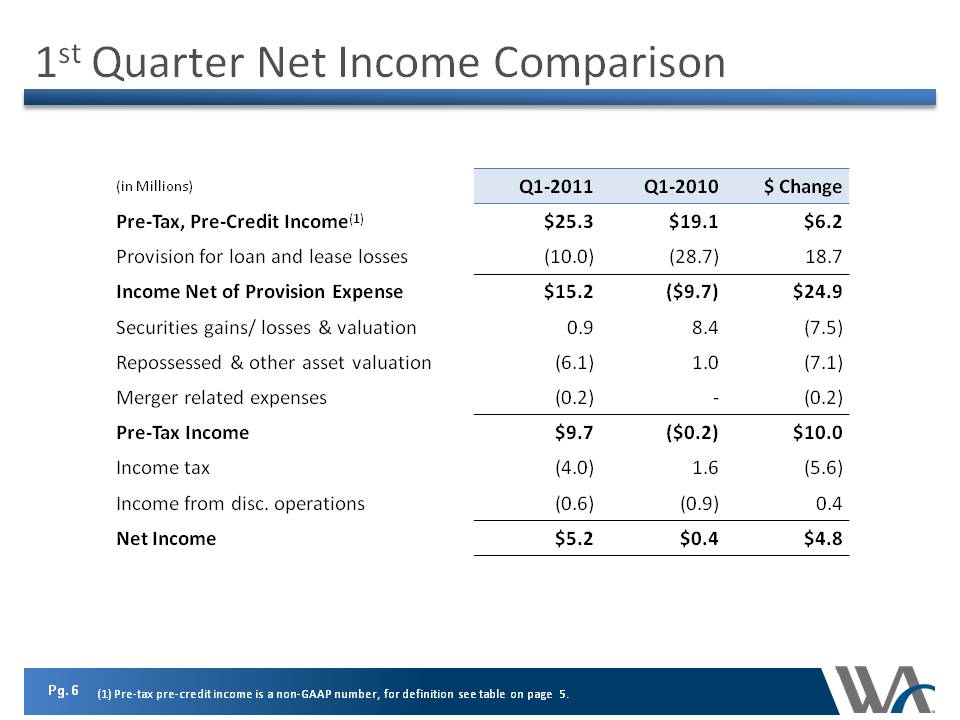
1st Quarter Net Income Comparison (in Millions) Pre-Tax, Pre-Credit Income(1) Provision for loan and lease losses Income Net of Provision Expense Securities gains/ losses & valuation Repossessed & other asset valuation Merger related expenses Pre-Tax Income Income tax Income from disc. operations Net Income Q1-2011 Q1-2010 $ Change $25.3 (10.0) $19.1 (28.7) $6.2 18.7 $15.2 0.9 (6.1) (0.2) ($9.7) 8.4 1.0 - $24.9 (7.5) (7.1) (0.2) $9.7 (4.0) (0.6) ($0.2) 1.6 (0.9) $10.0 (5.6) 0.4 $5.2 $0.4 $4.8 (1) Pre-tax pre-credit income is a non-GAAP number, for definition see table on page 5.
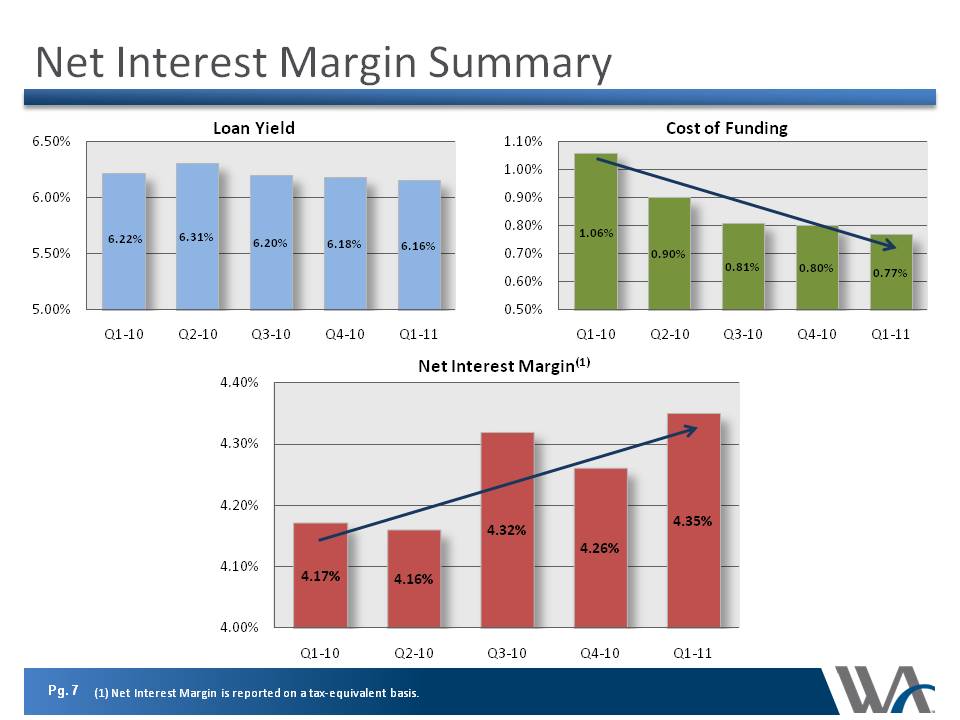
Net Interest Margin Summary Loan Yield Cost of Funding Net Interest Margin(1) Q1-10 Q2-10 Q3-10 Q4-10 Q1-11 6.50% 6.00% 5.50% 5.00% 6.22% 6.31% 6.20% 6.18% 6.16% Q1-10 Q2-10 Q3-10 Q4-10 Q1-11 1.10% 1.00% 0.90% 0.80% 0.70% 0.60% 0.50% 1.06% 0.90% 0.81% 0.80% 0.77% Q1-10 Q2-10 Q3-10 Q4-10 Q1-11 4.40% 4.30% 4.20% 4.10% 4.00% 4.17% 4.16% 4.32% 4.26% 4.35% (1) Net Interest Margin is reported on a tax-equivalent basis.
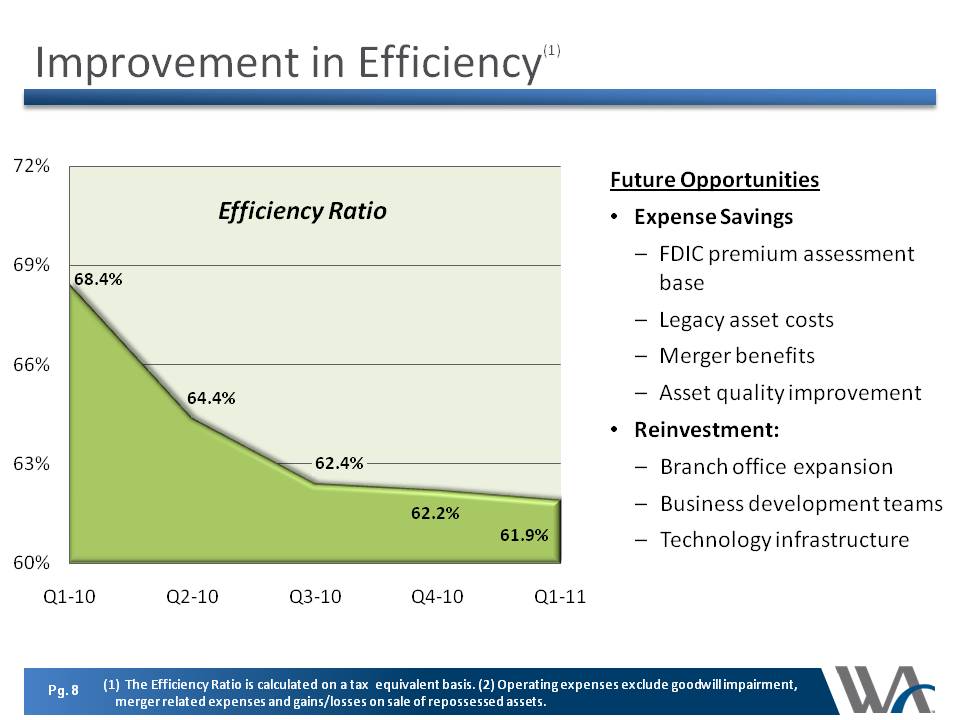
Improvement in Efficiency(1) 72% 69% 66% 63% 60% Q1-10 Q2-10 Q3-10 Q4-10 Q1-11 68.4% 64.4% 62.4% 62.2% 61.9% Efficiency Ratio Future Opportunities Expense Savings FDIC premium assessment base Legacy asset costs Merger benefits Asset quality improvement Reinvestment: Branch office expansion Business development teams Technology infrastructure (1) The Efficiency Ratio is calculated on a tax equivalent basis. (2) Operating expenses exclude goodwill impairment, merger related expenses and gains/losses on sale of repossessed assets.
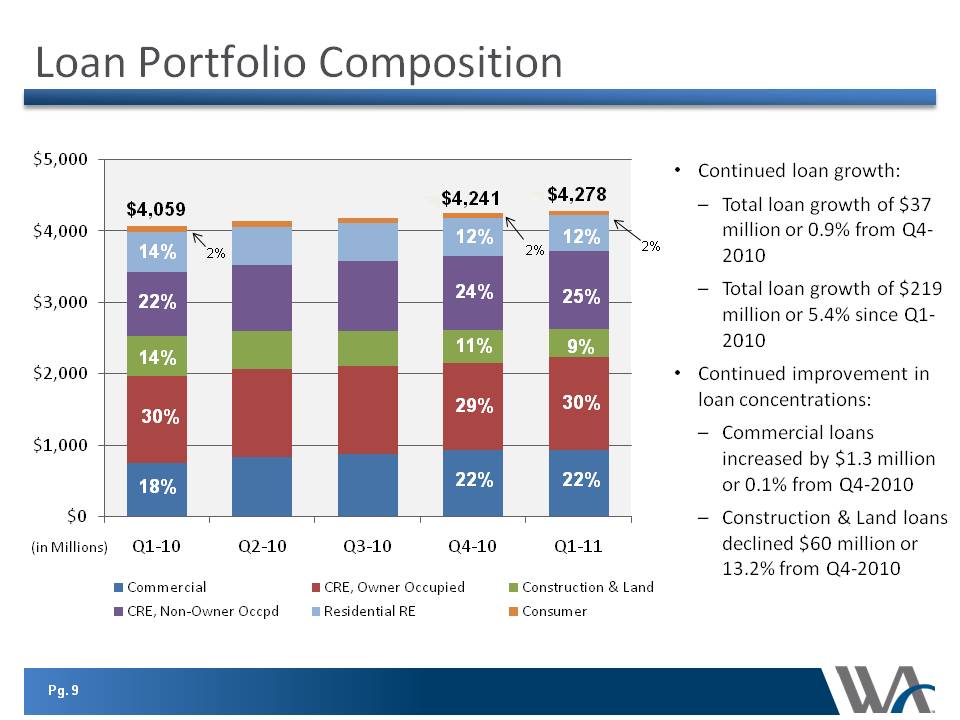
Loan Portfolio Composition (in Millions) $4,059 14% 22% 14% 30% 18% $4,241 12% 24% 11% 29% 22% $4,278 12% 25% 9% 30% 22% 2% 2% 2% $5,000 $4,000 $3,000 $2,000 $1,000 $0 Q1-10 Q2-10 Q3-10 Q4-10 Q1-11 Commerical CRE, Non-Owner Occpd CRE, Owner Occupied Residential RE Construction & Land Consumer Continued loan growth: Total loan growth of $37 million or 0.9% from Q4-2010 Total loan growth of $219 million or 5.4% since Q1-2010 Continued improvement in loan concentrations: Commercial loans increased by $1.3 million or 0.1% from Q4-2010 Construction & Land loans declined $60 million or 13.2% from Q4-2010
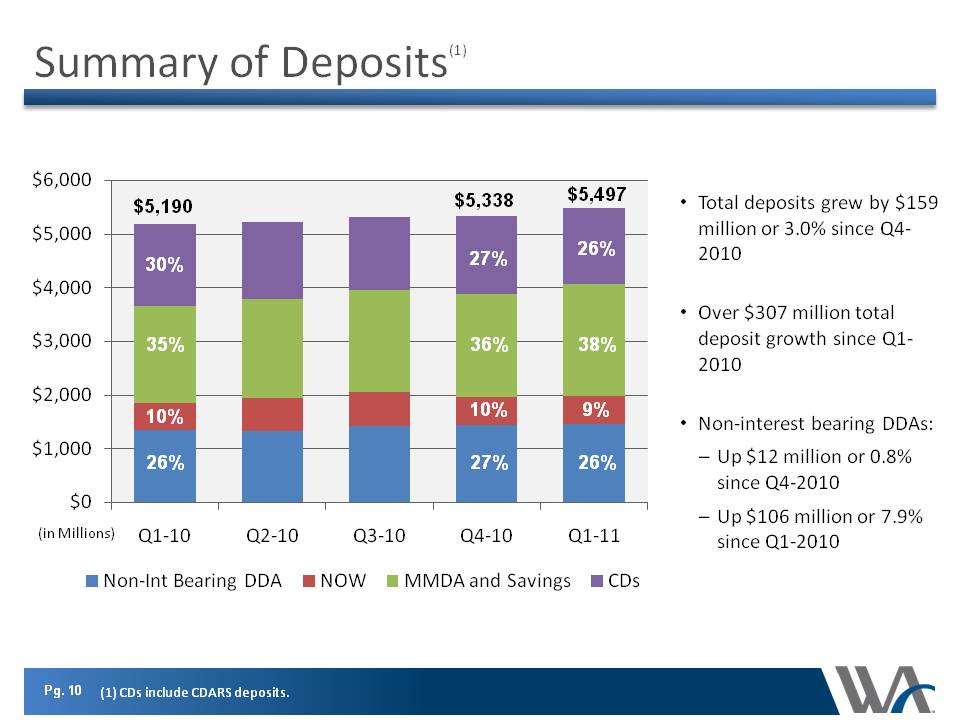
Summary of Deposits(1) $5,190 30% 35% 10% 26% $5,338 27% 36% 10% 27% $5,497 26% 38% 9% 26% Total deposits grew by $159 million or 3.0% since Q4-2010 Over $307 million total deposit growth since Q1-2010 Non-interest bearing DDAs: Up $12 million or 0.8% since Q4-2010 Up $106 million or 7.9% since Q1-2010 $6,000 $5,000 $4,000 $3,000 $2,000 $1,000 $0 Q1-10 Q2-10 Q3-10 Q4-10 Q1-11 (in Millions) Non-Int Bearing DDA NOW MMDA and Savings CDs (1) CDs include CDARS deposits.
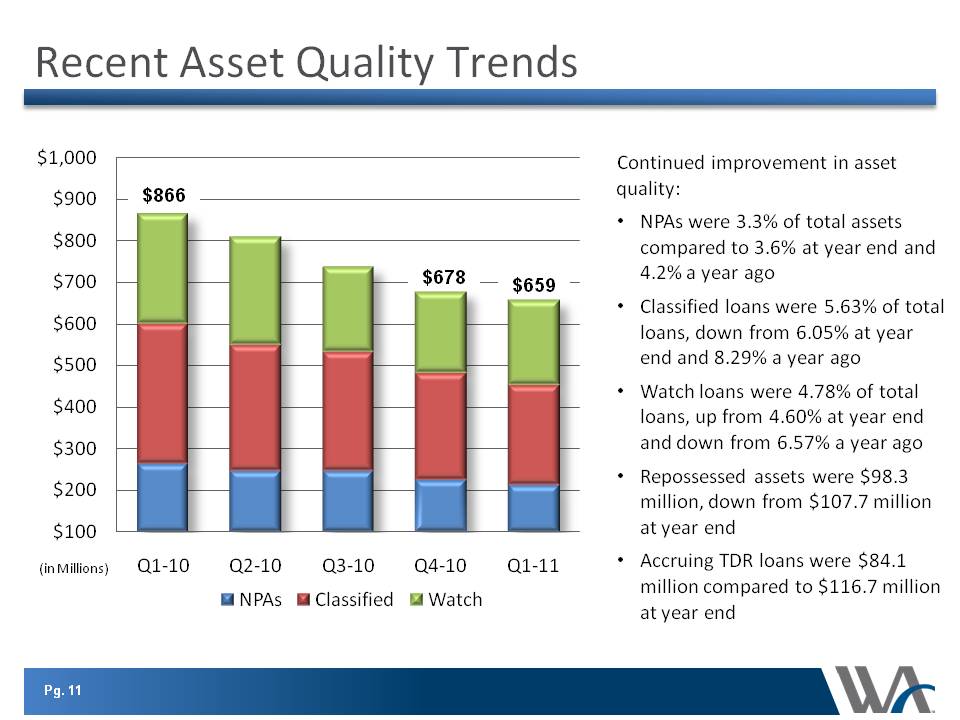
Recent Asset Quality Trends (in Millions) $866 $678 $659 $1,000 $900 $800 $700 $600 $500 $400 $300 $200 $100 Q1-10 Q2-10 Q3-10 Q4-10 Q1-11 NPAs Classified Watch Continued improvement in asset quality: NPAs were 3.3% of total assets compared to 3.6% at year end and 4.2% a year ago Classified loans were 5.63% of total loans, down from 6.05% at year end and 8.29% a year ago Watch loans were 4.78% of total loans, up from 4.60% at year end and down from 6.57% a year ago Repossessed assets were $98.3 million, down from $107.7 million at year end Accruing TDR loans were $84.1 million compared to $116.7 million at year end
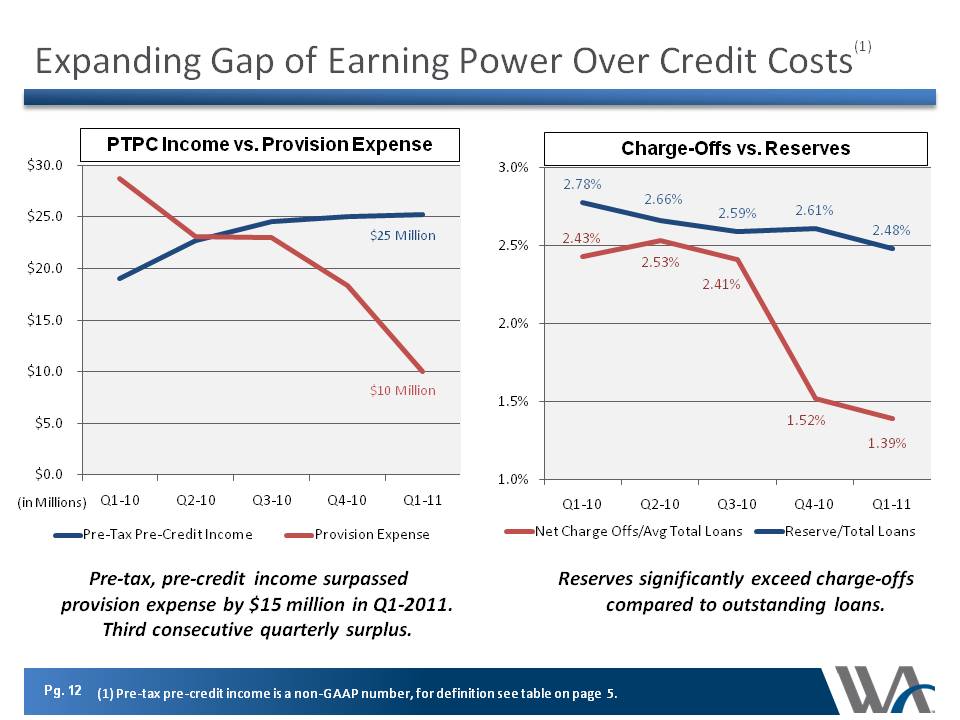
Expanding Gap of Earning Power Over Credit Costs(1) PTPC Income vs. Provision Expense $25 Million $10 Million Pre-Tax Pre-Credit Income Provision Expense Pre-tax, pre-credit income surpassed provision expense by $15 million in Q1-2011. Third consecutive quarterly surplus. $30.0 $25.0 $20.0 $15.0 $10.0 $5.0 $0.0 Q1-10 Q2-10 Q3-10 Q4-10 Q1-11 (in Millions) Charge-Offs vs. Reserves 2.78% 2.66% 2.59% 2.61% 2.48% 2.43% 2.53% 2.41% 1.52% 1.39% Net Charge Offs/Avg Total Loans Reserve/Total Loans Reserves significantly exceed charge-offs compared to outstanding loans. 3.0% 2.5% 2.0% 1.5% 1.0% Q1-10 Q2-10 Q3-10 Q4-10 Q1-11 (1) Pre-tax pre-credit income is a non-GAAP number, for definition see table on page 5.
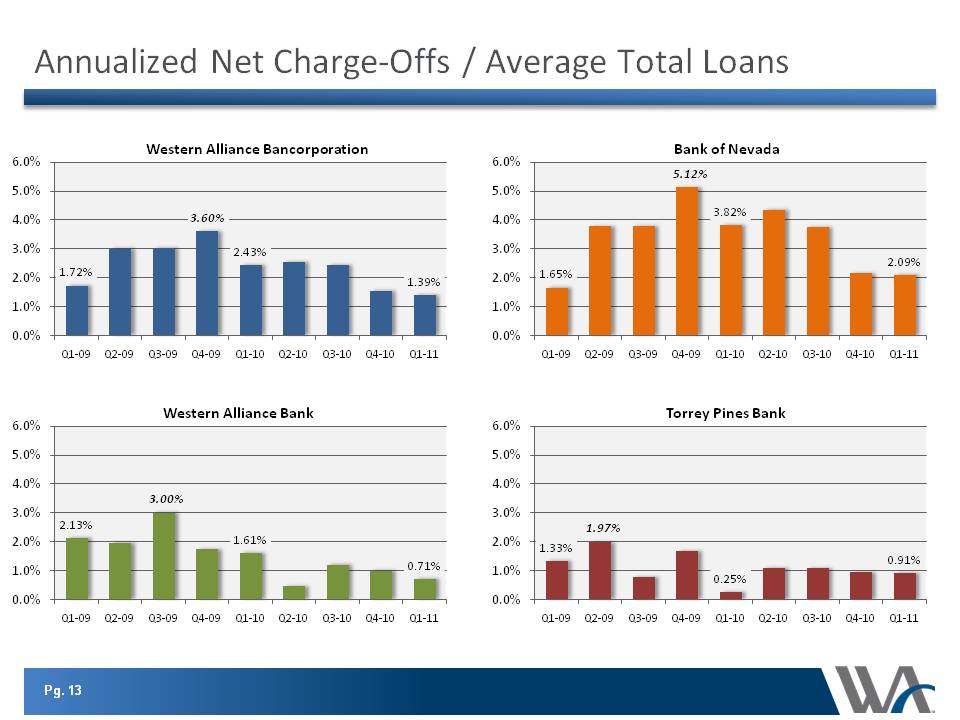
Annualized Net Charge-Offs / Average Total Loans Western Alliance Bancorporation 1.72% 3.60% 2.43% 1.39% Bank of Nevada 1.65% 5.12% 3.82% 2.09% Western Alliance Bank 2.13% 3.00% 1.61% 0.71% Torrey Pines Bank 1.33% 1.97% 0.25% 0.91% 6.0% 5.0% 4.0% 3.0% 2.0% 1.0% 0.0% Q1-09 Q2-09 Q3-09 Q4-09 Q1-10 Q2-10 Q3-10 Q4-10 Q1-11 6.0% 5.0% 4.0% 3.0% 2.0% 1.0% 0.0% Q1-09 Q2-09 Q3-09 Q4-09 Q1-10 Q2-10 Q3-10 Q4-10 Q1-11 6.0% 5.0% 4.0% 3.0% 2.0% 1.0% 0.0% Q1-09 Q2-09 Q3-09 Q4-09 Q1-10 Q2-10 Q3-10 Q4-10 Q1-11 6.0% 5.0% 4.0% 3.0% 2.0% 1.0% 0.0% Q1-09 Q2-09 Q3-09 Q4-09 Q1-10 Q2-10 Q3-10 Q4-10 Q1-11
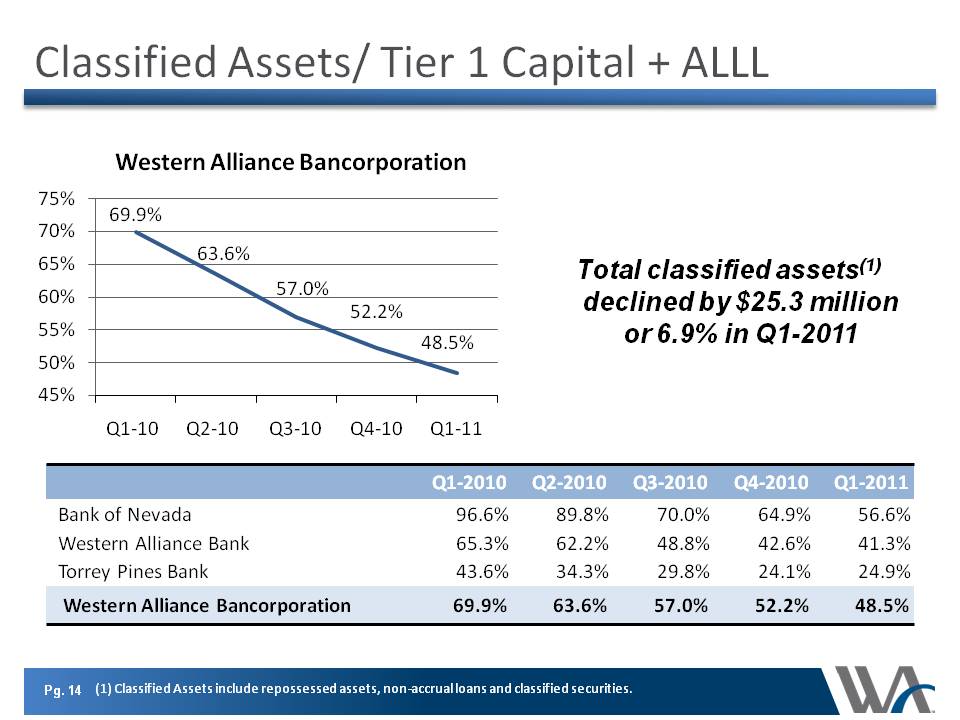
Classified Assets/ Tier 1 Capital + ALLL Western Alliance Bancorporation Total classified assets(1) declined by $25.3 million or 6.9% in Q1-2011 75% 70% 65% 60% 55% 50% 45% 69.9% 63.6% 57.0% 52.2% 48.5% Q1-10 Q2-10 Q3-10 Q4-10 Q1-11 Bank of Nevada 96.6% 89.8% 70.0% 64.9% 56.6% Western Alliance Bank 65.3% 62.2% 48.8% 42.6% 41.3% Torrey Pines Bank 43.6% 34.3% 29.8% 24.1% 24.9% Western Alliance Bancorporation 69.9% 63.6% 57.0% 52.2% 48.5% Q1-2010 Q2-2010 Q3-2010 Q4-2010 Q1-2011 (1) Classified Assets include repossessed assets, non-accrual loans and classified securities.
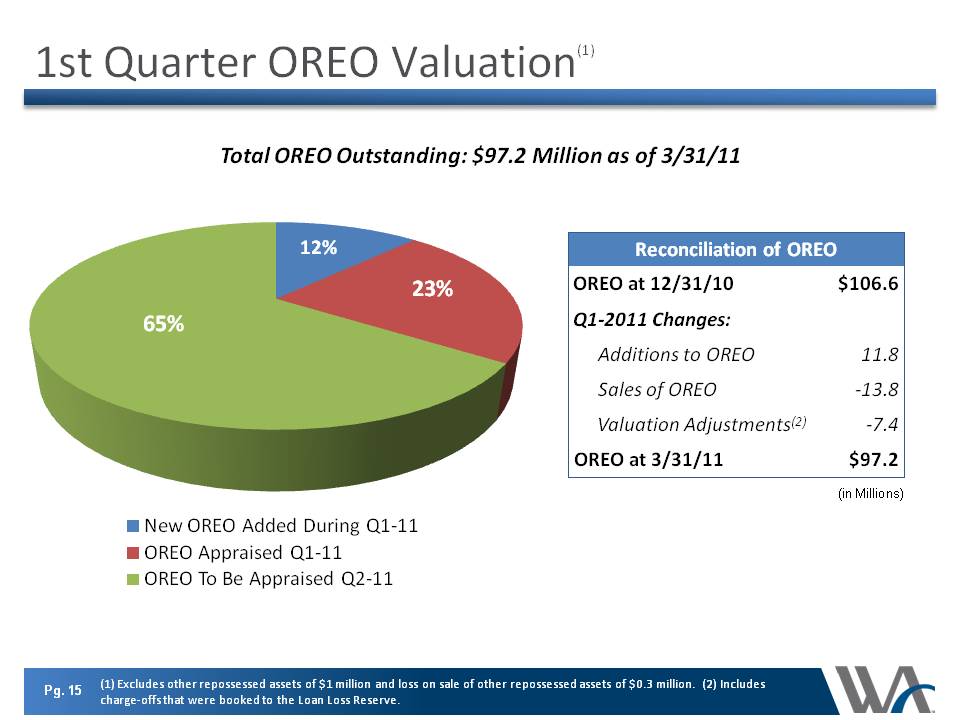
1st Quarter OREO Valuation(1) Total OREO Outstanding: $97.2 Million as of 3/31/11 (in Millions) Reconciliation of OREO OREO at 12/31/10 $106.6 Q1-2011 Changes: Additions to OREO 11.8 Sales of OREO -13.8 Valuation Adjustments(2) -7.4 OREO at 3/31/11 $97.2 65% 23% 12% New OREO Added During Q1-11 OREO Appraised Q1-11 OREO To Be Appraised Q2-11 (1) Excludes other repossessed assets of $1 million and loss on sale of other repossessed assets of $0.3 million. (2) Includes charge-offs that were booked to the Loan Loss Reserve.
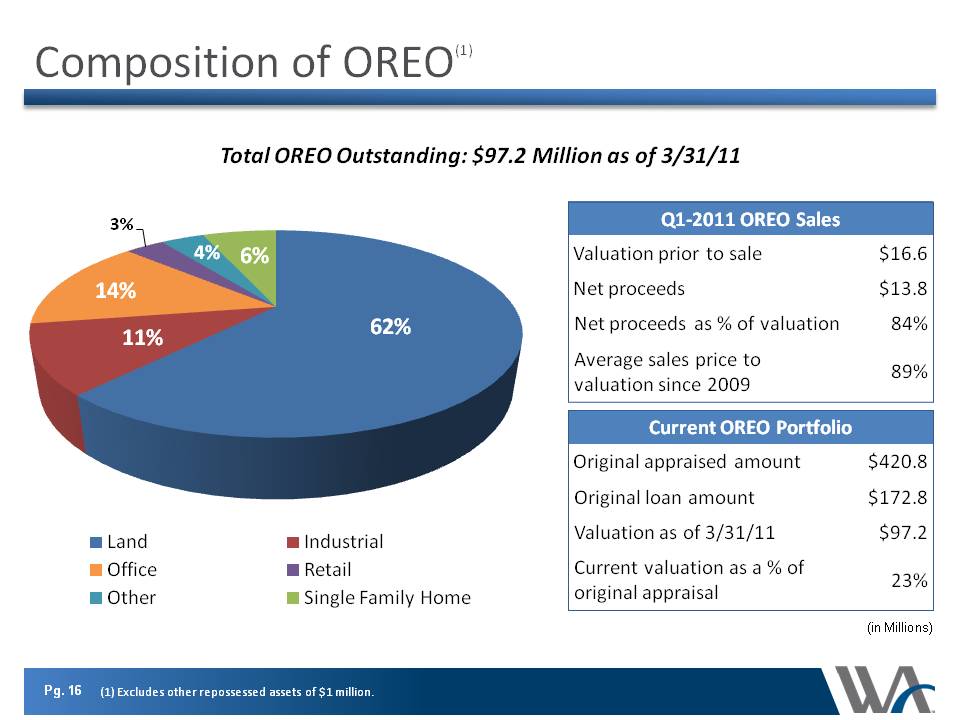
Composition of OREO(1) $1.3 Billion Total OREO Outstanding: $97.2 Million as of 3/31/11 (in Millions) Q1-2011 OREO Sales Valuation prior to sale $16.6 Net proceeds $13.8 Net proceeds as % of valuation 84% Average sales price to 89% valuation since 2009 Current OREO Portfolio Original appraised amount $420.8 Original loan amount $172.8 Valuation as of 3/31/11 $97.2 Current valuation as a % of 23% original appraisal 62% 14% 11% 6% 4% 3% Land Office Other Industrial Retail Single Family Home (1) Excludes other repossessed assets of $1 million.
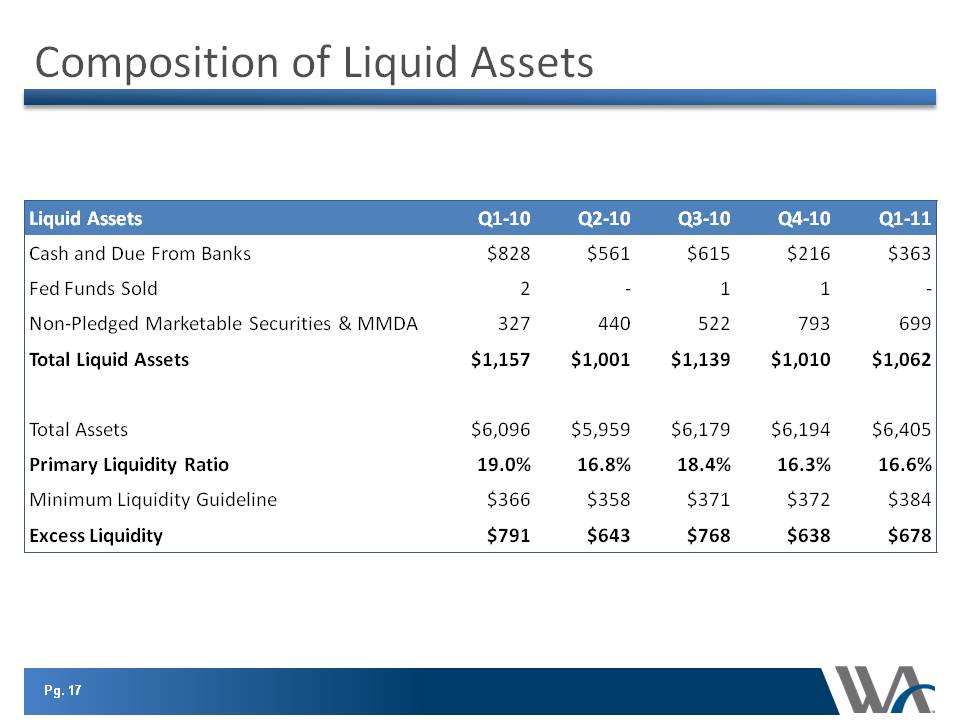
Composition of Liquid Assets Liquid Assets Cash and Due From Banks $828 $561 $615 $216 $363 Fed Funds Sold 2 - 1 1 - Non-Pledged Marketable Securities & MMDA 327 440 522 793 699 Total Liquid Assets $1,157 $1,001 $1,139 $1,010 $1,062 Total Assets $6,096 $5,959 $6,179 $6,194 $6,405 Primary Liquidity Ratio 19.0% 16.8% 18.4% 16.3% 16.6% Minimum Liquidity Guideline $366 $358 $371 $372 $384 Excess Liquidity $791 $643 $768 $638 $678 Q1-10 Q2-10 Q3-10 Q4-10 Q1-11
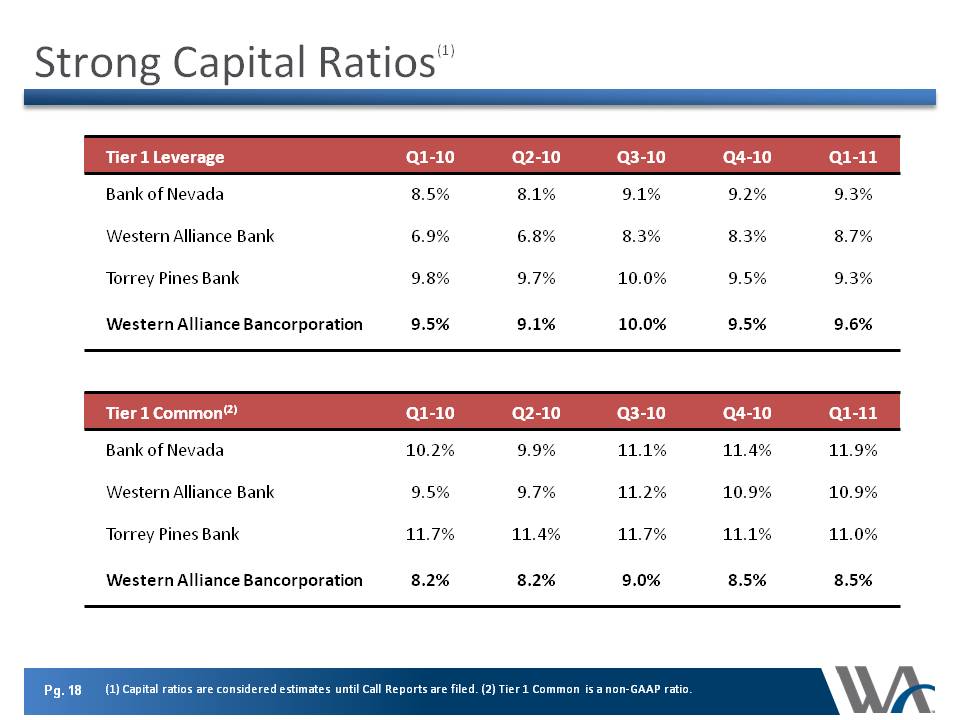
Strong Capital Ratios(1) Tier 1 Leverage Q1-10 Q2-10 Q3-10 Q4-10 Q1-11 Bank of Nevada 8.5% 8.1% 9.1% 9.2% 9.3% Western Alliance Bank 6.9% 6.8% 8.3% 8.3% 8.7% Torrey Pines Bank 9.8% 9.7% 10.0% 9.5% 9.3% Western Alliance Bancorporation 9.5% 9.1% 10.0% 9.5% 9.6% Tier 1 Common(2) Q1-10 Q2-10 Q3-10 Q4-10 Q1-11 Bank of Nevada 10.2% 9.9% 11.1% 11.4% 11.9% Western Alliance Bank 9.5% 9.7% 11.2% 10.9% 10.9% Torrey Pines Bank 11.7% 11.4% 11.7% 11.1% 11.0% Western Alliance Bancorporation 8.2% 8.2% 9.0% 8.5% 8.5% (1) Capital ratios are considered estimates until Call Reports are filed. (2) Tier 1 Common is a non-GAAP ratio.
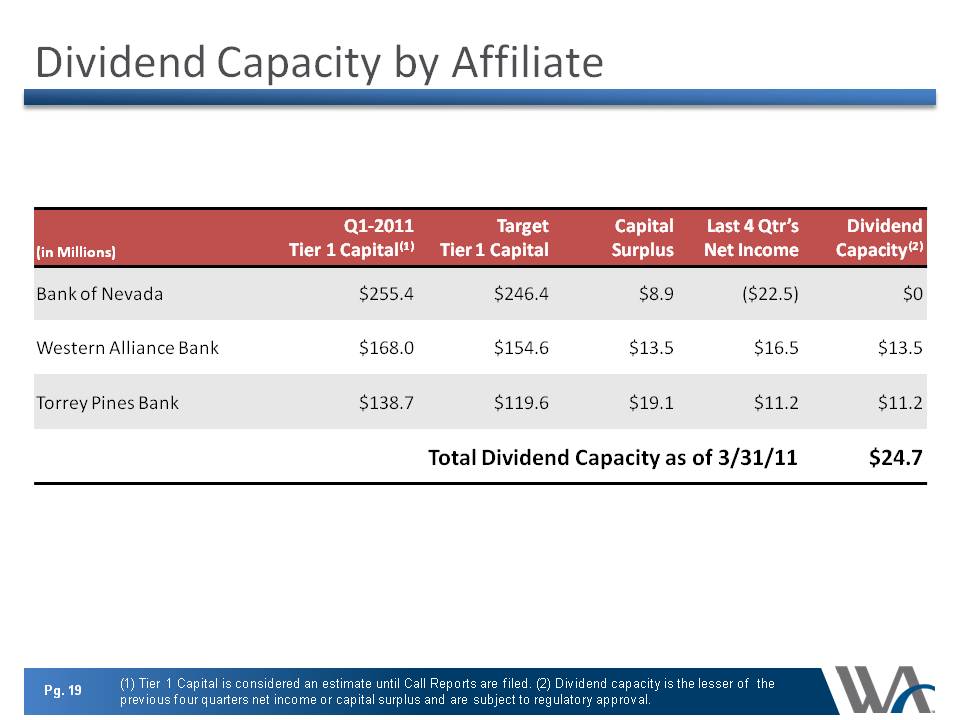
Dividend Capacity by Affiliate (in Millions) Q1-2011 Tier 1 Capital(1) Target Tier 1 Capital Capital Surplus Last 4 Qtr's Net Income Dividend Capacity(2) Bank of Nevada $255.4 $246.4 $8.9 ($22.5) $0 Western Alliance Bank $168.0 $154.6 $13.5 $16.5 $13.5 Torrey Pines Bank $138.7 $119.6 $19.1 $11.2 $11.2 Total Dividend Capacity as of 3/31/11 $24.7 (1) Tier 1 Capital is considered an estimate until Call Reports are filed. (2) Dividend capacity is the lesser of the previous four quarters net income or capital surplus and are subject to regulatory approval.
Performance Focus: Increase Earning Power Strong capital and ability to redeploy securities into loans to businesses Continuing deployment of excess liquidity Diversifying into municipal bonds Maximizing return on new deposit growth with real-time acquisition of securities Stable/expanding interest margin Normalization of NPA levels Expense reductions resulting from improvement in asset quality/economic recovery FDIC insurance OREO expenses and related valuation adjustments Legal and professional
Performance Focus: Improve Asset Quality Growing portfolio while reducing risk profile Moving up market and attracting stronger credits Loan grades on new loan relationships exceeds the current portfolio average Growth coming from stronger economic markets Reducing classified assets Incentivizing loan work-out and charge-off recovery teams to improve success rates Disposing and redeploying non-performing assets Proactively marketing OREO Increase in buyer activity Stepping down charge-offs
Performance Focus: Grow Market Share Four consecutive quarters of loan growth Targeting larger higher quality relationships Attracting and recruiting established, high performing business development teams from competitors Five consecutive quarters of deposit growth Leveraging off reduced competition from local bank failures Planned branch expansion in California Top four local market share position in Arizona, Nevada and San Diego Continuing to gain market share as the best “big bank” alternative in our markets