Attached files
| file | filename |
|---|---|
| 8-K - FORM 8-K - JOHNSON CONTROLS INC | c64298e8vk.htm |
| EX-99.1 - EX-99.1 - JOHNSON CONTROLS INC | c64298exv99w1.htm |
| April 25, 2011 FY 2011 second quarter Exhibit 99.2 |

| Agenda Introduction Glen Ponczak, Vice President, Investor Relations Overview Steve Roell, Chairman and Chief Executive Officer Business results and financial review Bruce McDonald, Executive Vice President and Chief Financial Officer Q&A (conclude at noon Eastern time) FORWARD-LOOKING STATEMENT Johnson Controls, Inc. has made forward-looking statements in this document pertaining to its financial results for fiscal 2011 and beyond that are based on preliminary data and are subject to risks and uncertainties. All statements, other than statements of historical fact, are statements that are, or could be, deemed "forward-looking" statements and include terms such as "outlook," "expectations," "estimates" or "forecasts." For those statements, the Company cautions that numerous important factors, such as automotive vehicle production levels, mix and schedules, customer or supplier disruptions, energy and commodity prices, the strength of the U.S. or other economies, currency exchange rates, cancellation of or changes to commercial contracts as well as other factors discussed in Item 1A of Part I of the Company's most recent Form 10-k filing (filed November 23, 2010) could affect the Company's actual results and could cause its actual consolidated results to differ materially from those expressed in any forward-looking statement made by, or on behalf of, the Company. 2 |
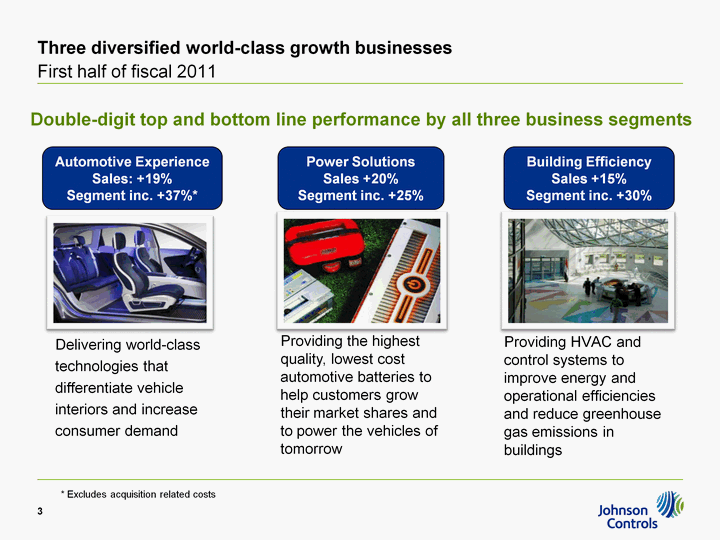
| Three diversified world-class growth businesses First half of fiscal 2011 Double-digit top and bottom line performance by all three business segments Automotive Experience Sales: +19% Segment inc. +37%* Building Efficiency Sales +15% Segment inc. +30% Power Solutions Sales +20% Segment inc. +25% Delivering world-class technologies that differentiate vehicle interiors and increase consumer demand Providing the highest quality, lowest cost automotive batteries to help customers grow their market shares and to power the vehicles of tomorrow Providing HVAC and control systems to improve energy and operational efficiencies and reduce greenhouse gas emissions in buildings * Excludes acquisition related costs 3 |
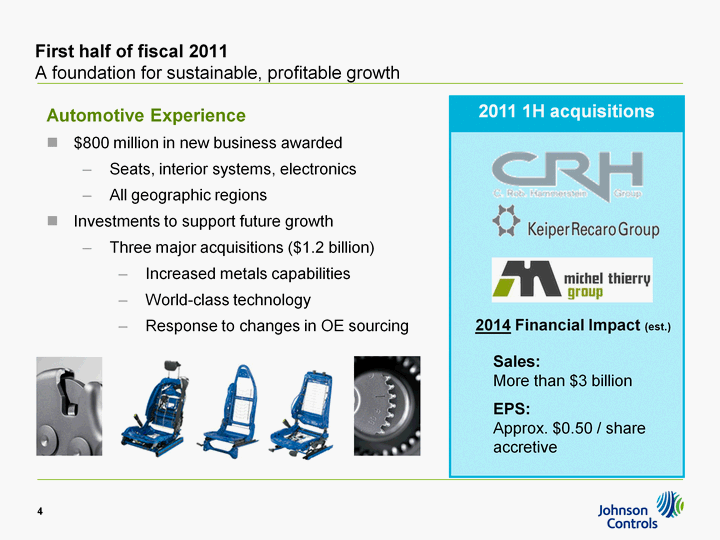
| 4 Automotive Experience $800 million in new business awarded Seats, interior systems, electronics All geographic regions Investments to support future growth Three major acquisitions ($1.2 billion) Increased metals capabilities World-class technology Response to changes in OE sourcing First half of fiscal 2011 A foundation for sustainable, profitable growth 2011 1H acquisitions Sales: More than $3 billionEPS: Approx. $0.50 / share accretive 2014 Financial Impact (est.) |
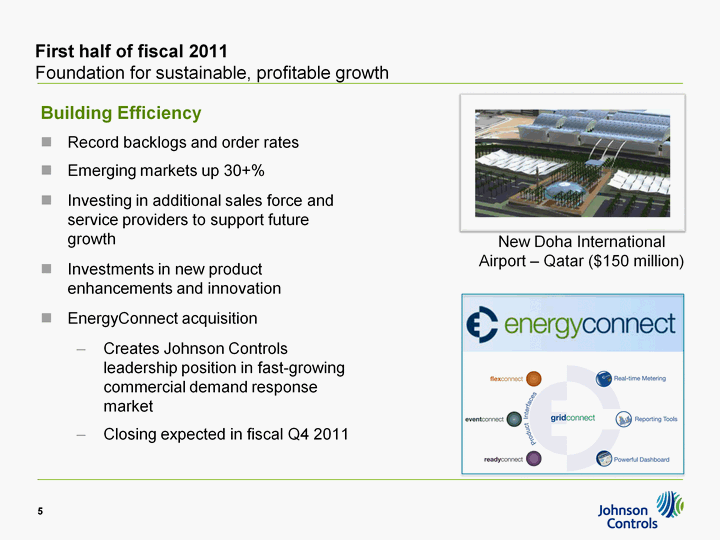
| 5 Building Efficiency Record backlogs and order rates Emerging markets up 30+% Investing in additional sales force and service providers to support future growth Investments in new product enhancements and innovation EnergyConnect acquisition Creates Johnson Controls leadership position in fast-growing commercial demand response market Closing expected in fiscal Q4 2011 First half of fiscal 2011 Foundation for sustainable, profitable growth New Doha International Airport - Qatar ($150 million) |
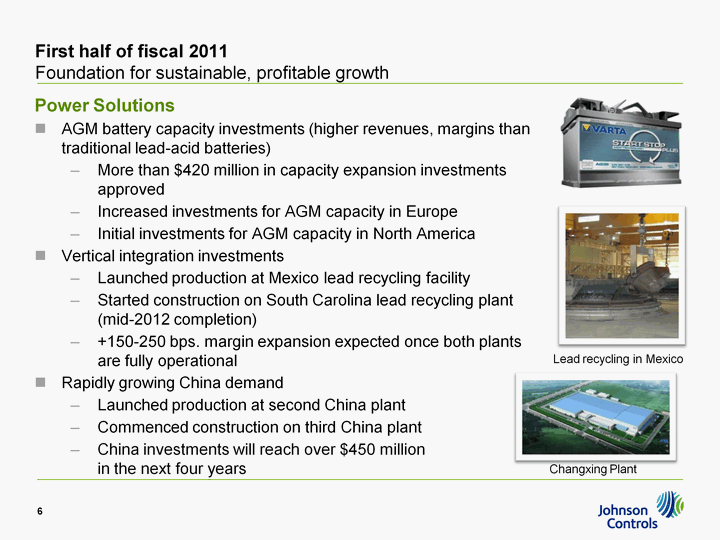
| 6 Power Solutions AGM battery capacity investments (higher revenues, margins than traditional lead-acid batteries) More than $420 million in capacity expansion investments approved Increased investments for AGM capacity in Europe Initial investments for AGM capacity in North America Vertical integration investments Launched production at Mexico lead recycling facility Started construction on South Carolina lead recycling plant (mid-2012 completion) +150-250 bps. margin expansion expected once both plants are fully operational Rapidly growing China demand Launched production at second China plant Commenced construction on third China plant China investments will reach over $450 million in the next four years First half of fiscal 2011 Foundation for sustainable, profitable growth Changxing Plant Lead recycling in Mexico |
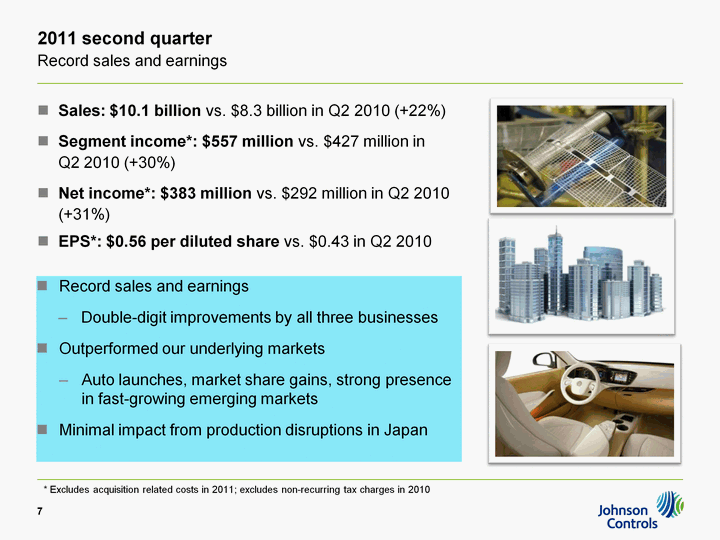
| 2011 second quarter Record sales and earnings Sales: $10.1 billion vs. $8.3 billion in Q2 2010 (+22%) Segment income*: $557 million vs. $427 million in Q2 2010 (+30%) Net income*: $383 million vs. $292 million in Q2 2010 (+31%) EPS*: $0.56 per diluted share vs. $0.43 in Q2 2010 Record sales and earnings Double-digit improvements by all three businesses Outperformed our underlying markets Auto launches, market share gains, strong presence in fast-growing emerging markets Minimal impact from production disruptions in Japan 7 * Excludes acquisition related costs in 2011; excludes non-recurring tax charges in 2010 |
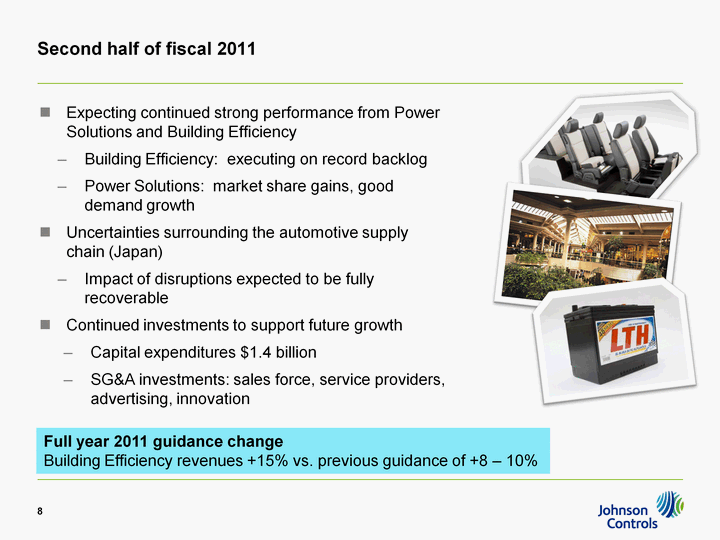
| Second half of fiscal 2011 Expecting continued strong performance from Power Solutions and Building Efficiency Building Efficiency: executing on record backlog Power Solutions: market share gains, good demand growth Uncertainties surrounding the automotive supply chain (Japan) Impact of disruptions expected to be fully recoverable Continued investments to support future growth Capital expenditures $1.4 billion SG&A investments: sales force, service providers, advertising, innovation 8 Full year 2011 guidance change Building Efficiency revenues +15% vs. previous guidance of +8 - 10% |

| 2011 second quarter Business results 9 |
| 2011 second quarter Automotive Experience 2011 2010 Net sales $5.2B $4.2B 25% North America +22% Europe +26% Asia +37% Includes two-week loss of production in Japan China sales (primarily non-consolidated) +31% to $979 million Segment income $247M* $189M 31% Higher volume, benefits of cost reduction initiatives Higher JV profitability in China Increased engineering expense Europe - containment costs starting to improve 10 Return on sales by geography N. America: 7.2%Europe: 2.0%*Asia: 8.5% Q2: 18 major launches 7 seating7 interior systems4 electronicsCustomers include: Daimler, Ford, Honda, Kia, Tata, VW * Excludes acquisition related costs in 2011 |
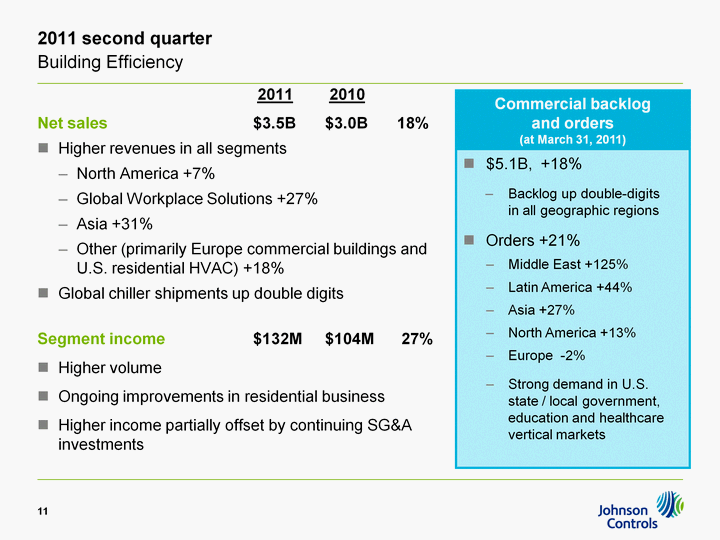
| 2011 second quarter Building Efficiency 2011 2010 Net sales $3.5B $3.0B 18% Higher revenues in all segments North America +7% Global Workplace Solutions +27% Asia +31% Other (primarily Europe commercial buildings and U.S. residential HVAC) +18% Global chiller shipments up double digits Segment income $132M $104M 27% Higher volume Ongoing improvements in residential business Higher income partially offset by continuing SG&A investments 11 Commercial backlog and orders(at March 31, 2011) $5.1B, +18%Backlog up double-digits in all geographic regionsOrders +21%Middle East +125%Latin America +44%Asia +27%North America +13%Europe -2%Strong demand in U.S. state / local government, education and healthcare vertical markets |
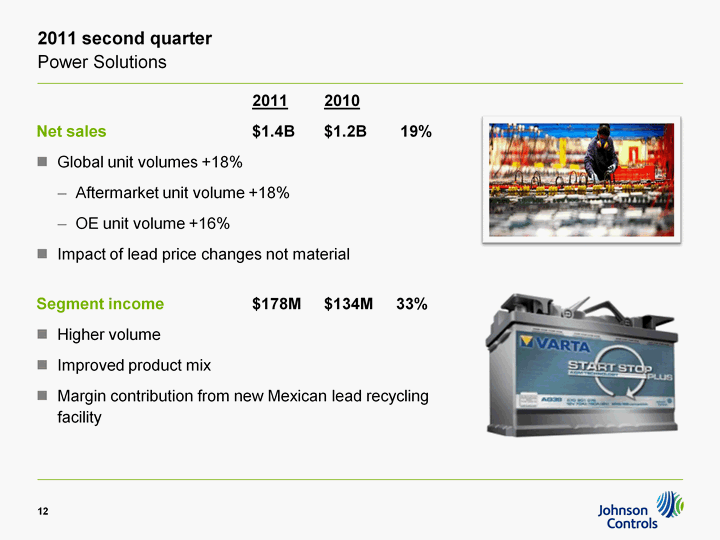
| 2011 second quarter Power Solutions 2011 2010 Net sales $1.4B $1.2B 19% Global unit volumes +18% Aftermarket unit volume +18% OE unit volume +16% Impact of lead price changes not material Segment income $178M $134M 33% Higher volume Improved product mix Margin contribution from new Mexican lead recycling facility 12 |
| 2011 second quarter Financial review 13 |
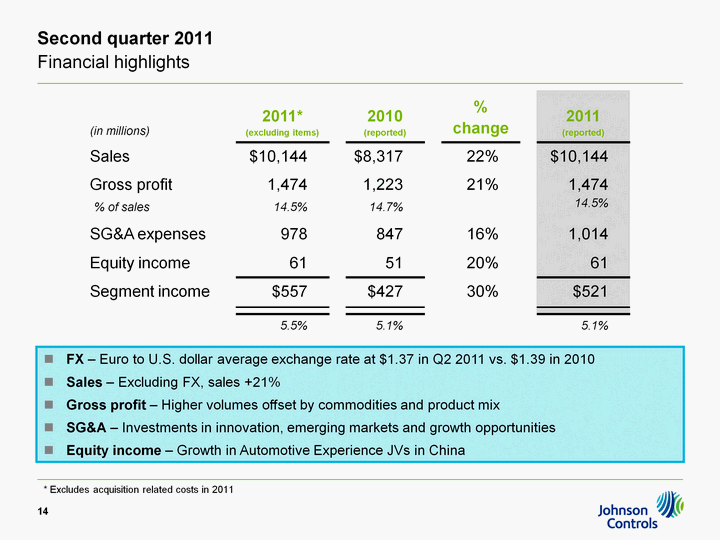
| Second quarter 2011 Financial highlights 14 14 FX - Euro to U.S. dollar average exchange rate at $1.37 in Q2 2011 vs. $1.39 in 2010Sales - Excluding FX, sales +21%Gross profit - Higher volumes offset by commodities and product mix SG&A - Investments in innovation, emerging markets and growth opportunitiesEquity income - Growth in Automotive Experience JVs in China * Excludes acquisition related costs in 2011 |
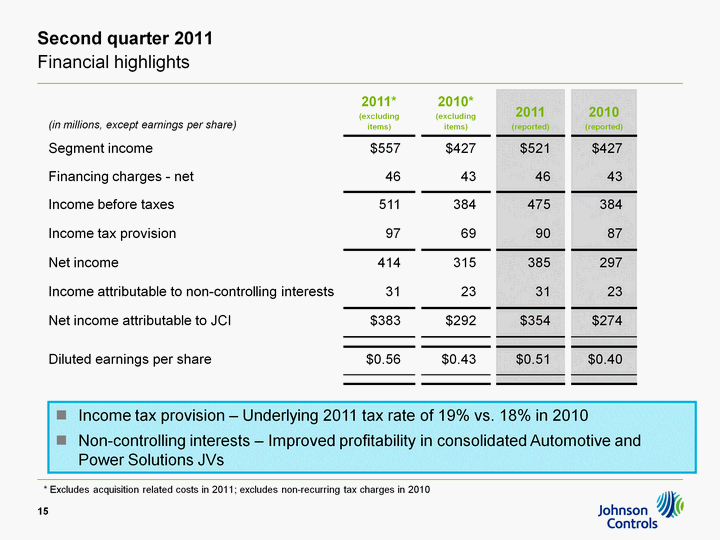
| Second quarter 2011 Financial highlights Income tax provision - Underlying 2011 tax rate of 19% vs. 18% in 2010Non-controlling interests - Improved profitability in consolidated Automotive and Power Solutions JVs 15 15 * Excludes acquisition related costs in 2011; excludes non-recurring tax charges in 2010 |
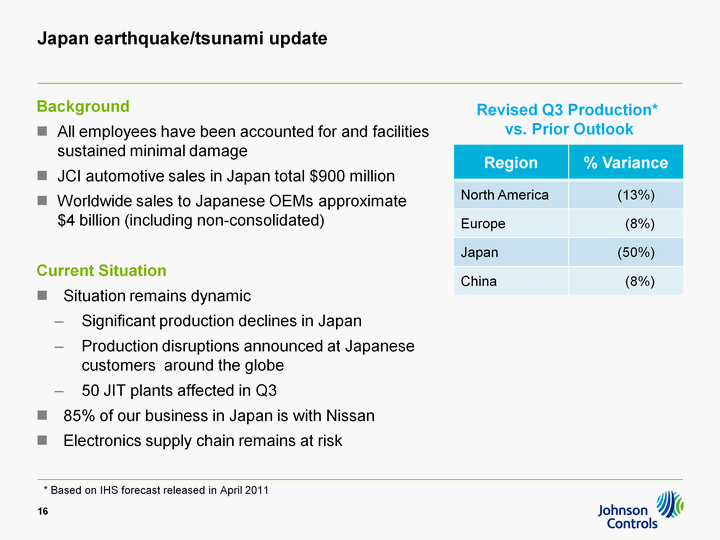
| Japan earthquake/tsunami update Background All employees have been accounted for and facilities sustained minimal damage JCI automotive sales in Japan total $900 million Worldwide sales to Japanese OEMs approximate $4 billion (including non-consolidated) Current Situation Situation remains dynamic Significant production declines in Japan Production disruptions announced at Japanese customers around the globe 50 JIT plants affected in Q3 85% of our business in Japan is with Nissan Electronics supply chain remains at risk 16 Region % Variance North America (13%) Europe (8%) Japan (50%) China (8%) Revised Q3 Production* vs. Prior Outlook * Based on IHS forecast released in April 2011 |
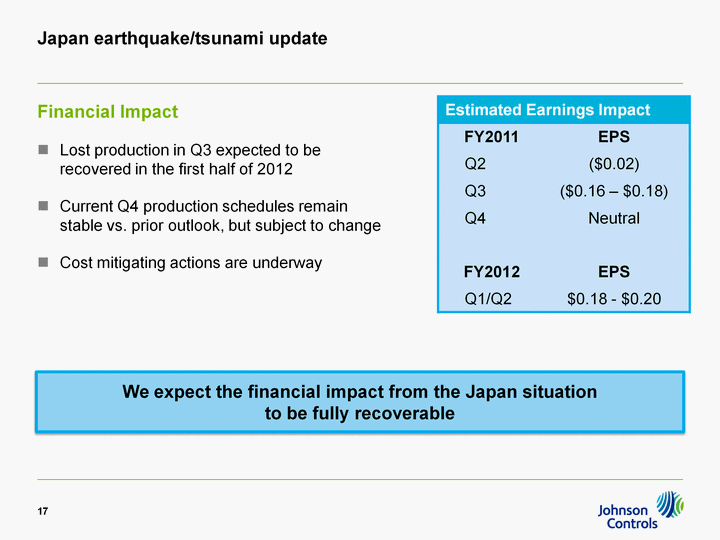
| 17 Japan earthquake/tsunami update Estimated Earnings Impact Estimated Earnings Impact FY2011 EPS Q2 ($0.02) Q3 ($0.16 - $0.18) Q4 Neutral FY2012 EPS Q1/Q2 $0.18 - $0.20 Financial Impact Lost production in Q3 expected to be recovered in the first half of 2012 Current Q4 production schedules remain stable vs. prior outlook, but subject to change Cost mitigating actions are underway We expect the financial impact from the Japan situation to be fully recoverable |
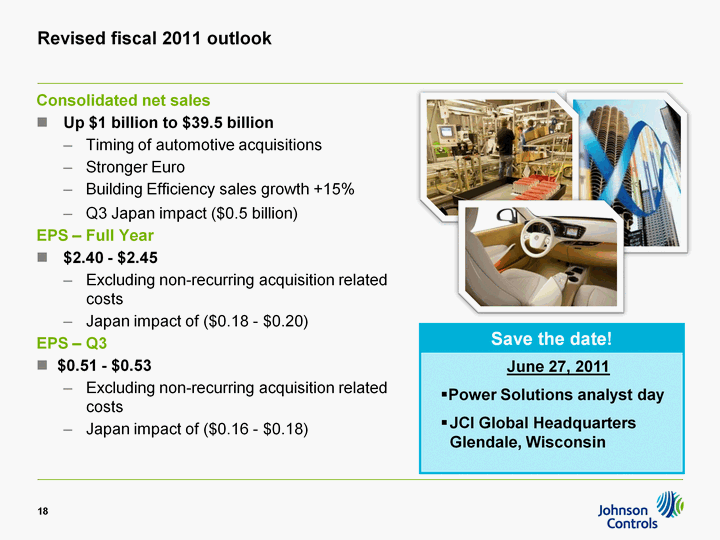
| Revised fiscal 2011 outlook Consolidated net sales Up $1 billion to $39.5 billion Timing of automotive acquisitions Stronger Euro Building Efficiency sales growth +15% Q3 Japan impact ($0.5 billion) EPS - Full Year $2.40 - $2.45 Excluding non-recurring acquisition related costs Japan impact of ($0.18 - $0.20) EPS - Q3 $0.51 - $0.53 Excluding non-recurring acquisition related costs Japan impact of ($0.16 - $0.18) 18 Save the date! June 27, 2011Power Solutions analyst dayJCI Global Headquarters Glendale, Wisconsin |