Attached files
| file | filename |
|---|---|
| 8-K - FORM 8-K - People's United Financial, Inc. | d8k.htm |
| EX-99.1 - EARINGS PRESS RELEASE DATED 4/20/2011 - People's United Financial, Inc. | dex991.htm |
 1
st
Quarter 2011 Earnings Conference Call
April 20, 2011
Exhibit 99.2
*
*
*
*
*
*
*
*
*
*
*
* |
 1
Certain statements contained in this release are forward-looking in nature.
These include all statements about People's United Financial's plans,
objectives, expectations and other statements that are not historical facts,
and usually use words such as "expect," "anticipate," "believe" and similar expressions.
Such statements represent management's current beliefs, based upon information
available at the time the statements are made, with regard to the matters
addressed. All forward-looking statements are subject to risks and
uncertainties that could cause People's United Financial's actual results or financial condition
to differ materially from those expressed in or implied by such statements. Factors
of particular importance to People’s United Financial include, but are
not limited to: (1) changes in general, national or regional economic
conditions; (2) changes in interest rates; (3) changes in loan default and charge-off rates; (4)
changes in deposit levels; (5) changes in levels of income and expense in
non-interest income and expense related activities; (6) residential
mortgage and secondary market activity; (7) changes in accounting and
regulatory guidance applicable to banks; (8) price levels and conditions in the public
securities markets generally; (9) competition and its effect on pricing, spending,
third-party relationships and revenues; (10) the successful integration
of acquired companies; and (11) possible changes in regulation resulting
from or relating to recently enacted financial reform legislation. People's United
Financial does not undertake any obligation to update or revise any
forward-looking statements, whether as a result of new information,
future events or otherwise. Forward Looking Statement
|
 2
Operating earnings of $53.8 million, or $0.15 per share
Net interest margin of 4.16%; up 29 bps from Q4 2010
Total loan growth of $195MM or 4.5% linked-quarter annualized
Deposit growth of $177MM or 3.9% linked-quarter annualized
Strong non-interest income
Efficiency ratio improved to 66.2%
NPAs as a percentage of originated loans, REO and repossessed assets
fell to 1.96% from 2.09% as of Q4 2010
Proxy
statement/prospectus
mailed
to
Danvers
shareholders
on
April
8
th
and
the
Danvers
shareholder
vote
has
been
set
for
May
13
th
First Quarter 2011 Results
Overview |
 3
Kirk Walters hired as Chief Financial Officer effective March 16th. He is
also a member of the Board at both the holding company and the bank
Expanding asset-based and multi-family lending activities
Boston: deposits at de novo branches grew $29MM in 1Q11, strong
1Q11 loan bookings and 2Q11 pipeline
Long Island: 7% core deposit growth since acquisition close, healthy
residential and home equity originations, booking C&I loans
Increased dividend to $0.63/share annually. Dividend yield is ~4.9%
Repurchased $60.7 million of stock in 1Q11 (4.6 million shares at an
average price of $13.09)
Recent Initiatives |
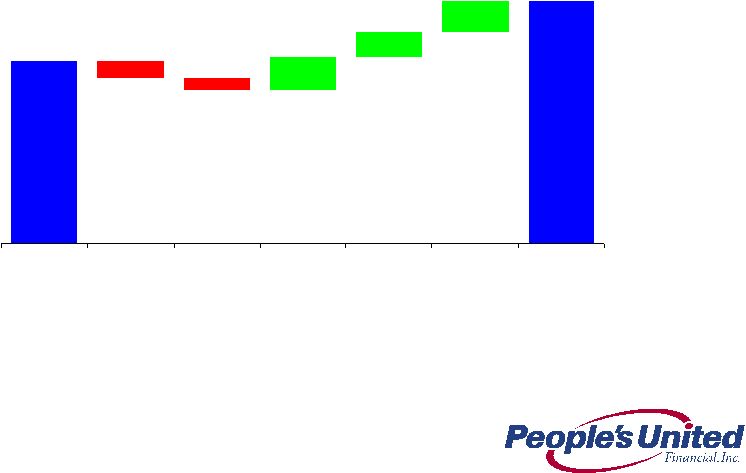 4
Net Interest Margin
Linked Quarter Change
4
3.87%
4.16%
-0.08%
-0.06%
0.16%
0.12%
0.15%
Q4 2010
Margin
Hedge Income
Decrease
Calendar Days
PUEF
Accretion
Adjustment
Investment Mix
& Yield
Full Quarter
Smithtown &
River
Q1 2011
Margin |
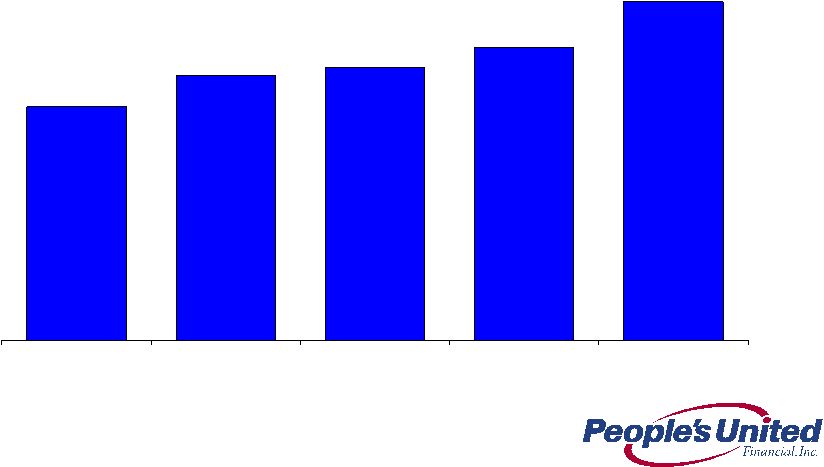 5
Net Interest Margin
Last Five Quarters
5
3.49%
3.69%
3.74%
3.87%
4.16%
1Q 2010
2Q 2010
3Q 2010
4Q 2010
1Q 2011 |
 6
Loans
Linked Quarter Change
(in $ millions)
6
Annualized
Linked Quarter Change:
11.0%
12.3%
(30.3%)
Originated Annualized
Linked Quarter Change:
11.4%
Total Annualized
Linked Quarter Change:
4.5%
17,328
277
136
(218)
17,523
Dec 31, 2010
Commercial
Banking
Retail & Business
Banking
Acquired
Mar 31, 2011 |
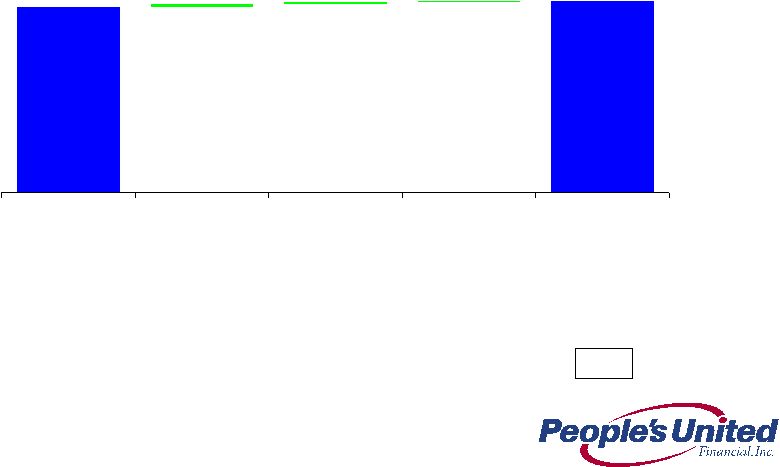 7
Deposits
Linked Quarter Change
(in $ millions)
7
Annualized
Linked Quarter Change:
2.1%
64.9%
5.9%
Total Annualized
Linked Quarter Change:
3.9%
17,933
18,110
34
63
80
Dec 31, 2010
Legacy
De Novo
Acquired
Mar 31, 2011 |
 8
Non-interest income
Linked Quarter Change
(in $ millions)
1Q11
4Q10
Q-o-Q (%)
Investment management fees
$8.2
$7.9
4%
Insurance revenue
7.9
6.9
14%
Brokerage commissions
3.2
2.9
10%
Total wealth management
19.3
17.7
9%
Bank service charges
31.0
30.7
1%
Net gain on sales of loans
5.5
0.0
NM
Net gain on sales of res. mtg loans
3.1
4.2
(26%)
Bank owned life insurance
1.2
1.0
20%
Merchant services income, net
1.0
1.1
(9%)
Net security gains (losses)
0.1
(1.0)
NM
Other non-interest income
13.4
14.4
(7%)
Total non-interest income
$74.6
$68.1
10%
$5.5MM of gains on non-performing loan sales from the acquired
Smithtown portfolio, full quarter contribution from Smithtown and
RiverBank, strength across the board in wealth management
|
 9
Non-interest expenses increased just 2% over 4Q10 in spite of a full
quarter of Smithtown and RiverBank expenses
Non-Interest Expense
Linked Quarter Change
(in $ millions)
1Q11
4Q10
Q-o-Q (%)
Compensation & Benefits
$105.4
$98.3
7%
Occupancy & Equipment
33.1
28.1
18%
Prof. and outside services
15.9
19.8
(20%)
Amort. of acq. related intangibles
5.9
6.1
(3%)
Merger-related expenses
3.1
4.8
(35%)
Other non-interest expense
39.4
42.0
(6%)
Total non-interest expense
$202.8
$199.1
2% |
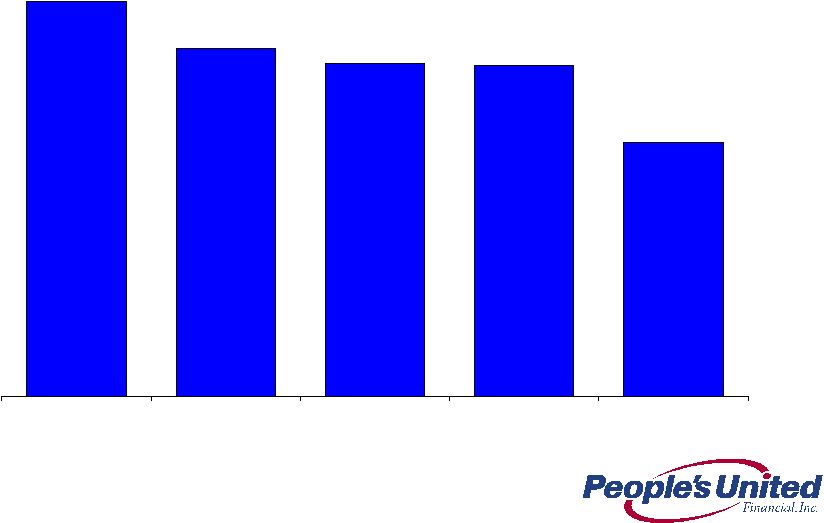 10
Efficiency Ratio
Historical Trend
75%
72%
71%
71%
66%
1Q 2010
2Q 2010
3Q 2010
4Q 2010
1Q 2011 |
 11
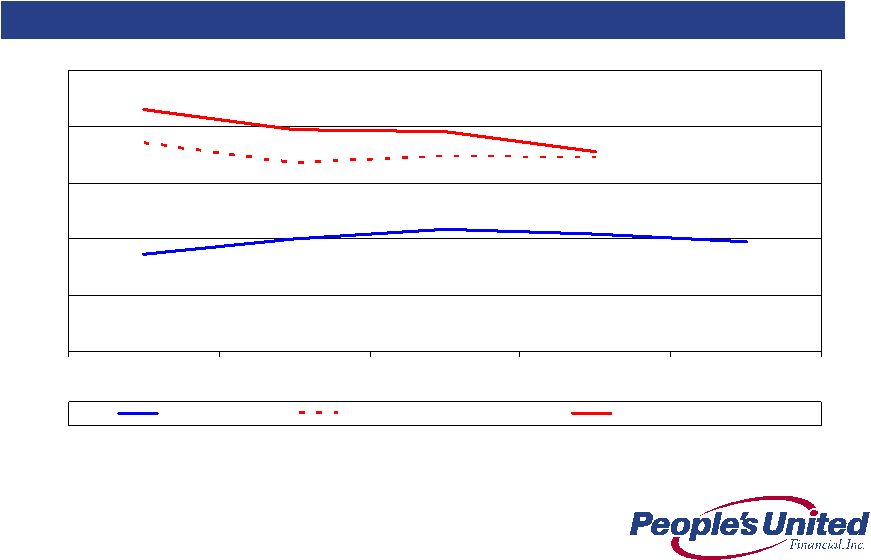
Last Five Quarters
1.96
2.09
3.46
3.55
0.00
1.00
2.00
3.00
4.00
5.00
Q1 2010
Q2 2010
Q3 2010
Q4 2010
Q1 2011
PBCT
Peer Group Median
Top 50 Banks by Assets
Asset Quality
NPAs / Loans & REO* (%)
*
Non-performing
assets
(excluding
acquired
non-performing
loans)
as
a
percentage
of
originated
loans
plus
all
REO
and
repossessed
assets;
acquired
non-performing
loans
excluded
as
risk
of
loss
has
been
considered
by
virtue
of
our
estimate
of
acquisition-date
fair
value
and/or
the
existence
of
an
FDIC
loss
sharing
agreement
Source: SNL Financial and Company filings |
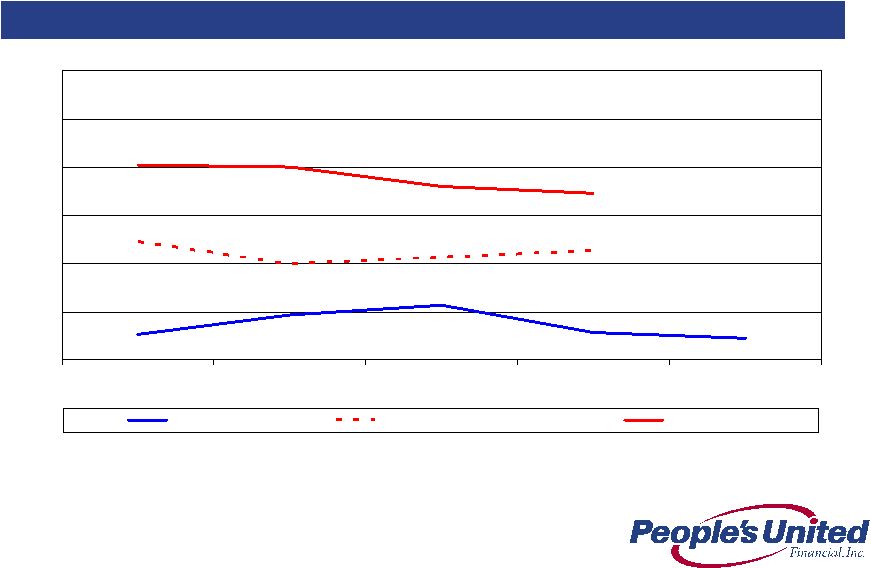 12
Last Five Quarters
0.22
0.28
1.13
1.73
0.00
0.50
1.00
1.50
2.00
2.50
3.00
Q1 2010
Q2 2010
Q3 2010
Q4 2010
Q1 2011
PBCT
Peer Group Mean
Top 50 Banks
Asset Quality
Net Charge-Offs / Avg. Loans (%)
Source: SNL Financial and Company filings |
 13
Allowance for Loan Losses
Coverage Detail
(in $ millions)
1Q11
ALLL
% of
Originated
Loans
% of
Originated
NPLs
CRE
$78.4
1.57%
109%
C&I
60.5
1.56%
124%
Equipment Finance
26.8
1.84%
69%
Residential
6.3
0.25%
9%
Home Equity
3.0
0.16%
29%
Other Consumer
2.5
1.30%
576%
Total
$177.5
1.19%
74%
Commercial Banking
$165.7
1.61%
104%
Retail Banking
11.8
0.26%
15% |
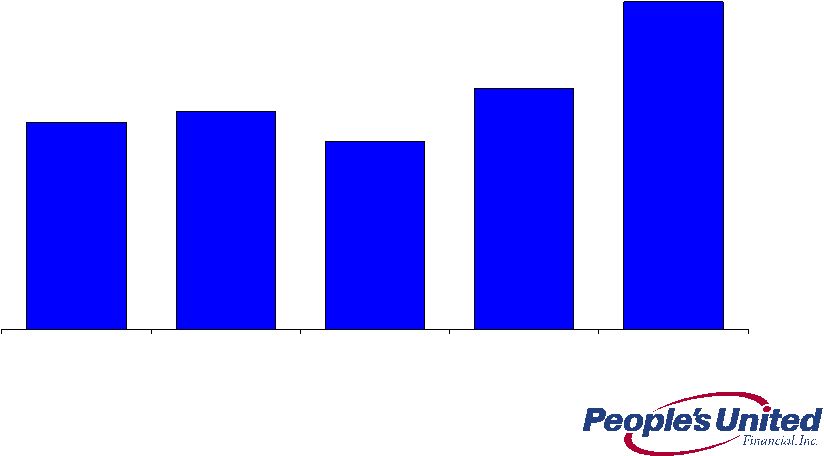 14
Operating ROAA Progress
Last Five Quarters
0.55%
0.58%
0.50%
0.64%
0.87%
1Q 2010
2Q 2010
3Q 2010
4Q 2010
1Q 2011 |
 15
Capital Deployment
Primary
focus
is
to
deploy
capital
via
organic
growth
–
“new
markets,
new
products, cross-sell”
Announced an increase to our dividend (19th consecutive annual dividend
increase), our dividend yield is ~4.9%
Repurchased $61MM of stock in 1Q11 at a weighted average price of $13.09
Prohibited from repurchasing shares until the Danvers Bancorp deal
closes
Acquisitions
Danvers Bancorp shareholder vote set for May 13th
Building
relationships
with
banks
$1BN
-
$20BN
in
asset
size
Maintaining price discipline in light of challenging industry conditions
|
 16
Summary
Premium brand built over 169 years
High quality Northeast footprint characterized by wealth, density and
commercial activity
Strengthened leadership team
Low cost of deposits
Strong net interest margin
Superior asset quality
Focus on relationship-based banking
Growing
loans
and
deposits
within
footprint
-
in
two
of
the
largest
MSAs
in
the country (New York City, #1 and Boston, #10)
Significantly more asset sensitive than peers
Pro forma tangible common equity ratio of ~12%
Sustainable Competitive Advantage |
 Q
& A *
*
*
*
*
*
*
*
*
*
*
*
*
*
*
*
*
*
*
*
*
*
*
* |
 Appendix
*
*
*
*
*
*
*
*
*
*
*
* |
 19
We
expect
that
interest
rates
will
not
rise
in
2011.
However,
we
do
expect
rates
to
rise
in
2012 and beyond
Given short term interest rates are so low and are expected to remain low for the near
term, we have added to our securities portfolio
For Q4 2010 we were 3.5x –
4.5x as asset sensitive as the estimated median of our
peers
For every 100bps increase in the Fed Funds rate, our net interest income is
projected to increase by ~$40MM on an annualized basis
Notes:
1.
Analysis is as of 12/31/10 filings
2.
Data as of 12/31/10 SEC filings, where exact +100bps shock up scenario data was not
provided PBCT interpolated based on data disclosed 3.
Data as of 12/31/10 filings, where exact +200bps shock up scenario data was
not provided PBCT interpolated based on data disclosed Asset
Sensitivity Net Interest Income at Risk ¹
Analysis involves PBCT estimates, see notes below
Change in Net Interest Income
Scenario
Lowest
Amongst Peers
Highest
Amongst Peers
Peer Median
PBCT Multiple to
Peer Median
Shock Up
100bps ²
-0.7%
5.6%
1.0%
3.5x
Shock Up
200bps ³
-1.0%
11.2%
2.4%
4.5x |
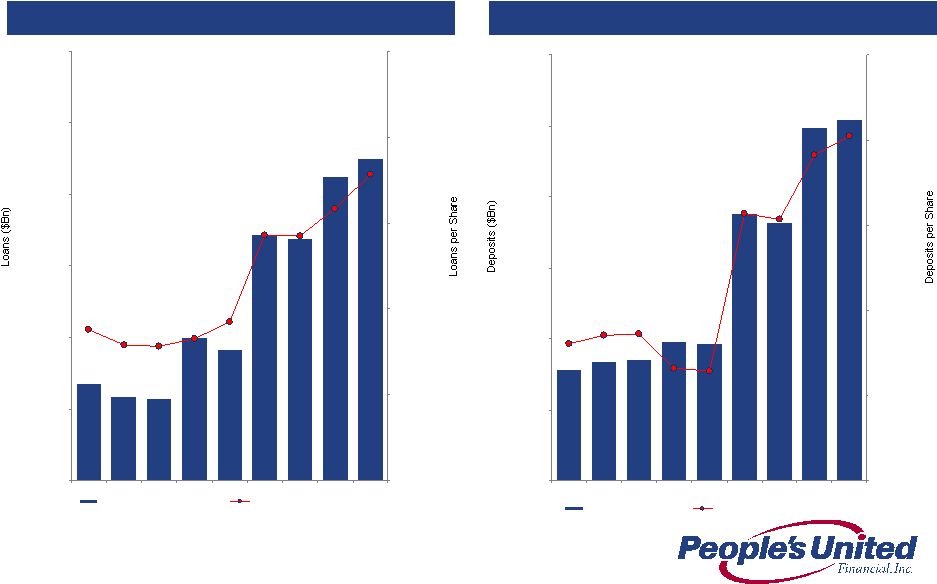 20
Loans
Deposits
Growing Future Earnings Per Share
Loans and Deposits per Share
* Pro forma for FIF acquisition
* *Pro forma for SMTB & LSBX acquisitions
**
*Pro
forma
for
DNBK
acquisition
$12.5
$14.0
$15.5
$17.0
$18.5
$20.0
$21.5
1Q09
2Q09
3Q09
4Q09*
1Q10
2Q10**
3Q10**
4Q10***
1Q11***
$35.00
$40.00
$45.00
$50.00
$55.00
$60.00
Gross Loans ($Bn)
Loans per share
$12.5
$14.0
$15.5
$17.0
$18.5
$20.0
$21.5
1Q09
2Q09
3Q09
4Q09*
1Q10
2Q10**
3Q10**
4Q10***
1Q11***
$35.00
$40.00
$45.00
$50.00
$55.00
$60.00
Deposits ($Bn)
Deposits per share |
 For
more information, investors may contact: Peter Goulding, CFA
203-338-6799
peter.goulding@peoples.com
*
*
*
*
*
*
*
*
*
*
*
* |