Attached files
| file | filename |
|---|---|
| EX-99.1 - EXHIBIT 991 - NEWFIELD EXPLORATION CO /DE/ | ex991.htm |
| 8-K - FORM 8-K - NEWFIELD EXPLORATION CO /DE/ | nfx8k-042011.htm |
Exhibit 99.2

@NFX is periodically published to keep shareholders aware of current operating activities at Newfield. It may include estimates of expected production volumes, costs and expenses, recent changes to hedging positions and commodity pricing.
April 20, 2011
Newfield today released financial and operational results for the first quarter 2011. The earnings and operational release can be found on our website.
This edition of @NFX includes:
|
·
|
An update on production guidance and capital investments for 2011
|
|
·
|
Updates on some key oil and “liquids-rich” developments
|
|
·
|
Second quarter and full-year 2011 estimates
|
|
·
|
Updated tables detailing complete hedge positions. Items highlighted reflect new and/or changed data since our last publication on February 16, 2011
|
2011 PRODUCTION GUIDANCE AND CAPITAL INVESTMENTS
2011 Production
Newfield’s production guidance for 2011 remains 312 – 323 Bcfe, an estimated increase of 8 – 12% over 2010 volumes. Second quarter 2011 production will be negatively impacted due to deferred production from Newfield’s non-operated Abu field, located on PM 318 offshore Malaysia. The field is currently off-line due to a mechanical failure associated with FPSO operations. Repairs to the system are expected to take 60-90 days. Newfield estimates that the impact to its second quarter net oil production will be a reduction of approximately 0.2 MMBbls, which is included in its second quarter guidance (found in this publication) as well as within the Company’s unchanged production forecast for the full year.
2011 Capital Investments, Asset Sales
Newfield today increased its 2011 capital budget to $1.9 billion from its original budget of $1.7 billion. The budget excludes capitalized interest and overhead and the planned second quarter closing of the Company’s previously announced $308 million acquisition in the Uinta Basin. The increase in expenditures is substantially offset by increased cash flow from operations as a result of higher oil price realizations. The increase in planned investments is primarily related to the following:
|
·
|
New and ongoing leasing of acreage in an undisclosed resource play
|
|
·
|
Increased service and labor costs throughout the Company’s areas of operation
|
|
·
|
Efficiency gains in drilling
|
|
·
|
Capital investments in the Uinta Basin associated with the previously announced Uinta Basin acquisition
|
1
Newfield is in the process of selling certain non-strategic domestic assets. The planned sales are expected to be completed in the second half of 2011. The Company expects that proceeds will exceed $200 million.
KEY OPERATIONAL UPDATES
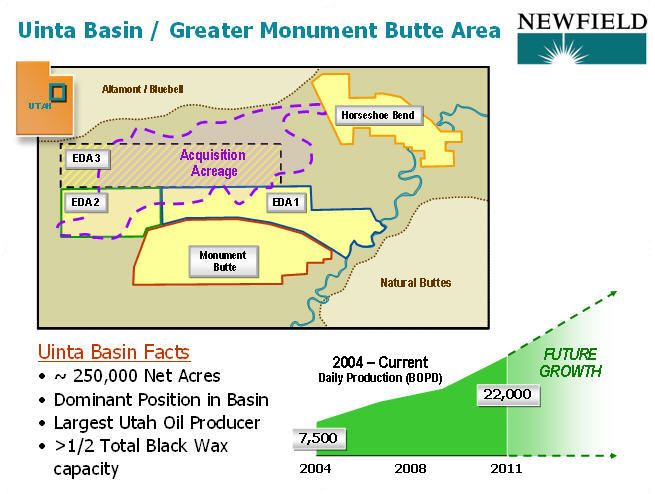
Greater Monument Butte Field Area – We continue to run five operated rigs in the Uinta Basin. Our first quarter sales from the region averaged approximately 18,200 BOPD (net) as field inventory levels were drawn down to near-normal operating levels.
During the first quarter, we announced the signing of two separate transactions to acquire assets in the Uinta Basin from Harvest Natural Resources and an unnamed private company for $308 million. The transactions will add approximately 70,000 net acres in the Uinta Basin. The acreage is largely undeveloped and located adjacent and north of Monument Butte. The transactions are expected to close in the second quarter of 2011 pending customary closing processes.
In addition, we recently executed a third Exploration and Development Agreement adding approximately 11,000 net Tribal acres. Upon closing of these transactions, we will own interest in approximately 250,000 net acres in the Uinta Basin.
2
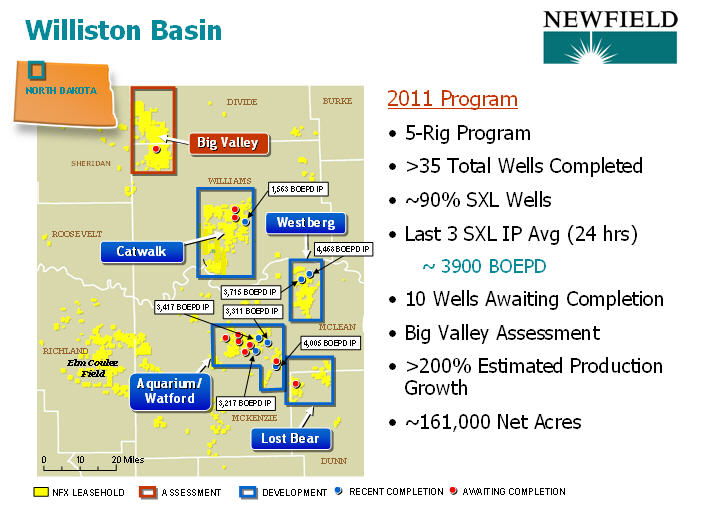
Williston Basin – We are currently running five operated drilling rigs in the Williston Basin. Our net production is about 5,000 BOEPD and we have 10 wells in various stages of completion (average lateral length is approximately 8,600’). Dedicated fracture stimulation services arrived in the field in April and completions are underway with initial volumes from the new wells expected late in the second quarter of 2011.
Substantially all of our planned wells in 2011 are super extended lateral (SXLs) wells. Three horizontal wells were recently completed with an average initial gross production rate (24-hour) of ~ 3,900 BOEPD. A recent best in class completion had an initial IP rate of 4,400 BOEPD gross.
We have approximately 161,000 net acres in the Williston Basin.
3
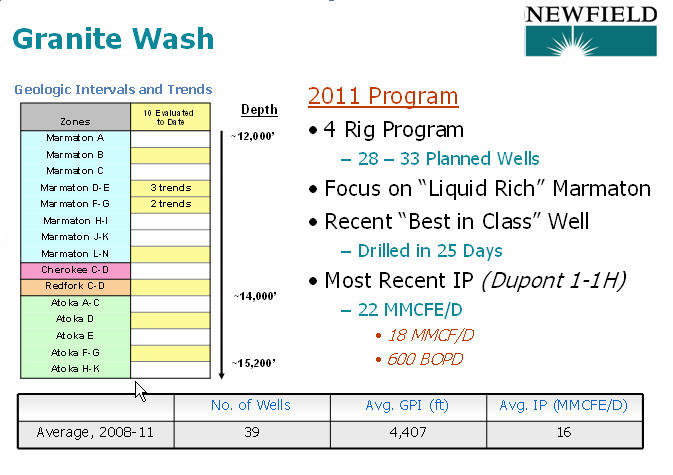
Granite Wash – We continue to run a four-rig program in the Granite Wash, located primarily in Wheeler County, Texas. To date, we have completed 39 wells in the play with gross initial production averaging approximately 16 MMcfe/d (24-hour rate). We have successfully assessed 10 geologic intervals and additional prospective horizons remain. We expect to drill 28 – 33 wells in 2011 and to grow production more than 20%. Current net production from the area is approximately 110 MMcfe/d.
Our 2011 Granite Wash program is focused on the “liquid rich” geologic intervals within the play. Since 2009, we have completed 21 wells in the high BTU Marmaton formations with initial 24-hour rates averaging over 17 MMcfe/d gross. Recent Marmaton completions include: the Dupont1-1H with gross initial production of 22 MMcfe/d and the Britt Ranch G44W-14H with gross initial production of 22 MMcfe/d. We continue to make efficiency gains in our drilling programs and a recent “best in class” 4,700’ lateral well was drilled and cased in 25 days.
Over the last year, we have added more than 10,000 net acres in the Granite Wash play. Assessment of new areas is planned for the second half of 2011.
4
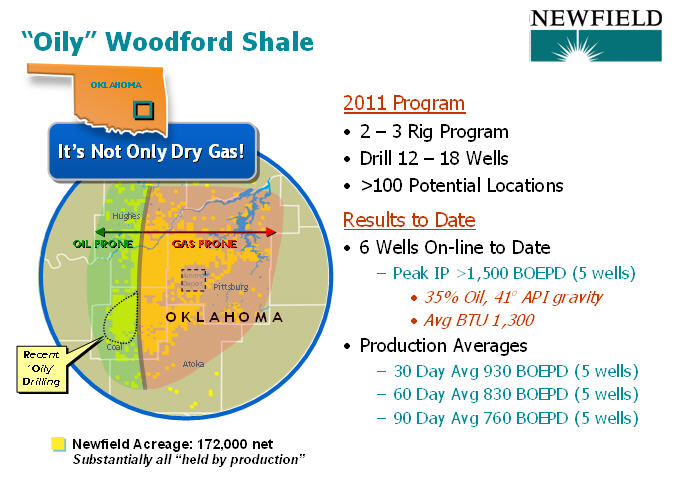
Woodford Shale – Our activities in the Arkoma Basin are substantially focused on the “oily Woodford.” This relatively new play for us is prospective on approximately 15% of our 172,000 net acres in the basin. For 2011, we plan to run 2-3 operated rigs in the Arkoma Basin.
Our six most recent “oily Woodford” wells have an average lateral length of approximately 8,700’. The peak initial gross production rates of five of these wells averaged more than 1,500 BOEPD and their 30-day average rate was 930 BOEPD. We have an approximate 96% working interest in these wells.
5
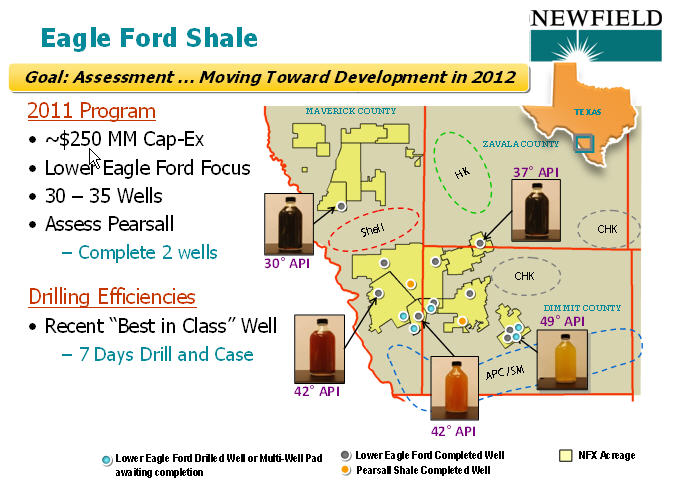
Eagle Ford Shale – We are running 2-3 operated rigs and continue to assess our 335,000 net acre position in the Maverick Basin (approximate 85% working interest). In October 2010, our drilling and completion operations in the basin ceased due to seasonal hunting stipulations. Our activities resumed in February 2011. Contracted fracture stimulation services are in the field and five wells have been drilled and are planned for completion in the second quarter of 2011.
Our recent wells have lateral lengths of approximately 5,000’ and are averaging less than 10 days to drill and case. Efficiency gains in drilling have reduced drill and case costs to less than $2 million (gross) per well. Completion services remain tight throughout the Eagle Ford Shale and are averaging $4.5 – $5.0 million gross per well.
6
SECOND QUARTER AND FULL YEAR 2011 ESTIMATES
|
2Q11 & FY11 Estimates
|
|||||||
|
Domestic
|
Int’l
|
Total
|
|||||
|
Production/Liftings
|
2QE
|
FY11
|
2QE
|
FY11
|
2QE
|
FY11
|
|
|
Natural gas – Bcf
|
47 – 49
|
191 – 194
|
–
|
–
|
47 – 49
|
191 – 194
|
|
|
Oil, condensate and NGLs – MMBbls
|
2.9 – 3.5
|
14.0 – 15.0
|
1.1 – 1.4
|
6.1 – 6.5
|
4.0 – 4.9
|
20.1 – 21.5
|
|
|
Total Bcfe
|
64 – 70
|
275 – 284
|
7 – 8
|
37 – 39
|
71 – 78
|
312 – 323
|
|
|
Average Realized Prices
|
|||||||
|
Natural gas – $/Mcf
|
Note 1
|
Note 1
|
|||||
|
Oil, condensate and NGLs – $/Bbl
|
Note 2
|
Note 2
|
Note 3
|
Note 3
|
|||
|
Mcf equivalent – $/Mcfe
|
|||||||
|
Operating Expenses (per Mcfe):
|
|||||||
|
Lease Operating
|
|||||||
|
Recurring
|
$0.71 - $0.79
|
$0.69 - $0.77
|
$1.90 - $2.16
|
$1.66 - $1.93
|
$0.83 - $0.92
|
$0.76 - $0.85
|
|
|
Major (workovers, etc.)
|
$0.24 - $0.29
|
$0.16 - $0.21
|
$1.91 - $2.26
|
$0.62 - $0.78
|
$0.41 - $0.49
|
$0.21 - $0.28
|
|
|
Transportation
|
$0.34 - $0.38
|
$0.35 - $0.39
|
-
|
-
|
$0.31 - $0.34
|
$0.31 - $0.34
|
|
|
Production/Taxes Note 4
|
$0.39 - $0.44
|
$0.33 - $0.40
|
$5.04 - $6.89
|
$4.71 - $5.31
|
$0.86 - $1.09
|
$0.85 - $0.99
|
|
|
G&A, net
|
$0.60 - $0.63
|
$0.62 - $0.67
|
$0.22 - $0.25
|
$0.15 - $0.17
|
$0.56 - $0.59
|
$0.57 - $0.61
|
|
|
Capitalized internal costs
|
($0.34 - $0.39)
|
($0.32 - $0.36)
|
|||||
|
Interest Expense
|
$0.51 - $0.56
|
$0.48 - $0.53
|
|||||
|
Capitalized Interest
|
($0.21 - $0.24)
|
($0.18 - $0.22)
|
|||||
|
Tax rate (%)Note 5
|
36% - 38%
|
36% - 38%
|
|||||
|
Income taxes (%)
|
|||||||
|
Current
|
18% - 22%
|
18% - 22%
|
|||||
|
Deferred
|
78% - 82%
|
78% - 82%
|
|||||
|
Note 1:
|
The price that the Company receives for natural gas production from the Gulf of Mexico and onshore Gulf Coast, after basis differentials, transportation and handling charges, typically averages $0.25 - $0.50 per MMBtu less than the Henry Hub Index. Realized natural gas prices for our Mid-Continent properties, after basis differentials, transportation and handling charges, typically average 88-92% of the Henry Hub Index.
|
||||||
|
Note 2:
|
The price the Company receives for its Gulf Coast oil production, excluding NGLs, typically averages about 93-97% of the NYMEX West Texas Intermediate (WTI) price. The price the Company receives for its oil production in the Rocky Mountains, excluding NGLs, is currently averaging about $15-$17 per barrel below the WTI price. Oil production from the Company’s Mid-Continent properties, excluding NGLs, typically averages 90-95% of the WTI price.
|
||||||
|
Note 3:
|
Oil sales from the Company’s operations in Malaysia typically sell at a slight discount to Tapis, or today about 105-110% of WTI. Oil sales from the Company’s operations in China typically sell at a premium of up to $4 per barrel greater than the WTI price.
|
||||||
|
Note 4:
|
Guidance for production taxes determined using the average of the strip at 04/11/11 ($111.19/bbl, $4.36/mcf).
|
||||||
|
Note 5:
|
Tax rate applied to earnings excluding unrealized gains or losses on commodity derivatives.
|
||||||
7
NATURAL GAS HEDGE POSITIONS
Please see the tables below for our complete hedging positions.
The following hedge positions for the second quarter of 2011 and beyond are as of April 19, 2011:
|
Second Quarter 2011
|
|||||||
|
Weighted Average
|
Range
|
||||||
|
Volume
|
Fixed
|
Collars
|
Floor
|
Ceiling
|
|||
|
24,570 MMMBtus
|
$6.30
|
—
|
—
|
—
|
|||
|
10,010 MMMBtus*
|
—
|
$6.00 — $7.91
|
$6.00
|
$7.75 — $8.03
|
|||
|
Third Quarter 2011
|
|||||||
|
Weighted Average
|
Range
|
||||||
|
Volume
|
Fixed
|
Collars
|
Floor
|
Ceiling
|
|||
|
24,840 MMMBtus
|
$6.30
|
—
|
—
|
—
|
|||
|
10,120 MMMBtus*
|
—
|
$6.00 — $7.91
|
$6.00
|
$7.75 — $8.03
|
|||
|
Fourth Quarter 2011
|
|||||||
|
Weighted Average
|
Range
|
||||||
|
Volume
|
Fixed
|
Collars
|
Floor
|
Ceiling
|
|||
|
12,030 MMMBtus
|
$6.03
|
—
|
—
|
—
|
|||
|
17,440 MMMBtus*
|
—
|
$5.86 — $7.37
|
$5.50 — $6.00
|
$6.60 — $8.03
|
|||
|
First Quarter 2012
|
|||||||
|
Weighted Average
|
Range
|
||||||
|
Volume
|
Fixed
|
Collars
|
Floor
|
Ceiling
|
|||
|
5,460 MMMBtus
|
$5.42
|
—
|
—
|
—
|
|||
|
22,750 MMMBtus*
|
—
|
$5.59 — $6.55
|
$5.00 — $6.00
|
$5.20 — $7.10
|
|||
|
Second Quarter 2012
|
|||||||
|
Weighted Average
|
Range
|
||||||
|
Volume
|
Fixed
|
Collars
|
Floor
|
Ceiling
|
|||
|
5,460 MMMBtus
|
$5.42
|
—
|
—
|
—
|
|||
|
22,750 MMMBtus*
|
—
|
$5.44 — $6.26
|
$5.00 — $5.75
|
$5.20 — $7.00
|
|||
|
Third Quarter 2012
|
|||||||
|
Weighted Average
|
Range
|
||||||
|
Volume
|
Fixed
|
Collars
|
Floor
|
Ceiling
|
|||
|
5,520 MMMBtus
|
$5.42
|
—
|
—
|
—
|
|||
|
23,000 MMMBtus*
|
—
|
$5.44 — $6.26
|
$5.00 — $5.75
|
$5.20 — $7.00
|
|||
|
Fourth Quarter 2012
|
|||||||
|
Weighted Average
|
Range
|
||||||
|
Volume
|
Fixed
|
Collars
|
Floor
|
Ceiling
|
|||
|
1,860 MMMBtus
|
$5.42
|
—
|
—
|
—
|
|||
|
15,070 MMMBtus*
|
—
|
$5.51 — $6.41
|
$5.00 — $6.00
|
$5.20 — $7.55
|
|||
|
First Quarter 2013
|
|||||||
|
Weighted Average
|
Range
|
||||||
|
Volume
|
Fixed
|
Collars
|
Floor
|
Ceiling
|
|||
|
4,500 MMMBtus
|
$5.33
|
—
|
—
|
—
|
|||
|
10,800 MMMBtus*
|
—
|
$5.58 — $6.89
|
$5.00 — $6.00
|
$6.00 — $7.55
|
|||
8
|
Second Quarter 2013
|
|||||||
|
Weighted Average
|
Range
|
||||||
|
Volume
|
Fixed
|
Collars
|
Floor
|
Ceiling
|
|||
|
4,550 MMMBtus
|
$5.33
|
—
|
—
|
—
|
|||
|
10,920 MMMBtus*
|
—
|
$5.44 — $6.36
|
$5.00 — $5.75
|
$6.00 — $6.65
|
|||
|
Third Quarter 2013
|
|||||||
|
Weighted Average
|
Range
|
||||||
|
Volume
|
Fixed
|
Collars
|
Floor
|
Ceiling
|
|||
|
4,600 MMMBtus
|
$5.33
|
—
|
—
|
—
|
|||
|
11,040 MMMBtus*
|
—
|
$5.44 — $6.36
|
$5.00 — $5.75
|
$6.00 — $6.65
|
|||
|
Fourth Quarter 2013
|
|||||||
|
Weighted Average
|
Range
|
||||||
|
Volume
|
Fixed
|
Collars
|
Floor
|
Ceiling
|
|||
|
4,600 MMMBtus
|
$5.33
|
—
|
—
|
—
|
|||
|
6,770 MMMBtus*
|
—
|
$5.24 — $6.20
|
$5.00 — $5.75
|
$6.00 — $6.65
|
|||
*These 3-way collar contracts are standard natural gas collar contracts with respect to the periods, volumes and prices stated above. The contracts have floor and ceiling prices per MMMBtu as per the table above until the price drops below a weighted average price of $4.27 per MMMBtu. Below $4.27 per MMMBtu, these contracts effectively result in realized prices that are on average $1.31 per MMMBtu higher than the cash price that otherwise would have been realized.
The following table details the expected increase (decrease) to pre-tax income from the settlement of our derivative contracts, outlined above, at various NYMEX gas prices.
|
Gas Prices
|
|||||||
|
$4
|
$5
|
$6
|
$7
|
$8
|
$9
|
||
|
2011 (in millions)
|
|||||||
|
2nd Quarter
|
$71
|
$42
|
$7
|
($17)
|
($43)
|
($77)
|
|
|
3rd Quarter
|
$72
|
$42
|
$8
|
($17)
|
($43)
|
($78)
|
|
|
4th Quarter
|
$48
|
$27
|
$ -
|
($14)
|
($35)
|
($64)
|
|
|
Total 2011
|
$191
|
$111
|
$15
|
($48)
|
($121)
|
($219)
|
|
|
2012 (in millions)
|
|||||||
|
1st Quarter
|
$35
|
$16
|
($7)
|
($19)
|
($47)
|
($75)
|
|
|
2nd Quarter
|
$31
|
$12
|
($7)
|
($26)
|
($54)
|
($82)
|
|
|
3rd Quarter
|
$32
|
$12
|
($7)
|
($26)
|
($54)
|
($83)
|
|
|
4th Quarter
|
$20
|
$9
|
($4)
|
($14)
|
($29)
|
($46)
|
|
|
Total 2012
|
$118
|
$49
|
($25)
|
($85)
|
($184)
|
($286)
|
|
|
2013 (in millions)
|
|||||||
|
1st Quarter
|
$20
|
$8
|
($3)
|
($12)
|
($24)
|
($39)
|
|
|
2nd Quarter
|
$19
|
$6
|
($3)
|
($14)
|
($30)
|
($46)
|
|
|
3rd Quarter
|
$19
|
$6
|
($3)
|
($15)
|
($30)
|
($46)
|
|
|
4th Quarter
|
$13
|
$3
|
($3)
|
($13)
|
($25)
|
($36)
|
|
|
Total 2013
|
$71
|
$23
|
($12)
|
($54)
|
($109)
|
($167)
|
|
In the Rocky Mountains, we hedged basis associated with approximately 8 Bcf of our natural gas production from April 2011 through December 2012 to lock in the differential at a weighted average of $0.93 per MMBtu less than the Henry Hub Index. In total, this hedge and the 8,000 MMBtu per day we have sold on a fixed physical basis for the same period results in an average basis hedge of $0.92 per MMBtu less than the Henry Hub Index.
9
In the Mid-Continent, we hedged basis associated with approximately 3 Bcf of our anticipated Stiles/Britt Ranch natural gas production from April 2011 through August 2011. In total, this hedge and the 30,000 MMBtu per day we have sold on a fixed physical basis for the same period results in an average basis hedge of $0.52 per MMBtu less than the Henry Hub Index. We have also hedged basis associated with approximately 23 Bcf of our natural gas production from this area for the period September 2011 through December 2012 at an average of $0.55 per MMBtu less than the Henry Hub Index.
Approximately 15% of our natural gas production correlates to Houston Ship Channel, 15% to Columbia Gulf, 14% to Texas Gas Zone 1, 12% to Southern Natural Gas, 4% to Tetco ELA, 3% to Tenn 100, 5% to CenterPoint/East, 18% to Panhandle Eastern Pipeline, 4% to Waha, 5% to Colorado Interstate, and 5% to others.
CRUDE OIL HEDGE POSITIONS
The following hedge positions for the second quarter of 2011 and beyond are as of April 19, 2011:
|
Second Quarter 2011
|
|||||||
|
Weighted Average
|
Range
|
||||||
|
Volume
|
Fixed
|
Collars
|
Floor
|
Ceiling
|
|||
|
910,000 Bbls
|
$81.51
|
—
|
—
|
—
|
|||
|
1,729,000 Bbls*
|
—
|
$ 82.37 — $112.28
|
$75.00 — $100.00
|
$102.25 — $129.75
|
|||
|
Third Quarter 2011
|
|||||||
|
Weighted Average
|
Range
|
||||||
|
Volume
|
Fixed
|
Collars
|
Floor
|
Ceiling
|
|||
|
920,000 Bbls
|
$81.51
|
—
|
—
|
—
|
|||
|
1,748,000 Bbls*
|
—
|
$ 82.37 — $112.28
|
$75.00 — $100.00
|
$102.25 — $129.75
|
|||
|
Fourth Quarter 2011
|
|||||||
|
|
Weighted Average
|
Range
|
|||||
|
Volume
|
Fixed
|
Collars
|
Floor
|
Ceiling
|
|||
|
920,000 Bbls
|
$81.51
|
—
|
—
|
—
|
|||
|
1,932,000 Bbls*
|
—
|
$ 81.67 — $111.68
|
$75.00 — $100.00
|
$102.25 — $129.75
|
|||
|
First Quarter 2012
|
|||||||
|
Weighted Average
|
Range
|
||||||
|
Volume
|
Fixed
|
Collars
|
Floor
|
Ceiling
|
|||
|
546,000 Bbls
|
$82.27
|
—
|
—
|
—
|
|||
|
2,639,000 Bbls*
|
—
|
$ 83.10 — $115.50
|
$75.00 — $100.00
|
$106.30 — $137.80
|
|||
|
Second Quarter 2012
|
|||||||
|
Weighted Average
|
Range
|
||||||
|
Volume
|
Fixed
|
Collars
|
Floor
|
Ceiling
|
|||
|
546,000 Bbls
|
$82.27
|
—
|
—
|
—
|
|||
|
2,639,000 Bbls*
|
—
|
$ 83.10 — $115.50
|
$75.00 — $100.00
|
$106.30 — $137.80
|
|||
|
Third Quarter 2012
|
|||||||
|
Weighted Average
|
Range
|
||||||
|
Volume
|
Fixed
|
Collars
|
Floor
|
Ceiling
|
|||
|
552,000 Bbls
|
$82.27
|
—
|
—
|
—
|
|||
|
2,668,000 Bbls*
|
—
|
$ 83.10 — $115.50
|
$75.00 — $100.00
|
$106.30 — $137.80
|
|||
10
|
Fourth Quarter 2012
|
|||||||
|
Weighted Average
|
Range
|
||||||
|
Volume
|
Fixed
|
Collars
|
Floor
|
Ceiling
|
|||
|
552,000 Bbls
|
$82.27
|
—
|
—
|
—
|
|||
|
2,668,000 Bbls*
|
—
|
$ 83.10 — $115.50
|
$75.00 — $100.00
|
$106.30 — $137.80
|
|||
|
First Quarter 2013
|
|||||||
|
Weighted Average
|
Range
|
||||||
|
Volume
|
Fixed
|
Collars
|
Floor
|
Ceiling
|
|||
|
1,170,000 Bbls*
|
—
|
$ 80.00 — $110.54
|
$80.00
|
$109.50 — $111.40
|
|||
|
Second Quarter 2013
|
|||||||
|
Weighted Average
|
Range
|
||||||
|
Volume
|
Fixed
|
Collars
|
Floor
|
Ceiling
|
|||
|
1,183,000 Bbls*
|
—
|
$ 80.00 — $110.54
|
$80.00
|
$109.50 — $111.40
|
|||
|
Third Quarter 2013
|
|||||||
|
Weighted Average
|
Range
|
||||||
|
Volume
|
Fixed
|
Collars
|
Floor
|
Ceiling
|
|||
|
1,196,000 Bbls*
|
—
|
$ 80.00 — $110.54
|
$80.00
|
$109.50 — $111.40
|
|||
|
Fourth Quarter 2013
|
|||||||
|
Weighted Average
|
Range
|
||||||
|
Volume
|
Fixed
|
Collars
|
Floor
|
Ceiling
|
|||
|
1,196,000 Bbls*
|
—
|
$ 80.00 — $110.54
|
$80.00
|
$109.50 — $111.40
|
|||
*These 3-way collar contracts are standard crude oil collar contracts with respect to the periods, volumes and prices stated above. The contracts have floor and ceiling prices per Bbl as per the table above until the price drops below a weighted average price of $63.95 per Bbl. Below $63.95 per Bbl, these contracts effectively result in realized prices that are on average $18.19 per Bbl higher than the cash price that otherwise would have been realized.
The following table details the expected increase (decrease) to pre-tax income from the settlement of our derivative contracts, outlined above, at various NYMEX oil prices.
|
Oil Prices
|
||||||||
|
$50
|
$60
|
$70
|
$80
|
$90
|
$100
|
$110
|
||
|
2011 (in millions)
|
||||||||
|
2nd Quarter
|
$54
|
$45
|
$24
|
$6
|
($4)
|
($17)
|
($33)
|
|
|
3rd Quarter
|
$55
|
$46
|
$25
|
$6
|
($4)
|
($17)
|
($33)
|
|
|
4th Quarter
|
$57
|
$48
|
$26
|
$7
|
($4)
|
($17)
|
($33)
|
|
|
Total 2011
|
$166
|
$139
|
$75
|
$19
|
($12)
|
($51)
|
($99)
|
|
|
2012 (in millions)
|
||||||||
|
1st Quarter
|
$62
|
$54
|
$30
|
$8
|
$1
|
($9)
|
($18)
|
|
|
2nd Quarter
|
$62
|
$53
|
$30
|
$8
|
$1
|
($10)
|
($18)
|
|
|
3rd Quarter
|
$63
|
$54
|
$31
|
$8
|
$1
|
($10)
|
($18)
|
|
|
4th Quarter
|
$63
|
$54
|
$31
|
$8
|
$2
|
($10)
|
($18)
|
|
|
Total 2012
|
$250
|
$215
|
$122
|
$32
|
$5
|
($39)
|
($72)
|
|
11
|
2013 (in millions)
|
||||||||
|
1st Quarter
|
$29
|
$23
|
$12
|
$ -
|
$ -
|
$ -
|
$ -
|
|
|
2nd Quarter
|
$30
|
$24
|
$12
|
$ -
|
$ -
|
$ -
|
$ -
|
|
|
3rd Quarter
|
$30
|
$24
|
$12
|
$ -
|
$ -
|
$ -
|
$ -
|
|
|
4th Quarter
|
$30
|
$24
|
$12
|
$ -
|
$ -
|
$ -
|
$ -
|
|
|
Total 2013
|
$119
|
$95
|
$48
|
$ -
|
$ -
|
$ -
|
$ -
|
|
We provide information regarding our outstanding hedging positions in our annual and quarterly reports filed with the SEC and in our electronic publication -- @NFX. This publication can be found on Newfield’s web page at http://www.newfield.com. Through the web page, you may elect to receive @NFX through e-mail distribution.
Newfield Exploration Company is an independent crude oil and natural gas exploration and production company. The Company relies on a proven growth strategy of growing reserves through an active drilling program and select acquisitions. Newfield's domestic areas of operation include the Mid-Continent, the Rocky Mountains, onshore Texas, Appalachia and the Gulf of Mexico. The Company has international operations in Malaysia and China.
12