Attached files
| file | filename |
|---|---|
| EX-21.1 - EX-21.1 - DemandTec, Inc. | a2203558zex-21_1.htm |
| EX-31.2 - EX-31.2 - DemandTec, Inc. | a2203558zex-31_2.htm |
| EX-32.1 - EX-32.1 - DemandTec, Inc. | a2203558zex-32_1.htm |
| EX-31.1 - EX-31.1 - DemandTec, Inc. | a2203558zex-31_1.htm |
| EX-23.1 - EX-23.1 - DemandTec, Inc. | a2203558zex-23_1.htm |
| EX-10.23 - EX-10.23 - DemandTec, Inc. | a2203558zex-10_23.htm |
Use these links to rapidly review the document
Table of Contents
Item 8. Financial Statements and Supplementary Data
UNITED STATES
SECURITIES AND EXCHANGE COMMISSION
Washington, D.C. 20549
Form 10-K
| ý | ANNUAL REPORT PURSUANT TO SECTION 13 OR 15(d) OF THE SECURITIES EXCHANGE ACT OF 1934 | |
For the fiscal year ended February 28, 2011 |
||
o |
TRANSITION REPORT PURSUANT TO SECTION 13 OR 15(d) OF THE SECURITIES EXCHANGE ACT OF 1934 |
|
Commission file number 001-33634
DemandTec, Inc.
(Exact Name of Registrant as Specified in Its Charter)
| Delaware (State or Other Jurisdiction of Incorporation or Organization) |
94-3344761 (I.R.S. Employer Identification Number) |
One Franklin Parkway, Building 910
San Mateo, California 94403
(Address of Principal Executive Offices)
(650) 645-7100
(Registrant's Telephone Number)
Securities registered pursuant to Section 12(b) of the Exchange Act:
| Title of Each Class | Name of Each Exchange on Which Registered | |
|---|---|---|
| Common Stock, par value $0.001 per share | The NASDAQ Stock Market LLC (NASDAQ Global Market) |
Securities
registered pursuant to Section 12(g) of the Exchange Act:
None
Indicate by check mark if the registrant is a well-known seasoned issuer, as defined in Rule 405 of the Securities Act. Yes o No ý
Indicate by check mark if the registrant is not required to file reports pursuant to Section 13 or Section 15(d) of the Exchange Act. Yes o No ý
Indicate by check mark whether the registrant (1) has filed all reports required to be filed by Section 13 or 15(d) of the Exchange Act during the preceding 12 months (or for such shorter period that the registrant was required to file such reports), and (2) has been subject to such filing requirements for the past 90 days. Yes ý No o
Indicate by check mark whether the registrant has submitted electronically and posted on its corporate website, if any, every interactive data file required to be submitted and posted pursuant to Rule 405 of Regulation S-T during the preceding 12 months (or for such shorter period that the registrant was required to submit and post such files). Yes o No o
Indicate by check mark if disclosure of delinquent filers pursuant to Item 405 of Regulation S-K is not contained herein, and will not be contained, to the best of registrant's knowledge, in definitive proxy or information statements incorporated by reference in Part III of this Form 10-K or any amendment to this Form 10-K. ý
Indicate by check mark whether the registrant is a large accelerated filer, an accelerated filer, a non-accelerated filer, or a smaller reporting company. See the definitions of "large accelerated filer," "accelerated filer" and "smaller reporting company" in Rule 12b-2 of the Exchange Act. (Check one):
| Large accelerated filer o | Accelerated filer ý | Non-accelerated filer o (Do not check if a smaller reporting company) |
Smaller reporting company o |
Indicate by check mark whether the registrant is a shell company (as defined in Rule 12b-2 of the Exchange Act). Yes o No ý
As of August 31, 2010, the last business day of the registrant's most recently completed second fiscal quarter, the aggregate market value of shares of the registrant's common stock held by non-affiliates of the registrant (based upon the closing sale price of $7.46 per share on the NASDAQ Global Market on such date) was approximately $160.5 million.
As of April 15, 2011, there were 32,298,956 shares of the registrant's common stock outstanding.
DOCUMENTS INCORPORATED BY REFERENCE
Portions of the registrant's definitive proxy statement for its 2011 Annual Meeting of Stockholders (the "Proxy Statement") are incorporated by reference in Part III of this Report on Form 10-K. Except with respect to information specifically incorporated by reference in this Form 10-K, the Proxy Statement is not deemed to be filed as part of this Form 10-K.
2
This Annual Report on Form 10-K contains forward-looking statements that involve risks and uncertainties. Please see the section entitled "Forward-Looking Statements" in Item 7 of this Annual Report on Form 10-K for important information to consider when evaluating these statements.
Overview
We provide a collaborative optimization network of software services connecting retailers and consumer products, or CP, companies, enabling them to define category, brand, and shopper marketing strategies based on a scientific understanding of consumer behavior and make actionable pricing, promotion, assortment, space and other merchandising and marketing decisions to achieve their revenue, profitability, sales volume, and customer loyalty objectives. We deliver our solutions by means of a software-as-a-service, or SaaS, model, which allows us to capture and analyze the most recent retailer and market-level data, enhance our software services rapidly to address our customers' ever-changing merchandising and marketing needs, and connect retailers and CP companies online to enable improved, more collaborative business processes between these trading partners. We were incorporated in November 1999.
Our solutions consist of software services and complementary consulting and analytical services derived from a uniform platform that supports our software services. We offer our solutions individually or as a suite of integrated software services.
Our solutions for the retail and CP industries include:
- •
- DemandTec Lifecycle Price Optimization™, enabling retailers to strategically price items at any stage in their
lifecycle, including new items, regular items, promoted items, and clearance items.
- •
- DemandTec End-to-End Promotion Management™, enabling retailers to manage the complex
processes related to retail promotions, from collaborative promotion planning and CP vendor deal management to in-store promotion execution and post-event analysis.
- •
- DemandTec Assortment & Space™, enabling retailers to create localized assortments by store, cluster, or
section, based on shopper demographics, the competitive environment, and a science-based, quantitative understanding of each item's ability to add variety and grow incremental sales in the category.
- •
- DemandTec Shopper Insights™, a collection of services that enable retailers to better understand key shopper
insights, define shopper segments, and plan shopper merchandising and marketing programs for different consumer segments in order to build loyalty, increase sales, and improve profitability.
- •
- DemandTec Targeted Marketing™, a collection of services that enable retailers and their CP trading partners to
better understand key shopper insights, define shopper segments, and plan segment-targeted shopper merchandising and marketing programs to build loyalty, increase sales, and improve profitability.
- •
- DemandTec Marketing Plan Optimization™, enabling CP executive and brand managers to develop strategic
marketing investment allocation decisions and optimize marketing mix decisions across the spectrum of trade and consumer promotion vehicles.
- •
- DemandTec Total Trade Optimization™, enabling CP companies to optimize and manage the full spectrum of trade funds decisions including strategic trade planning, customer trade planning, deal management and negotiation with retailers, and post-event analytics.
3
- •
- DemandTec Shopper Marketing Optimization™, enabling CP companies to receive valuable shopper insights and to
make informed assortment planning decisions leveraging retail customer data and collaborative business processes on the DemandTec network.
- •
- DemandTec Connect™, enabling retailers and CP companies to collaborate using social messaging and networking capabilities that link intra-company and inter-company groups of users together on the DemandTec network.
DemandTec provides these software solutions, as well as insights and value-added qualitative content, in an online network where our approximately 16,000 users log in to do business every day. DemandTec is the collaborative optimization network where retailers and CP companies go to log in, access content from DemandTec and DemandTec partners, collaborate both internally within their company and externally with trading partners, analyze insights about consumer behavior and their own businesses, and ultimately make and optimize decisions across a variety of business processes. The DemandTec network is unique in the industry and provides the infrastructure, security, connectivity and services for retailers and CP companies to effectively collaborate on core merchandising, sales, and marketing activities.
In March 2011, we acquired M-Factor, Inc. ("M-Factor"), a provider of predictive analytics software for marketing mix and trade investment spending. In December 2010, we acquired substantially all of the assets of Applied Intelligence Solutions, LLC ("AIS"), a provider of intelligent software solutions for retail enterprises with a specific focus on softlines retailers.
Industry Background
Retail trade is one of the world's most widespread activities. There are more than 1,500 retailers worldwide that have annual sales in excess of $500 million, and more than 250 of those retailers have annual sales in excess of $3 billion. Retailing is highly competitive and generally characterized by low profit margins. Furthermore, there are more than 1,300 CP companies worldwide that have annual revenues in excess of $500 million that sell to retailers. The CP industry is becoming increasingly competitive due to factors such as retailer consolidation, more discerning and less loyal consumers, and the growing impact of private label products. To counter these trends, CP companies are making substantial investments in product innovation, market research, branding, and consumer and brand marketing.
Consumer Demand and Retail Merchandising Challenges
Retailers compete for consumers who are becoming more knowledgeable, more selective and, in many instances, more price sensitive. Consumers today devote considerable time to researching products and comparing prices prior to shopping and have a greater array of choices in price, size, brand, color and features. The growth of discount stores, warehouse clubs, dollar stores and the emergence of the Internet as a viable retail destination offer consumers further alternatives when purchasing goods. Adverse macroeconomic conditions in recent years, including unemployment, housing market declines, volatile fuel prices, and an increasing shift from spending to saving for some families, have further increased the average consumer's price sensitivity. For retailers to compete effectively, they need to better understand and respond to these changes in consumer demand and behavior through targeted pricing, marketing and merchandising strategies.
A basic principle of economics is that a change in the price of an item will affect demand for that item. Every item in a store has a unique "price elasticity," or sensitivity between sales volume and price. Small decreases or increases in the prices of some items may lead to significant changes in the demand for those items, whereas larger decreases or increases in the prices of other items may have little effect on demand. In addition, changes in the prices of items in a store often have an impact on the sales volumes of other items in that store. This interdependence is referred to as the "cross elasticity" of demand. Demand is influenced by a wide variety of additional factors, including store location, customer demographics, advertising, in-store displays, the availability of complementary or substitute products, seasonality,
4
competitive activity and loyalty and marketing programs. These variables make calculating price elasticity for even a single item an extremely data-intensive and complex process. Calculating the cross-elasticity of demand for thousands of items is exponentially more difficult.
Applying these economic concepts to make day-to-day pricing decisions presents enormous challenges to retailers of all sizes, particularly large retailers that sell tens of thousands of items and have hundreds, if not thousands, of stores. These retailers must determine how to price each particular item and whether to vary the price among different regions or individual locations. They also must determine the price of each item relative to competing products and the likely impact on their aggregate profitability if the prices of that item or competing items are increased or decreased.
Consumer demand, though, is driven by more than just the everyday price of an item. In addition, retailers may want to consider whether promoting an item would result in increased sales volume and, if so, whether that increase would represent incremental revenue or merely cannibalize sales of other items. Retailers must also determine which items should be stocked, by store or store cluster. These pricing, inventory, and marketing decisions must also strike a balance between the retailer's financial goals and its desired price and brand image in order to enhance consumer loyalty and maximize sustainable, lifetime value from its customers.
Consumer demand also differs by consumer segment. Not all consumers are price sensitive to certain brands or respond similarly to particular promotions. Understanding and predicting demand in today's market requires retailers to analyze the differences between various segments of shoppers in their stores. Shopper segments with descriptive names such as "budget families," "young, urban, and affluent," or "foodies" can reflect differences in demographics. However, retailers now must also analyze the purchase decisions and other shopping behaviors of individual consumers in order to properly define consumer segments and identify strategies and tactics to target those segments.
Consumer Demand and CP Company Challenges
CP companies also compete for consumers. CP companies must make complex decisions when distributing, pricing, and promoting their products. CP companies are faced with rising costs, intense competition, waning consumer loyalty, strong and divergent retailer strategies, and an operating environment in which it is difficult, but sometimes necessary, to raise prices. As ingredient and fuel costs escalate and competitive threats intensify, predicting the relative impact that promotion and everyday price activities will have on volume and margin objectives is an essential planning requirement. CP companies must understand how consumers will respond to promotions, how price changes will affect sales volumes and how often to promote their brands. CP companies also must decide when and how to use trade funds in the form of discounts, offsets or direct cash payments to compensate retailers for offering temporary price reductions on their products and how competitive trade plans will impact their own promoted items, their total portfolio and even the retailer's entire category. According to Capgemini, most CP companies' trade promotion budgets represent 15% or more of their net sales, which is second in magnitude only to their cost of goods sold. In 2008, CP companies globally spent over $175 billion on trade promotions according to a 2009 report by Cannondale Associates, Inc. Despite the pervasive use of trade funds, studies suggest that over 50% of trade promotions have negative returns on investment after taking into consideration execution costs and unintended cannibalization.
The trade promotion process is often not only generally unprofitable, but also highly inefficient. Submitting and negotiating trade promotions historically have been handled through a combination of fax, voicemail and manual, paper-based processes. This has led to frequent inaccuracies and increasing costs for both CP companies and retailers. CP companies and retailers have lacked an accurate, common, and integrated technology platform for improving the efficiency of their trading relationships.
In order to attain higher revenue growth, improve profit margins and increase market share, while maintaining proper price and brand image, retailers and CP companies must better understand and predict
5
consumer behavior across geographic, demographic, gender, age, income and other segments. However, achieving these objectives through day-to-day pricing and other merchandising and marketing decisions is extremely complex.
Alternative Approaches to Understanding Consumer Demand
Over the last 20 years, retailers and CP companies have made significant investments in information technology, or IT. Most of these IT investments have focused on achieving cost reductions through increased operational efficiencies and transaction automation, including supply chain management, point of sale, or POS, systems, and marketing automation software.
As a result of these IT investments, retailers have accumulated vast amounts of sales data. While a number of academic techniques exist to analyze this data, incorporating advanced statistical analytics into a commercially-useful software solution that yields meaningful and actionable insights at the point of decision for retailers and CP companies presents significant scientific, engineering, processing and cost challenges due to the vast amounts of data and the complexities of the required mathematical computing actions. Consequently, existing approaches that incorporate an understanding of consumer demand into retail and CP pricing decisions generally have been limited to modeling sample data sets to provide limited insights. As a result, retailers and CP companies historically have made merchandising, sales, and marketing decisions based on simpler approaches such as:
- •
- cost-plus or competitor-matching pricing;
- •
- national pricing of items, regardless of local consumer demand and competitive dynamics;
- •
- "one-size-fits-all" assortments of goods, regardless of the unique preferences of
consumers who shopped in each location;
- •
- habitual promotions, advertisements, mailers and other marketing programs; and
- •
- engaging boutique business consultants to provide isolated category-based analyses.
In recent years, retailers have engaged consultants and used internal data warehousing systems to begin analyzing market basket information and loyalty card data in order to learn new insights about customers, how they shop, what they buy together, and what their lifestyles, preferences, and future behaviors might be. These efforts have been both time- and people-intensive, and have not sufficiently involved the business users requiring those insights to make timely decisions.
In the current environment, retailers and CP companies need scalable enterprise software capable of modeling the numerous variables that affect consumer demand, processing massive data sets in a cost-effective manner, presenting valuable shopper insights right at the point of decision, and delivering actionable merchandising and marketing recommendations that help them achieve their revenue, profitability, sales volume, and customer loyalty objectives.
DemandTec Solution
Our online collaborative optimization network of software services enables retailers and CP companies to define category, brand, and customer strategies based on a scientific understanding of consumer behavior and make actionable pricing, promotion, assortment, space and other merchandising, sales, and marketing recommendations to achieve their revenue, profitability, sales volume, and customer loyalty objectives. The DemandTec network of software and other services is a destination for our customers, an online environment made possible by our SaaS model that allows us to capture and analyze the most recent retailer and market-level data, enhance our software services rapidly to address our customers' ever-changing merchandising and marketing needs, and provide best practices content, social
6
messaging features, and other community features to better connect our approximately 16,000 users as they collaborate on business decisions. Our solutions enable retailers and CP companies to:
Understand and predict consumer behavior to make merchandising and marketing decisions that achieve revenue, profitability, sales volume, and customer loyalty objectives
Our software services enable retailers and CP companies to incorporate a scientific understanding of consumer demand into their day-to-day merchandising, sales, and marketing decision-making processes in order to meet their business objectives. Specifically, our software services allow retailers and CP companies to:
- •
- make daily pricing, promotion, assortment, space and other merchandising and marketing decisions based on the ability to
understand, predict, and influence consumer demand;
- •
- balance financial goals with price and brand image in order to maximize the lifetime value of their targeted consumer
segments;
- •
- use shopper insights based on analyzing loyalty card data to define and execute merchandising and marketing tactics
targeted and tailored to meet the needs of individual consumer segments;
- •
- enforce pricing rules consistently;
- •
- forecast sales more accurately;
- •
- devise more targeted promotions based on consumer segmentation insights;
- •
- create, version and publish targeted advertisements to be distributed via multiple channels and media vehicles;
- •
- make strategic marketing investment allocation decisions on a continuous, dynamic basis;
- •
- develop optimal allocations of marketing funds across the spectrum of trade and consumer vehicles; and
- •
- manage the full spectrum of strategic and tactical trade planning decisions to better support retail customers.
Incorporate scalable science into merchandising and marketing decision-making processes
We incorporate advanced econometric modeling techniques and optimization theory into scalable software services that our customers use to make day-to-day merchandising and marketing decisions. Our software automates the process of predicting consumer response to various merchandising and marketing activities, such as pricing, promotion, assortment, space, loyalty programs and media. Our proprietary demand models quantify consumer response at the individual store and item levels based on a number of factors, including store location, consumer demographics, advertising, in-store displays, the availability of complementary and substitute products, seasonality, competitive activity and loyalty and marketing programs. Our software incorporates optimization science that uses a combination of complex algorithms to help our customers determine in real-time the prices, promotions, and markdowns, and assortments that best accomplish their merchandising and marketing objectives, while complying with their business rules.
Leverage technological advancements through a SaaS delivery model that enables us to adapt to our customers' changing business needs, deliver results quickly, and create an online community
Our investment in the SaaS model leverages a set of pervasive technology trends that includes the availability of greater amounts of computing power at commercially affordable and decreasing prices, dramatic reductions in the cost of data storage and inexpensive and secure access to broadband communication networks. This model represents a dramatic shift from developing and delivering static,
7
highly-customized software code that is installed at the customer's site and requires frequent maintenance cycles. Due to the dynamic nature of consumer demand and the changing merchandising and marketing objectives of retailers and CP companies, we believe a solution is delivered most effectively through a SaaS model. By delivering our software as a service, we are able to:
- •
- capture and analyze the most current transaction-log/loyalty data from retailers, as well as
up-to-date market-level data, syndicated data and other third-party demographic content, in order to better understand the dynamic nature of consumer behavior;
- •
- intimately understand how our customers use our software to make their day-to-day merchandising
and marketing decisions so we can continuously enhance our offering to address our customers' business needs;
- •
- improve user productivity with more frequent but smaller incremental updates and training courses;
- •
- deliver technical enhancements to our software on a frequent and predictable schedule with little or no disruption to our
customers' operations;
- •
- utilize grid computing and service-oriented-architecture, or SOA, techniques to maximize scalability and processing
capacity; and
- •
- enable interoperability across our customers' diverse legacy systems.
By delivering our software as a service, we enable our customers to make better pricing, promotion, trade funds management and other day-to-day merchandising, sales, and marketing decisions. With our SaaS model, our customers are able to achieve measurable financial results within a matter of months, not years.
By combining and packaging our software services as an online, SaaS-based network for our customers, we are also able to develop and nurture a user community and enable collaboration features like those found in the social networking technologies of the consumer software space. Specifically, our SaaS model enables us to provide the following services on the DemandTec network:
- •
- product information, "tips-and-tricks' forums, message boards, and other community capabilities
for the entire network of approximately 16,000 business users;
- •
- solutions that enable users to create custom groups and communities and define what information to share with each group;
- •
- the ability to "follow" users on the network as well as defined objects (a pricing plan, for example) such that
real-time updates can appear in a customized activity feed on a user's desktop;
- •
- best practices and other qualitative content provided by DemandTec, our partners, and any user on the network; and
- •
- online purchasing for services such as premium reports, and shopper insights shared by retailers for use by their CP company suppliers.
Incorporate shopper insights into our software services at the point of decision for merchants and marketers
We incorporate advanced shopper insights into our solutions to enable retailers and CP companies to both analyze shopper behavior and collaboratively define merchandising and marketing programs based on those insights. Our model is to utilize transaction-log and loyalty data to incorporate detailed insights regarding customer segment and shopper behavior into our software solutions directly at the point where merchants and marketers are making business decisions. This provides retailers and CP companies with a competitive advantage as they are able to address both category objectives for sales, profit, and volume as
8
well as customer objectives for loyalty, price image, shopping trips, and basket content. Key capabilities include:
- •
- advanced market basket insights, including basket metrics trends year over year and in weekly time series, as well as
affinity analyses to understand cross-promotional opportunities;
- •
- customer segment-level insights delivered directly at the point of decision for merchants and marketing professionals,
including insights such as penetration, buy rate, dollars per trip, trips per household, and brand switching; and
- •
- modeling and optimization by segment so as to enable retailers to make targeted assortment, promotion, and pricing decisions based on customer segment preferences and goals.
Enable and monetize collaborative programs between large retailers and the ecosystem of suppliers (CP companies) serving those retailers
A number of our software services can be deployed as collaborative programs designed in partnership between DemandTec and key retail customers. In the collaborative model, the software services are designed to be used by both the retail and the CP companies based on roles and responsibilities and business processes defined within the program.
For example, Assortment Optimization and Shopper Insights are currently sold as standalone offerings to retailers or as collaborative programs. When sold and deployed as part of a collaborative program, the software service is available for subscription by CP companies as part of the program. The underlying data is retailer-specific and, therefore, these solutions and underlying services represent significant new capabilities for the CP companies and the overall program can provide significant value for both trading partners. Ultimately, both parties are able to collaborate on better, win-win plans using shared solutions and a single version of the truth with regard to analytics.
Strategy
Our objective is to extend our position as the provider of a collaborative optimization network for retailers and CP companies and to grow membership in and capabilities on that network. The three key elements of our strategy to achieve this objective include:
- •
- Expanding our relationships with our existing retail
customers. We plan to continue to deliver measurable business results to our existing retail customers in order to encourage their
renewals of their existing solutions, as well as their adoption of additional solutions. A key element of our strategy is to leverage our domain expertise, proprietary network and advanced analytical
capabilities to expand our solutions including new software services, new analytics, and new value-added consulting services.
- •
- Extending our market position with major retailers
worldwide. The retail industry is an international business, with a significant portion of the world's retailers based outside of the
United States. We intend to use our market position and distribution investments to pursue additional retail opportunities around the world, leveraging our partnerships and multi-language product
capabilities. We believe that our existing retail customers have the ability to influence other retailers worldwide by changing the competitive dynamics in their respective markets.
- •
- Expanding our relationships with CP companies. Developing the right strategic marketing and trade planning strategies has evolved into a rigorous and important discipline for CP companies. We intend to expand upon and leverage our market-leading footprint and empower CP companies to forecast a broad range of sales and marketing decisions in a unified planning environment. Further, the collaborative business model enabled by the DemandTec network creates "ecosystems" between retailers and their CP trading partners. By leveraging our ability to deliver existing and new software
9
services through our network, we intend to use our existing retail customer relationships to create and expand our relationships with their CP trading partners. We believe there is a significant opportunity to expand our CP market presence as a result of a network effect.
Offerings
Overview
Our solutions consist of one or more software services and complementary analytical services. We offer our solutions individually or as a suite of integrated software services. Our software services are configurable to accommodate individual customer needs.
Our solutions for the retail and CP industries include:
- •
- DemandTec Lifecycle Price Optimization™, enabling retailers to strategically price items at any stage in their
lifecycle, including new items, regular items, promoted items, and clearance items.
- •
- DemandTec End-to-End Promotion Management™, enabling retailers to manage the complex
processes related to retail promotions, from collaborative promotion planning and CP vendor deal management to in-store promotion execution and post-event analysis.
- •
- DemandTec Assortment & Space™, enabling retailers to create localized assortments by store, cluster, or
section, based on shopper demographics, the competitive environment, and a science-based, quantitative understanding of each item's ability to add variety and grow incremental sales in the category.
- •
- DemandTec Shopper Insights™, a collection of services that enable retailers to better understand key shopper
insights, define shopper segments, and plan shopper merchandising and marketing programs better targeted for different consumer segments in order to build loyalty, increase sales, and improve
profitability.
- •
- DemandTec Targeted Marketing™, a collection of services that enable retailers and their CP trading partners to
better understand key shopper insights, define shopper segments, and plan segment-targeted shopper merchandising and marketing programs to build loyalty, increase sales, and improve profitability.
- •
- DemandTec Marketing Plan Optimization™, enabling CP executive and brand managers to develop strategic
marketing investment allocation decisions and optimize marketing mix decisions across the spectrum of trade and consumer promotion vehicles.
- •
- DemandTec Total Trade Optimization™, enabling CP companies to optimize and manage the full spectrum of trade
funds decisions including strategic trade planning, customer trade planning, deal management and negotiation with retailers, and post-event analytics.
- •
- DemandTec Shopper Marketing Optimization™, enabling CP companies to receive valuable shopper insights and to
make informed assortment planning decisions leveraging retail customer data and collaborative business processes on the DemandTec network.
- •
- DemandTec Connect™, enabling retailers and CP companies to collaborate using social messaging and networking capabilities that link intra-company and inter-company groups of users together on the DemandTec network.
Solutions and Software Services
DemandTec Lifecycle Price Optimization™ for Retail
Packaged together as a solution to enable retailers to manage pricing for new items, regularly priced items, promoted items, and markdown/clearance items, the DemandTec Lifecycle Price
10
Optimization™ solution for the retail industry consists of one or more of the following software services, along with complementary consulting and analytical services:
Everyday Price Optimization
Everyday Price Optimization enables retailers to determine optimized prices to achieve their sales, volume, profit, price image, and customer loyalty objectives for regular, everyday items. Using Everyday Price Optimization, customers create scenarios in which they define strategic objectives such as increased revenues, profitability and/or sales volume and optimize prices to best achieve these objectives. A typical strategic objective might be to maximize net margins, while not sacrificing more than a certain defined percentage of sales volume.
Retailers use Everyday Price Optimization to optimize and set retail prices in their stores based on their unique cost structure and strategic goals. Everyday Price Optimization would likely generate different optimized prices for the same item carried by competing retailers in stores located in the same geographic location, since consumer behavior varies between competitors and each retailer has its own vendor costs and strategic pricing objectives.
Key features of Everyday Price Optimization include:
- •
- Store/SKU-level modeling—econometric modeling that
captures the elasticity of each item, in addition to cannibalization, halo, and cross-elasticity effects, trends, seasonality, and a variety of other causals to deliver accuracy. Models are analyzed
at the overall customer base level as well as by customer segment;
- •
- Optimization and forecasting—full category price optimization,
with store/item level forecasting, enables retailers to develop pricing that conforms to their pricing rules while maximizing their primary and secondary goals, such as driving higher sales,
increasing volume, and improving profitability, based on a customer segment-specific strategy;
- •
- Image item analysis—determination of effective price image
items for key customer segments;
- •
- Natural language pricing rules and rules
management—non-technical end-users can define and enforce pricing policies by creating pricing scenarios with pricing rules selected from a
comprehensive library of retail pricing rules, customized with a rules editor and prioritized with rules relaxation capabilities to handle conflicts;
- •
- Scenario management—the ability to create and evaluate
multiple pricing scenarios to fine-tune pricing strategy before prices hit shelves in order to change goals (maximize profit, sales, or unit volume) or add, remove, modify, or reprioritize
pricing rules; and
- •
- Benefits reporting—the ability to validate the effects of price optimization on actual sales of a particular category and to understand the degree to which factors such as promotions, seasonality and macroeconomic shifts contributed to sales.
Everyday Price Management
Everyday Price Management enables retailers to improve execution and compliance with their pricing strategy, and dramatically boost efficiency by automating their most cumbersome, time-consuming pricing tasks. Using Everyday Price Management, customers define pricing rules and apply those rules-based prices to merchandise categories that are not modeled and optimized using Everyday Price Optimization. In addition, customers maintain both optimized and rules-based prices using Everyday Price Management as vendor costs and competitor prices change.
11
Key features of Everyday Price Management include:
- •
- Rules-based pricing—define and enforce pricing policies by
creating pricing scenarios with rules selected from a comprehensive library of pricing rules such as last digit rules, competitive price index rules, and cross-zone rules, all of which are
configured using easy-to-understand natural language;
- •
- Rules management—rules editor and rules relaxation
capabilities to handle conflicts;
- •
- Advanced price maintenance—operational price management
capabilities to handle frequent vendor cost changes, competitive price changes, and new item introductions; and
- •
- Advanced pricing delivery—quickly review and approve incoming data and automatically schedule when updated pricing will be delivered to downstream systems.
Both Everyday Price Optimization and Everyday Price Management utilize a library of configurable business rules that act as constraints on the optimization by limiting the set of possible outcomes. For example, a customer can ensure that larger size items always cost more than smaller size items but are a better value, or that an optimized price is within a given percentage of a competitor's price.
Promotion Optimization
As part of the DemandTec Lifecycle Price Optimization™ solution, Promotion Optimization can help retailers quickly determine the appropriate discounted price for any item or promoted item group and the best type of temporary price reduction.
Promotion Optimization uses scientific analysis that takes into account cannibalization, halo, and cross-elasticity effects of existing retail and markdown programs. Promotion Optimization customers can create and simulate multiple scenarios based on mathematical forecasts of results in order to evaluate tradeoffs among various promotions.
Key features of Promotion Optimization as a part of DemandTec Lifecycle Price Optimization™ include:
- •
- Store/SKU-level modeling—the ability to plan
promotions that maximize total store impact on all categories by taking into account promotional response, in aggregate and by customer segment, by item and by store, as well as cannibalization, halo,
and cross-elasticity effects of existing everyday prices; and
- •
- Scenario management and what-if analysis—the ability to create and evaluate multiple promotion scenarios, in aggregate and by customer segment, to fine-tune promotional pricing and combinations of ad and display support.
Promotion Optimization is also included in the DemandTec End-to-End Promotion Management™ solution (described below).
Markdown Optimization
Markdown Optimization enables retailers to eliminate excess inventory by a specified date after which an item will no longer be sold and to maximize profitability of items sold before that date. The Markdown Optimization software service incorporates the science of consumer demand to enable retailers to design optimal plans that set markdown timing and depth (of discounted price) to maximize profitability or meet inventory objectives for every clearance item in every store. Markdown Optimization supports a wide range of markdown types, including seasonal, short product lifecycle, event and holiday, category reset, cycle refresh, and standard discount markdowns.
12
Key features of Markdown Optimization include:
- •
- Scenario management—the ability to create and forecast
multiple scenarios in order to evaluate tradeoffs between timing and depth of markdown prices, as well as other factors such as the number of markdowns taken within a time period;
- •
- Science-based—the ability to design markdown plans based on
the unique price elasticity and inventory position at each store;
- •
- Rules management—the ability to configure markdown-specific
rules;
- •
- Re-optimization—the ability to
re-optimize plans and prices on a weekly basis to adjust for changes in demand and inventory position; and
- •
- Automated workflow process—the ability to create and initiate new markdown plans and scenarios automatically based on category-specific rules defined by the retailer so that merchants can simply log into the system to review the results of planned optimizations.
Lifecycle Pricing for Softlines
Lifecycle Pricing for Softlines applies advanced science and technologies to enable retailers to identify opportunities to maximize profitability and meet inventory objectives for clearance items while adhering to markdown budget constraints. Lifecycle Pricing for Softlines uses pattern recognition demand forecasting techniques developed specifically for short-lifecycle softlines products, which requires less data than traditional statistical forecasting tools. This approach allows for faster focus on volatile seasonal merchandise providing a multidimensional forecast-by-demand component that better supports customer centricity at store/SKU levels.
Key features of Lifecycle Pricing for Softlines include:
- •
- Pattern-Recognition Based—the ability to recommend pricing
plans using limited sales data based on behavior of similar historical items;
- •
- Real Time Optimization—the ability to selectively identify
items to mark down together and quickly provide optimal pricing recommendations;
- •
- Rules Driven—the ability to define business rules to guide the
optimized price recommendations;
- •
- Multi-Dimentional Targets—the ability to define varying goals
across product areas, enabling recommendations to be aligned to merchandise targets; and
- •
- Graphical Reporting—the ability to view detailed graphical representations of the correlations between inventory, demand, and price.
DemandTec End-to-End Promotion Management™ (for Retail)
Managing retail promotions is a complex, multi-faceted process. Successful retailers are able to collaborate internally among senior management, merchants, marketing, advertising managers, and others, and collaborate externally with CP trading partners to build promotion plans that provide win-win results for all parties. Leading retailers are also able to quickly predict the outcome of any of the thousands of CP company trade promotion offers they receive every month, and evaluate alternative versions of any promotion to ensure they're capitalizing on the full potential of each promotion and maximizing the impact of every category plan.
The DemandTec End-to-End Promotion Management™ solution for the retail industry consists of the Promotion Optimization software service discussed above and/or the software services listed below, along with complementary DemandTec analytical services.
13
Deal Management
Our Deal Management software service enables retailers to automate and streamline the presentation, negotiation and reconciliation of trade promotion offers they receive from their CP trading partners in a secure, Web-based environment.
Key features of Deal Management for the retailer include:
- •
- Proprietary offer sheet mapping—uses each retailer's existing
paper-based offer format to ease adoption by retailers;
- •
- Online collaboration—provides a common platform for retailers
and their CP trading partners to present and negotiate the terms of trade promotion offers, eliminating the large number of emails, faxes, and spreadsheets that typically go back and forth between
parties, thereby reducing errors;
- •
- Web portal—boosts the retailer's productivity by pushing data
entry work to the CP trading partners and allowing them to enter trade promotion offer information;
- •
- Retailer item catalog-based entry—provides CP trading partners
use of retailer-specific item catalogs in order to eliminate data-entry errors;
- •
- Electronic document and deal history archive—provides version
control of trade promotion offers, final contract terms, user activity and communications in order to facilitate regulatory compliance and dispute resolution and to eliminate the need for costly
post-trade promotion offer audits; and
- •
- Accounting and reconciliation—provides for reconciliation of invoicing and deduction notices with CP trading partners.
When a retailer implements Deal Management, that retailer requires that all of its CP trading partners submit and negotiate their future trade promotion offers electronically through the Deal Management software service. We offer two editions of this service for CP companies: "Deal Management," which is offered at no charge and allows CP trading partners to submit trade promotion offers by selecting valid items from the retailer's item catalog, and "Advanced Deal Management", which is a paid upgrade that includes additional features specific to a CP company, such as accounting and reconciliation, transaction and workflow reporting, catalog management, vendor item catalog synchronization and trade promotion offer history archiving.
Allowance Billing
Allowance Billing automatically creates invoices and accruals based on negotiated trade promotion offers in Deal Management and based on transaction details from point-of-sale, warehouse, and store receipts. By automatically creating invoices, retailers save labor, improve accuracy, and get their invoices and accruals incorporated into their financial statements sooner.
Key features of Allowance Billing include:
- •
- Direct access to trade promotion offers in Deal
Management—automatically creates accounting entries and feeds those directly into existing accounting systems, thereby reducing the time and labor required to enter
the data and eliminating the possibility of introducing errors into the system;
- •
- Robust workflow management engine—provides version control of
trade promotion offers, final contract terms, user activity and communications in order to facilitate regulatory compliance and dispute resolution and to eliminate the need for costly
post-trade promotion offer audits;
- •
- Interface displays transaction details—allows financial analysts to identify additional funds that should be billed based on the trade promotion offer, reducing the required efforts of a retailer's internal audit team and allowing retailers to invoice and collect trade promotion funds earlier; and
14
- •
- Electronic bill distribution—distributes invoices through the online Advanced Deal Management system or via email and tracks undeliverable invoices and manages CP company invoice distribution lists all in a simple, integrated interface.
Promotion Planning & Management
Our Promotion Planning & Management software service enables retailers to establish a single repository for all their information and content about promotional offers and events, greatly improving visibility and accountability, reducing costly errors, and increasing consistency across media channels. As the core or base module of the DemandTec End-to-End Promotion Management™ solution, Promotion Planning & Management allows retailers to build, develop, and manage promotional plans with a collaborative platform that enables versioning and cross-functional collaboration.
Key features of Promotion Planning & Management include:
- •
- Central repository—plan and manage all promotions and events
in a collaborative environment so as to create a single system of record for all promotions and a centralized data repository for merchandising product and pricing data, ad copy and images;
- •
- Integrated workflow controls processes and security—enables
collaboration between analysts, marketing departments, buyers/merchants, advertising departments, and other partners;
- •
- Centralized merchandising and marketing calendar and integrated workflow
system—view all promotions in a single, integrated calendar and plan and forecast merchandising activities in a single collaborative system, which enables
collaboration between analysts, marketing, buyers/merchants, advertising and other partners;
- •
- Dynamic layout and versioning capabilities—view and select
items, build and manage sophisticated promotional offers and create multiple versions customized for different regions, clusters of stores, customer segments, or advertising zones;
- •
- Highly-configurable enterprise architecture—supports complex
requirements to integrate with key retail production systems;
- •
- Integration with DemandTec's Promotion Optimization—the
ability to present promotion analytics directly at the point of decision within the dynamic layout and publishing process, enabling a more scientific approach to selecting items and building
promotions; and
- •
- Enterprise integration—provides multiple integration points with the customer's IT systems: large incoming and outgoing data feeds use data-level integration to transfer bulk files on an automated basis, and industry-standard web services protocols communicate with customer systems and process customer system requests.
Retailers use Promotion Planning & Management to manage the production process and execute more targeted, customer-centric promotions across multiple channels and media vehicles while also dynamically creating the highly-granular promotion history required to achieve effective promotion analytics and complete the promotion cycle with post event measurement and improved modeling for future periods. Promotion Planning & Management enables retailers to make better decisions about promotional offers based on insight into past performance and visibility to cross-channel promotions, to reduce errors and to improve the ability to target promotions and to version products and prices by market, zone or customer segment.
Promotion Optimization
As part of the DemandTec End-to-End Promotion Management™ solution, Promotion Optimization helps retailers to develop promotional offers and placements that maximize the total store impact on all
15
categories. Promotion Optimization uses scientific analysis that takes into account cannibalization, halo, and cross-elasticity effects of existing retail and markdown programs. Promotion Optimization customers can create and simulate multiple scenarios based on mathematical forecasts of results in order to evaluate tradeoffs among various promotions.
Key features of Promotion Optimization as a part of DemandTec End-to-End Promotion Management™ include:
- •
- Store/SKU-level modeling—the ability to plan
promotions that maximize total store impact on all categories by taking into account promotional response, in aggregate and by customer segment, by item by store, cannibalization, halo, and
cross-elasticity effects of existing everyday prices;
- •
- Scenario management and what-if analysis—the
ability to create and evaluate multiple promotion scenarios, in aggregate and by customer segment, to fine-tune promotional pricing and combinations of ad and display support;
- •
- Category plan and master calendar management—the ability to
generate, view and forecast multiple promotions on one plan, taking into account factors such as cannibalization of regular priced items, concurrent promotions and the pantry-loading effect of
successive promotions;
- •
- Deal Management integration—the ability for all CP trade
promotion offers entered into DemandTec's Deal Management software service to flow directly into Promotion Optimization for analysis, optimization and forecasting; and
- •
- Promotion Planning & Management integration—Promotion Optimization is the analytics engine providing embedded insights within the Promotion Planning & Management workflow. The two modules work together to enable merchants to identify the right items to promote, forecast the impact of different pricing and merchandising options, build and forecast a complete promotional calendar, and then manage the downstream execution (integrating to Promotion Execution) to complete the end to end process.
Promotion Optimization is also included in the DemandTec Lifecycle Price Optimization™ solution (described above).
Promotion Execution
Our Promotion Execution software service enables retail users to execute the promotion plans built in Promotion Planning & Management with direct integration into major promotion plan output mechanisms including Adobe® InDesign® for print, signage systems and the retailer's website. Promotion Execution streamlines the promotion plan proofing process with an online system that simplifies the proofing of multiple promotion plan versions, enables retail users to proof anywhere and anytime, and manages the proofing workflow. By simplifying promotion plan publication, retailers are able to execute promotions more quickly, thereby gaining a competitive advantage.
Key features of Promotion Execution include:
- •
- Powerful version-enabled environment—rapidly build
page-oriented promotions, streamline the flow of promotional content and details to the creative team, and automatically communicate all the versioned content, images, prices and layout
directly to Adobe InDesign®, where artists can quickly build pages and maintain links to highly versioned promotional elements;
- •
- Highly graphical and easy-to-use web-based
software—automate and streamline the collaborative advertising proofing process to accelerate the process and reduce errors;
- •
- Integrated signage software—efficiently push versioned signage information to existing systems both in-store and at headquarters, thereby improving efficiencies and eliminating errors between pricing and messaging in the advertising circular with the information sent to the stores;
16
- •
- Multi-channel/cross-media publishing—create content for
planned promotional events once and then manage and publish the content and digital assets across print, email, website, mobile device, and other multi-channel/media publishing; and
- •
- iFlyer module—automate the execution of promotional flyers to targeted customer groups and distribute them on-line through an email link, posting an electronic Flyer on the retailer's web site, or to a web device.
DemandTec Assortment & Space™ (for Retail)
The DemandTec Assortment & Space™ solution for the retail industry consists of the following software services, along with complementary consulting and analytical services:
Assortment Optimization
Assortment Optimization enables retailers to determine which items should be stocked, by store or store cluster, based on the customers that shop at each store, the competitive environment, and a quantified understanding of whether each item in a category is merely duplicative or truly provides variety and adds incremental sales to the category. Key features of Assortment Optimization include:
- •
- Advanced modeling and optimization science—enables the
creation of efficient, customer-centric assortments based on a quantitative understanding of incrementality (an item's ability to increase overall category sales) and transferable demand (the degree
to which sales volume shifts to similar items or leaves the store when one item is delisted);
- •
- Multiple data inputs—incorporates market, loyalty card,
planogram, and cost data into the optimization process;
- •
- Automated processes—includes automated processes and wizards
to address the assortment challenges merchants face every day, such as performing straight optimizations, increasing or decreasing SKU count and space, and making
one-in-one-out changes to assortments;
- •
- "What if" analyses—enables retailers to run multiple scenarios
and compare results to identify the best strategy to meet company objectives such as protecting private label items and image items; and
- •
- Macro-space optimization—enables retailers to add or decrease category space within the store layout in order to maximize category growth and customer loyalty.
DemandTec Shopper Insights™ (for Retail)
The DemandTec Shopper Insights™ solution includes the analytical services to segment shoppers into discrete groups that a CP company or retailer can target with merchandising and marketing programs, as well as the software service that makes those segments actionable.
Shopper Insights
This software service provides powerful analysis capabilities as well as highly actionable delivery of insights. The key features of this software service are:
- •
- InsightCenter—the InsightCenter is an online collection of
dashboards that are designed to provide comprehensive analysis into shopper segments and the shopper behavior of those segments in the retailer's stores.
- •
- Insights Embedded—in addition to the dashboards housed in InsightCenter, Shopper Insights can also deliver a subset of those insights directly at the point of decision within the other DemandTec software services.
17
DemandTec Marketing Plan Optimization™ (for CP)
The DemandTec Marketing Plan Optimization™ solution enables CP company executives and brand managers to develop strategic marketing investment allocation decisions and optimize marketing mix decisions across the spectrum of trade and consumer vehicles, and includes:
Strategic Marketing Planning
Unlike a traditional, one-time marketing mix study, Strategic Marketing Planning is a software service that enables users to continually test the impact of shifting capital across marketing and trade categories and different marketing vehicles with visibility into critical volume and profit metrics. Key features of Strategic Marketing Planning include:
- •
- Optimization and forecasting—decomposes volume into drivers
and inhibitors and accurately predicts volume and financial impact of multiple marketing mix variables and decisions;
- •
- What-if analysis—enables users to configure and
predict multiple scenarios for comparison in addition to automated optimization; and
- •
- Continuous planning/course corrections—tracks actual sales over time and enables course correction decisions in a dynamic, continuous manner throughout a year or other planning period.
DemandTec Total Trade Optimization™ (for CP)
The DemandTec Total Trade Optimization™ solution enables CP companies to optimize and manage the full spectrum of trade funds decisions ranging from strategic trade planning, customer trade planning, deal management and negotiation with retailers, and post-event analytics.
Strategic Trade Planning
Strategic Trade Planning enables headquarter-driven funds allocation and price and promotion simulation across broad geographies, accounts, and brands. These insights can guide and inform downstream customer trade planning decisions. Key features include:
- •
- Optimization and forecasting—accurately predict key volume and
financial metrics for shelf price changes, promotion support changes, and timing of events;
- •
- Common analytical platform—optimize trade planning with
unified pricing and promotion planning based on the same underlying consumption data;
- •
- Plan based on multiple hierarchies—create plans, reporting,
and reconciliation across markets, channels, regions, accounts, categories, and brands; and
- •
- Align brand and customer teams—pass along annual objectives and guidelines to inditate customer planning process (see DemandTec's Customer Trade Planning software service).
Customer Trade Planning
Customer Trade Planning enables customer-facing teams to develop and simulate individual price and promotion events, and entire category plans. Key features of the Customer Trade Planning software service include:
- •
- Optimization and forecasting—accurately predict key volume and
financial metrics for brands and overall retail category;
- •
- Common analytical platform—optimize trade planning with unified pricing and promotion planning based on the same underlying consumption data;
18
- •
- Comprehensive trade planning use cases—create, forecast and
build plans that include periodic trade promotions (i.e., temporary discounts with or without ad or display support) as well as price advances or buy-downs of the retail price using
trade promotion funds; and
- •
- Demand elasticity curves for every item in the category—quantify the financial impact of competitive trade activity against promoted items, total portfolio and even a retailer's entire category.
Advanced Deal Management
Advanced Deal Management provides capabilities that are tailored for CP companies and CP brokers to capture greater value from the online trade promotion offer management experience. As a paid upgrade to the basic Deal Management service, Advanced Deal Management provides a CP company-centric set of reports and workflow privileges that help further reduce costs, increase user effectiveness and enhance data visibility. Advanced Deal Management subscribers also have access to add-on services that are unavailable to basic Deal Management subscribers. Key features of Deal Management for CP companies and CP brokers include:
- •
- Role-based access—access to multiple users by
product line enables rapid and more effective user adoption;
- •
- Customized item catalog—CP-centric item catalog
customized by promoted group supports a more logical way of building and entering promotions;
- •
- Long-term deal archive—full seven-year
history of all promotion offer data, including full documentation of promotion offer versions and written negotiations between retail trading partners supports, among other benefits, compliance with
regulatory requirements;
- •
- Advanced data reporting—detailed reporting and data export
features support better business decisions; and
- •
- Funds tracking—accurate visibility into available trade spending balances and the ability to reconcile planned trade promotion activity against actual in-store execution.
DemandTec Shopper Marketing Optimization™ (for CP)
The DemandTec Shopper Marketing Optimization™ solution enables CP companies to make informed shopper insights and assortment planning decisions leveraging retail customer data and collaborative business processes on the DemandTec network. This solution is enabled for a CP company based on a retailer deploying the DemandTec Assortment & Space™ solution and the DemandTec Shopper Insights™ solution. The CP companies on the network, as part of a collaborative program with the retailer, receive access to the Shopper Insights and Assortment Optimization software services.
DemandTec Connect™ (for Retail and CP)
In addition to the industry solutions and software services above, the DemandTec offering also includes DemandTec Connect™, a set of capabilities on the network for both retailers and CP companies. DemandTec Connect™ delivers social messaging and collaboration capabilities to users on the DemandTec network. DemandTec Connect enables users to be more productive and keep institutional knowledge in context and integrated with business applications. DemandTec Connect translates capabilities first popularized by consumer social networks into business-oriented features, including:
- •
- Profiles: DemandTec users can put a face to a name and learn more about their colleagues and partners on the network by customizing their profile.
19
- •
- Community: DemandTec customers can establish any number of
communities or work groups, comprising other related users on the network. A community could be a small internal pricing team or cross-company lines and include a retail merchant and his or her
supplier contacts.
- •
- Sharing: Excel files and other documents associated with
the merchandising and marketing activities performed using DemandTec can be shared online with other members of a community. Other community members can comment on shared files and add to the
conversation.
- •
- Following: Users can follow other users or objects (such as a category plan or a master calendar) and automatically receive updates in a real-time activity feed to their desktop. DemandTec Connect is also designed to integrate with and extend other social platforms or broader enterprise knowledge management solutions.
Consulting Services
Our consulting services organization works closely with our customers to implement our software so that our customers can rapidly begin to achieve their merchandising and marketing objectives. The organization consists of field consultants and project managers, technology integration specialists, modeling experts, and training specialists with experience in implementing software in various retail and CP segments. Depending on a specific customer's requirements, we also may engage third parties to assist with implementations. We generally make our software available to a customer within two weeks of signing its agreement, with several product categories being fully operational within a matter of months.
The Analytical Services group within our consulting services organization works with prospects and customers to identify actionable insights in order to improve our customers' returns on investment from using our software. Leveraging our software platform, retailer transaction-log/loyalty data, and additional third-party data sources, we offer a number of strategic analytical insights both as part of our software and as customer-specific services.
The education group within our professional services organization provides education and training services to our customers and partners. The education group works closely with each customer or partner to design and deliver a training curriculum to match its needs. We deliver courses through lectures, written materials and e-learning modules. We also offer a "train-the-trainer" program for customers with extensive or ongoing training requirements.
Science and Technology
Science
Our software not only incorporates the typical workflow and business process management capabilities offered by many enterprise software companies, but also is science-based and applies advanced statistical analytics in the following areas:
Demand Modeling. Our software uses complex econometric models designed to predict accurately the sales volume of products under varying merchandising conditions and at various prices, which enables customers to determine the factors that influence consumer demand for a given product and location, and to what extent. Our proprietary demand models quantify consumer response to different merchandising and marketing activities, environmental factors and elements of consumer behavior across various consumer segments. Since our models are non-linear, they are able to capture the complex underlying relationships between consumer demand and the factors that influence that demand.
Shopper Segmentation and Shopper Insights. Individual shoppers and particular shopper segments respond differently to price changes for different items. By applying various data mining and statistical techniques to analyze sales data and combining the results with additional data such as demographics, buying histories and item affinities, our software enables our customers to understand consumer and product segmentation more fully, to determine more effective product assortments, and to design more individualized promotion offers.
20
Forecasting and Simulation. Our forecasting software enables our customers to determine the likely revenue, profit and sales volumes for specific product categories, brands or promoted groups at the store/item level for a given set of prices and merchandising conditions. Our software does this by incorporating and analyzing factors such as product distribution, assortment and complementarity, cannibalization, incrementality, transferable demand, stockpiling by consumers, equivalent volumes and discrete events such as holidays and localized merchandising categories. Our software also quantifies and forecasts the store/item level margin impact caused by varying supply chain costs.
Optimization and Rules Enforcement. While demand modeling is a powerful tool that can provide quantifiable benefits, achieving those benefits would be difficult if our software relied solely upon modeling, because of the large number of possibilities that our models generate. Our optimization science uses a combination of complex algorithms to help customers determine prices, promotions and markdowns that best accomplish their objectives, while complying with their business rules. These algorithms are designed to ensure accurate results and incorporate rule relaxation that automatically resolves conflicts in business rules according to the customer's preferences.
Technology
Data Processing. We receive and process multiple terabytes of customer data, including transaction-log/loyalty data. This information is provided by retailers, CP companies and syndicated data providers on a daily or weekly basis. We process data through our proprietary software platform, which integrates, validates and cleanses multiple data types and enhances data quality by identifying and correcting common data problems.
Grid Computing. The implementation of our advanced mathematical software requires substantial computing resources. To address this challenge, we distribute our software across a scalable grid of servers. This approach allows us to automatically partition large computational problems into smaller computations and to execute those computations in parallel across the grid. We design our grid architecture to ensure that optimizations are completed reliably and that computing resources are allocated dynamically to our various customers.
Enterprise Application Technology. With the exception of customers who licensed Connect3 and AIS software prior to their replatformings by DemandTec, our customers access our software through a web browser and no software is installed on our customers' premises. Our portal technology allows us to incorporate content from other sources and allows our content to be shown in other applications and portals. Customers can configure the user interface, customer-specific fields, customer-specific workflow behavior and portal layout and content. Our scalable architecture allows us to add new customers without requiring us to make substantial incremental investments in IT infrastructure.
Enterprise Integration. We provide multiple integration points with our customers' IT systems. Large incoming and outgoing data feeds use data-level integration to transfer bulk files on an automated basis. We use industry-standard web services protocols to communicate with customer systems and to process customer system requests. Our portal technology enables user interface-layer integration between our system and our customers' systems, allowing us to display content served by customer or partner systems and to serve content to customer systems using industry-standard protocols.
SaaS Operations
Our operations organization is responsible for delivering our software-as-a-service to our customers, which includes quality assurance, release deployment, database management and software tuning, systems monitoring and proactive problem detection and prevention, application availability and customer support.
Under our SaaS model, we currently release a new software version approximately every quarter, each one containing significant new functionality. Releases are deployed simultaneously to our customers. Prior
21
to deployment, each release undergoes multi-stage testing and substantial quality assurance, including build acceptance tests, regression test cases, customer integration tests and final system verification tests.
Our software is hosted in three data centers located in San Jose, California, Sacramento, California, and Mesa, Arizona. Each of these facilities includes advanced security, power redundancy, and disaster mediation safeguards and procedures such as biometric access control, onsite power generation and earthquake hardening.
We have implemented a comprehensive information security management program. As part of this program, our processes and procedures include: logical access controls such as certificate authentication, role-based authorization and detailed system logging; vulnerability management assessment and remediation; network security measures including encryption, firewalls and monitoring; strict data and software back-up procedures with regular rotations to a secure, offsite storage location; and network and system redundancy to provide software resiliency.
In February 2011, an independent accounting and auditing firm completed an audit of our controls over information technology and processes in accordance with Statement on Auditing Standards No. 70, or SAS 70. This firm issued a SAS 70 Type II report confirming that suitably-designed controls were in place and operating effectively.
Superior customer support is critical to customer satisfaction and to retaining and expanding our customer base. By leveraging our relationship with Sonata Services Limited in Shanghai, China, discussed below in "Research and Development," we are able to provide customer support 24 hours a day, seven days a week through our support web portal and by telephone. Since we manage our software for our customers, we often are able to detect and resolve delivery problems or processing capacity needs well in advance of when a customer might actually notice the problem.
Our Customers
Today, our software-as-a-service is used by approximately 355 customers worldwide in the retail and CP industries. Retailers together accounted for approximately 81% of our revenue in fiscal 2011 and CP companies accounted for approximately 19% of our revenue in fiscal 2011. Target Corporation, our largest customer in fiscal 2011, and Wal-Mart Stores, Inc. accounted for approximately 21% and 11%, respectively, of our revenue in fiscal 2011.
Sales and Marketing
We sell our solutions through our direct sales organization, often in cooperation with entities such as systems integration firms, strategy consultants and syndicated data providers. Our field organization, comprising sales and services, is divided into two distinct teams, one serving retailers and one serving CP companies. We assign our sales directors to specific named target accounts. Solution consultants assist our sales directors in providing detailed technical and business expertise. After the first year of a customer's agreement term, we assign a strategic account executive who is responsible for managing the customer's satisfaction, agreement renewals and sales of additional software and services. Outside the United States, we have a sales presence in the United Kingdom, France, and Latin America.
Our marketing group assists our direct sales, partner, and professional services organizations by providing sales tools, programs, and training. Our outbound marketing programs are designed to develop awareness of DemandTec and generate demand for our products and to build our brand through participation in a variety of industry events, public relations, web-based seminar campaigns, and other activities targeted at key executives, decision-makers, and influencers in the industries we serve.
Our industry marketing and product management teams also engage in inbound marketing efforts by collaborating on market research to analyze new market and product opportunities, assess and predict industry trends, and work directly with our customers to identify, prioritize, and plan new solutions and
22
new product enhancements. In addition, every year we host DemandBetter, a three-day conference for our customers that brings together executives from retailers and CP companies to share strategies and best practices. The conference features in-depth product, science, and customer case study sessions.
Strategic Relationships
We continually seek to develop and foster alliances with third parties whose products, technologies and services complement our offerings. We work with industry leaders that assist in joint sales activities, software implementation, and related strategy engagements. These relationships vary in complexity and scope and range from formal global alliances to informal regional relationships. Four firms with which we collaborate globally include The Nielsen Company, International Business Machines Corporation, or IBM, Accenture LLP, and Bain & Company. We have had success working with these companies, and we believe that we can continue to work together to provide complementary solutions.
- •
- Nielsen is a leading marketing information provider. In 2009, we extended our exclusive 2005 agreement with Nielsen to
continue to deliver consumer-centric merchandising solutions to fast moving consumer goods (FMCG) retailers around the globe. Retailers utilizing both our and Nielsen's offerings can access a
combination of consumer and market information, demand-modeling science and optimization software to generate merchandising plans.
- •
- The Global Business Services division of IBM provides business process outsourcing, systems integration and general
consulting services. IBM has pre-existing relationships with many of our retail customers and prospects. We have worked with IBM to jointly sell and implement our solutions in multiple
geographies.
- •
- Accenture has strong retail and CP industry practices that include expertise and solutions focused on precision pricing
and trade optimization. We have successfully collaborated with Accenture on joint sales and implementation efforts for a number of retail and consumer goods manufacturer customers around the globe.
- •
- Bain & Company serves the retail and CP industries with strategic consulting services that are complementary with DemandTec's software and analytical services and we have collaborated on providing a total solution for strategy, planning, and execution for our joint customers.
Research and Development
Under our SaaS model, we maintain and support only one version of our software. This enables us to focus our research and development expenditures on researching new methodologies for understanding and predicting consumer demand and developing new features and functionality. We concentrate our research and development efforts on:
- •
- improving our statistical modeling capabilities and advanced optimization techniques to enhance our understanding of
consumer demand and customer segmentation;
- •
- enhancing existing software services and developing new software services that leverage our software platform to address a
broader set of business requirements;
- •
- enhancing our existing analytical services and developing new analytics and solutions; and
- •
- expanding the collaborative and community-oriented capabilities that connect our software services, our analytics services, and all of our users in a single online collaborative optimization network.
We have assembled an experienced science and modeling organization comprising experts in econometrics and advanced mathematics, as well as a core group of engineers with experience working with massive amounts of data and backgrounds in scientific engineering. Our engineering design team is predominantly located in San Mateo, California, but we also utilize engineering teams in India and Russia
23
as well as a group of software engineers employed by Sonata IT Services Limited ("Sonata") in Shanghai, China. Sonata provides dedicated engineers for software development, sustaining engineering, quality assurance and testing, operations, and customer support. We pay a negotiated, fixed monthly fee for each dedicated individual. Fees are paid monthly in arrears in U.S. dollars. The term of the agreement runs through the end of April 2012, and there can be no assurance that we will be able to renew this agreement on acceptable terms or at all. We may terminate this agreement at any time upon written notice, subject to certain scale-down restrictions. We have an option to acquire the operations of Sonata that relate to our business at any time at a pre-negotiated formula.
As of February 28, 2011, we had 130 employees in our research and development located in the U.S. and India, an additional 76 Sonata engineers in China, and eight engineers in Moscow dedicated to our projects. Our research and development expenses were approximately $32.3 million, $32.3 million, and $26.8 million in fiscal 2011, 2010, and 2009, respectively.
Competition
The market for consumer demand software varies greatly by industry and business application, is rapidly evolving and fragmented, and is subject to shifting customer needs and changing technology. We compete primarily with vendors of packaged software, whose software is installed by customers on their own premises and with consulting organizations. For some software services, we compete to some degree with internally-developed solutions. Our current principal competitors include:
- •
- enterprise software application vendors such as SAP AG and Oracle Corporation;
- •
- niche retail software vendors, such as KSS Group (acquired by dunnhumby USA) and Revionics, Inc.;
- •
- statistical tool vendors such as SAS, Inc.;
- •
- marketing information providers for the CP industry such as The Nielsen Company and Information Resources, Inc.;
and
- •
- strategy and business consulting firms such as McKinsey & Company, Inc., Deloitte & Touche LLP and Accenture LLP.
Many of our current and potential competitors have a larger installed base of users, longer operating histories, greater brand recognition and substantially greater financial, technical, marketing, service, and other resources than we have. Competitors with greater financial resources may be able to offer lower prices, additional products or services, or other incentives that we cannot match or offer. In addition, niche retail software vendors may compete with us on price to attract smaller retailers. Further, larger retailers and CP companies historically have tended to invest in in-house applications and advanced analytics provided by business consulting firms, marketing information providers and statistical tools vendors.
We believe the principal competitive factors in our markets include the following:
- •
- demonstrated customer successes and the attendant retail and CP domain expertise in both domestic and foreign markets;
- •
- the quality, scalability, and comprehensiveness of science and technology to manage large data sets, model consumer demand
accurately, and optimize pricing and other merchandising and marketing decisions, and provide collaboration opportunities for both sides of the industry;
- •
- the ability to offer a network-based solution that is accessed by both retailers and CP companies;
- •
- the ability to drive predictable revenue, profitability, sales volume and customer loyalty improvements;
- •
- the ease and speed of software implementation and use;
24
- •
- the ability to enhance science and technology rapidly to meet a broader set of consumer behavior dynamics;
- •
- the performance, scalability and flexibility of the software;
- •
- the interoperability of the software with the customer's legacy systems;
- •
- the cost of the software and the related implementation process; and
- •
- the vendor's reputation.
We believe that we compete favorably with our competitors on the basis of these factors, when evaluated in totality. Enterprise software application vendors offer applications that require implementation of highly-customized, static software code at each customer's site. These providers market multiple applications to the same customer, advertising a more uniform and interoperable IT environment. Our software is provided through a SaaS delivery model that is designed to allow quick access to more dynamic software with significantly less costly and time-consuming on-site implementation. Our SaaS model also reduces dependence upon a customer's internal IT resources and therefore decreases the costs associated with interoperability with legacy systems. We believe that we may not compete as favorably for retail customers with annual sales below $500 million, who may not consider their potential return from incremental changes in revenue or profitability sufficiently compelling to purchase a higher cost, higher value solution. These retailers may instead choose less expensive, less feature rich solutions offered by niche retail software vendors, statistical tools companies or business consulting firms.
If we are not able to compete successfully against our current or future competitors, it will be difficult to acquire and retain customers, and our business, financial condition and operating results will be harmed.
Intellectual Property
We believe that our proprietary mathematical algorithms, statistical models and techniques and unique software architecture differentiate us from other consumer demand companies, as they enable us to help our customers understand and forecast consumer behavior more completely. Our success depends on our ability to continue to innovate in science and engineering and to protect our core intellectual property. Our intellectual property strategy relies on a combination of trade secrets, patents, copyrights, trademarks and contractual confidentiality agreements.
We currently have 24 issued patents and 21 patent applications in the United States, and 6 issued patents and 6 patent applications internationally. The expiration dates of our issued patents range from 2020 to 2023. We focus our patent efforts in the United States, but from time to time we will file corresponding foreign patent applications in strategic areas such as Europe and Asia. Our patent strategy balances strategic importance, competitive assessment and the need to maintain costs at a reasonable level, and we do not depend on any specific patent or set of patents to conduct our business operations. We may not receive competitive advantages from any rights granted under our existing patents. We do not know whether any of our patent applications will result in the issuance of any further patents or whether the examination process will require us to narrow the scope of our claims. To the extent any of our applications proceeds to issuance as a patent, the future patent may be opposed, contested, circumvented, designed around by a third party, or found to be unenforceable or invalidated. In addition, our future patent applications may not be issued with the scope of the claims sought by us, if at all, or the scope of claims we are seeking may not be sufficiently broad to protect our proprietary technologies. Others may develop technologies that are similar or superior to our proprietary technologies, duplicate our proprietary technologies or design around patents owned or licensed by us. If our products, patents or patent applications are found to conflict with any patent held by third parties, we could be prevented from selling our products, our patents could be declared invalid or our patent applications might not result in issued patents.
25
We have registered the trademark DemandTec in the United States, China, Japan, the European Union, Colombia and certain other countries. We have also registered the DemandTec logo in the United States and the European Union. We have filed other trademark applications in the United States and certain other countries.
In addition to filing patent applications and registering trademarks, we also rely in part on United States and international copyright laws to protect our software. Furthermore, we control access to and use of our proprietary software and other confidential information through the use of internal and external controls, including signing non-disclosure agreements with contractors, customers and partners. In addition, all of our employees and consultants are required to execute proprietary information and invention assignment agreements in connection with their employment and consulting relationships with us, pursuant to which they agree to maintain the confidentiality of our proprietary information and they grant us ownership rights in all inventions they reduce to practice in the scope of performing their employment or consulting services. However, we cannot provide any assurance that employees and consultants will abide by these agreements.
Despite our efforts to protect our trade secrets and proprietary rights through patents, licenses and confidentiality agreements, unauthorized parties may still copy or otherwise obtain and use our software and technology. In addition, we intend to expand our international operations, and effective patent, copyright, trademark and trade secret protection may not be available or may be limited in foreign countries. If we fail to protect our intellectual property and other proprietary rights, our business could be harmed.
Employees
As of February 28, 2011, we employed 340 full-time employees, including 130 in research and development, 75 in professional services, 56 in sales and marketing, 48 in general and administration, and 31 in operations and support. We have never had a work stoppage, and none of our employees is represented by a labor organization or under any collective-bargaining arrangements. We consider our employee relations to be good.
Available Information
Our Internet website address is www.demandtec.com. We provide free access to various reports that we file with or furnish to the Securities and Exchange Commission, or SEC, through our website, as soon as reasonably practicable after they have been filed or furnished. These reports include, but are not limited to, our Annual Reports on Form 10-K, quarterly reports on Form 10-Q, current reports on Form 8-K, and any amendments to those reports. Our SEC reports can be accessed through the investor relations section of our website, or through www.sec.gov. Information on our website does not constitute part of this Annual Report on Form 10-K or any other report we file or furnish with the SEC. Stockholders may request copies of these documents from:
DemandTec, Inc.
One Franklin Parkway, Building 910
San Mateo, California 94403
Attention: Investor Relations
26
Set forth below and elsewhere in this Annual Report on Form 10-K, and in other documents we file with the Securities and Exchange Commission, or SEC, are risks and uncertainties that could cause actual results to differ materially from the results contemplated by the forward-looking statements contained in this Annual Report on Form 10-K and in other written and oral communications from time to time. Because of the following factors, as well as other variables affecting our operating results, past financial performance should not be considered as a reliable indicator of future performance and investors should not use historical trends to anticipate results or trends in future periods.
Risks Related to Our Business and Industry
We may experience significant quarterly fluctuations in our operating results due to a number of factors, which makes our future operating results difficult to predict and could cause our operating results to fall below expectations.
Our quarterly operating results may fluctuate significantly due to a variety of factors, many of which are outside of our control. As a result, comparing our operating results on a period-to-period basis may not be meaningful. You should not rely on our past results as an indication of our future performance. If our operating results fall below the expectations of investors or securities analysts or below the guidance, if any, we provide to the market, the price of our common stock could decline substantially.
Factors that may affect our operating results include:
- •
- our ability to increase sales to existing customers and to renew agreements with our existing customers at comparable
prices, particularly larger retail customers;
- •
- our ability to attract new customers, particularly larger retail and consumer products customers in both domestic and
foreign markets;
- •
- changes in our pricing policies or those of our competitors, or pricing pressure on our software services;
- •
- periodic fluctuations in demand for our software and services;
- •
- volatility in the sales of our solutions on a quarterly basis and timing of the execution of new and renewal agreements
within such quarterly periods;
- •
- reductions in customers' budgets for information technology purchases and/or delays in their purchasing cycles;
- •
- our ability to develop and implement in a timely manner new software and enhancements that meet customer requirements,
including our ability to develop certain substantial and customer-specific functionality as required under certain customer engagements;
- •
- our ability to hire, train and retain key personnel;
- •
- our success in broadening the range of our offerings, including our ability to develop and sell solutions to apparel
retailers and to incorporate shopper segmentation and analytics into our offerings;
- •
- the short-term and long-term impacts of acquisitions of businesses or technologies, including the
expenses associated with integrating the acquired businesses or technologies into our operations or solutions and our ability to achieve sales growth and margin improvement;
- •
- any significant changes in the competitive dynamics of our market, including new entrants, new product introductions, or
substantial discounting of products;
- •
- our ability to control costs, including our operating expenses;
27
- •
- any significant change in our facilities-related costs;
- •
- the timing of hiring personnel and of large expenses such as those for trade shows and third-party professional services;
- •
- our ability to appropriately resolve any disputes with customers;
- •
- outages and capacity constraints with our hosting partners; and
- •
- the impact of global economic conditions on our business and the retail and CP industries, including any future customer insolvencies or bankruptcies.
We have in the past experienced, and we may continue to experience, significant variations in our level of sales on a quarterly basis, and we have at times failed to meet our internal periodic bookings plans. In the past, several of our customers have delayed or failed to renew their agreements with us upon expiration, or have renewed at lower prices. Such variations in our sales, or delays in signing or a failure to sign or renew significant customer agreements, have led to significant fluctuations in our cash flows and deferred revenue on a quarterly and annual basis. For example, we used approximately $6.8 million of net cash in operations in fiscal 2010, primarily due to the use of $10.5 million of net cash in operations in the third quarter, while we generated approximately $9.2 million and $13.8 million of net cash from operations in fiscal 2011 and 2009, respectively.
We have a history of losses and we may not achieve or sustain profitability in the future.
We have a history of losses and have not achieved profitability in any fiscal year. We had net losses of $13.7 million, $11.8 million and $5.0 million in fiscal 2011, 2010 and 2009, respectively. At February 28, 2011, we had an accumulated deficit of $102.9 million. We expect to continue to incur net losses in fiscal 2012 and perhaps beyond. In addition, our cost of revenue and operating expenses may increase in future periods as we implement initiatives to continue to grow our business, or if we need to procure additional capital equipment, software, or data center space to handle increased customer data. If we are unable to increase our revenue to offset these expected increases in our fixed costs and expenses, our losses will increase. Accordingly, we cannot provide assurance that we will be able to achieve or maintain profitability in the future.
We depend on a small number of customers, which are primarily large retailers, and, to a lesser extent, large consumer products companies, and our growth, if any, depends upon our ability to add new and retain existing large customers.
We derive a significant percentage of our revenue from a relatively small number of customers, which are primarily large retailers, and, to a lesser extent, large consumer products companies. The loss of any one or more of those customers could decrease our revenue and harm our current and future operating results. Our retail customers accounted for 81% of our revenue in fiscal 2011. Two customers accounted for approximately 21% and 11%, respectively, of our revenue in fiscal 2011 and one customer accounted for 14% of our revenue in fiscal 2010. In June 2010, we signed a multi-year agreement with Target for substantially all of our current and certain potential future software services. Revenue from Target represented approximately 21% of our revenue in fiscal 2011. Although our largest customers may vary from period to period, we anticipate that we will continue to depend on revenue from a relatively small number of our large retail customers. Further, our ability to grow revenue depends on our ability to increase sales to existing customers, to renew agreements with our existing customers and to attract new customers. In fiscal 2010, we did not add any significant large new retail customers and in fiscal 2011, we added a limited number of large retail customers. If we are unable to add new and retain existing large customers, this will adversely affect our revenue and results of operations.
28
The effects of adverse global economic conditions may adversely impact our business, operating results or financial condition.
Commencing in fiscal 2009, adverse global economic conditions caused a general tightening in the credit markets, lower levels of liquidity, increases in the rates of default and bankruptcy, and economic contraction. The retail and consumer products industries were and may continue to be especially hard hit by these economic developments, which in recent periods has resulted in some customers or potential customers delaying or not entering into new agreements or renewing their existing agreements with us. If global economic conditions have a material negative impact on our sales or prospects, our business, operating results or financial condition will be adversely impacted.
Our business depends substantially on customers renewing their agreements for our software. Any decline in our customer renewals would harm our operating results.
To maintain and grow our revenue, we must achieve and maintain high levels of customer renewals. We sell our software pursuant to agreements with initial terms that are generally from one to three years in length. Our customers have no obligation to renew their agreements after the expiration of their term. The fees we charge for our solutions vary based on a number of factors, including the software, service and hosting components provided, the size of the customer, and the duration of the agreement term. Our initial agreements with customers may include fees for software, services or hosting components that may not be needed upon renewal. As a consequence, if we renew these agreements, we may receive lower total fees. In addition, if an agreement is renewed for a term longer than the preceding term, we may receive total fees in excess of total fees received in the initial agreement but a smaller average annual fee because we generally charge lower annual fees in connection with agreements with longer terms. In any of these situations, we would need to sell additional software, services or hosting in order to maintain the same level of annual fees from that customer. There can be no assurance that we will be able to renew these agreements in a timely manner, on favorable terms, or at all, or to sell additional software or services or sell to new customers. In the past, certain of our customers have elected not to renew their agreements with us or have renewed on less favorable terms. Our customer renewal rates may decline or fluctuate as a result of a number of factors, including our customers' satisfaction or dissatisfaction with our software, the price of our software, the prices of competing products and services, consolidation within our customer base, customer bankruptcies, or reductions in our customers' information technology spending levels. If our customers do not renew their agreements for our software for any reason, or if they renew on less favorable terms, our revenue will decline and our cash flow will be negatively impacted.
Because we generally recognize revenue ratably over the terms of our customer agreements, the lack of renewals or the failure to enter into new agreements may not immediately be reflected in our statement of operations in any significant manner but may negatively affect revenue in future quarters.
We generally recognize revenue ratably over the terms of our customer agreements and invoice our customers in advance for annual use of our software and certain implementation services on a fixed fee basis. As a result, most of our quarterly revenue results from agreements entered into during previous quarters. Consequently, a decline in new or renewed agreements in a particular quarter, as well as any renewals at reduced annual dollar amounts, will not be reflected in any significant manner in our revenue for that quarter, but it will negatively affect revenue in future quarters. For example, in fiscal 2009 and fiscal 2010 the global economic environment deteriorated compared to prior periods. This resulted in delays in the execution of new and some renewal customer contracts, with some customers or potential customers electing not to enter into new or renewal contracts, and some other customers renewing at lower prices. Accordingly, our revenue growth slowed and revenue even declined in each of the quarters ended February 28, 2010 and May 31, 2010, respectively, compared to the immediately prior quarter.
29
We may expand through acquisitions of and/or partnerships with other companies, which may divert our management's attention and result in unexpected operating and technology integration difficulties, increased costs and dilution to our stockholders.
Our business strategy incorporates the acquisition of complementary software, technologies, or businesses. For instance, we recently acquired M-Factor, Inc. ("M-Factor") and substantially all of the assets of Applied Intelligence Solutions LLC ("AIS"). Acquisitions may result in unforeseen operating difficulties and expenditures. In particular, we may encounter difficulties in assimilating or integrating the businesses, technologies, services, products, personnel, or operations of the acquired companies, especially if the key personnel of the acquired company choose not to work for us, and we may have difficulty retaining the existing customers or signing new customers of any acquired business or migrating them to a software-as-a-service model. Acquisitions may also disrupt our ongoing business, divert our resources and require significant management attention that would otherwise be available for ongoing development of our current business. The successful integration of acquired businesses may be further complicated by our need to simultaneously support ongoing, complicated development efforts, such as our current efforts to integrate shopper segmentation and analytics into our offerings. We also may be required to use a substantial amount of our cash or issue equity securities to complete an acquisition, which could deplete our cash reserves and dilute our existing stockholders and could adversely affect the market price of our common stock. For example, we had cash outflows of approximately $9.0 million and $2.7 million in connection with our acquisitions of M-Factor and AIS in March 2011 and December 2010, respectively. Moreover, we cannot assure you that the anticipated benefits of any acquisition, including our revenue or return on investment assumptions, would be realized or that we would not be exposed to unknown liabilities.
In addition, an acquisition may negatively impact our results of operations because we may incur additional expenses relating to one-time charges, write-downs, amortization of intangible assets, or tax-related expenses. For example, our acquisition of TradePoint in November 2006 resulted in approximately $1.1 million, $911,000, and $967,000 of amortization of purchased intangible assets in fiscal 2011, 2010, and 2009, and will result in amortization of approximately $540,000 in fiscal 2012 with declining amounts in fiscal 2013 and 2014. Our acquisition of Connect3 in February 2009 resulted in approximately $1.8 million and $2.2 million of amortization of purchased intangible assets in fiscal 2011 and 2010, respectively, and a $150,000 of write-off of in-process research and development costs in fiscal 2009. The remaining carrying amount of approximately $626,000 associated with the Connect3 acquisition will be fully amortized in fiscal 2012. We anticipate a significant increase in amortization expenses in fiscal 2012 and 2013 as a result of the M-Factor and AIS acquisitions.
We might require additional capital to support our business growth, and this capital might not be available on acceptable terms, or at all.
We intend to continue to make investments to support our business growth and may require additional funds to respond to business challenges and opportunities, including continued economic concerns as well as the need to develop new software or enhance our existing software, enhance our operating infrastructure and acquire complementary businesses and technologies. We have a loan agreement with a financial institution that has a maturity date of May 7, 2012 under which we have a $20.0 million revolving line of credit. However, we may need to engage in equity or debt financings or enter into additional credit agreements to secure additional funds. If we raise additional funds through further issuances of equity or convertible debt securities, our existing stockholders could suffer significant dilution, and any new equity securities we issue could have rights, preferences and privileges superior to those of holders of our common stock. Any debt financing that we secure in the future could involve restrictive covenants relating to our capital-raising activities and other financial and operational matters that make it more difficult for us to obtain additional capital and to pursue business opportunities, including potential acquisitions. In addition, we may not be able to obtain additional financing on terms
30
favorable to us, if at all. If we are unable to obtain adequate financing or financing on terms satisfactory to us, when we require it, our ability to continue to support our business growth and to respond to business challenges could be significantly limited.
Our sales cycles are long and unpredictable, and our sales efforts require considerable time and expense.
We market our software to large retailers and CP companies, and sales to these customers are complex efforts that involve educating our customers about the use and benefits of our software, including its technical capabilities. Customers typically undertake a significant evaluation process that can result in a lengthy sales cycle, in some cases over 12 months. We spend substantial time, effort, and money in our sales efforts without any assurance that our efforts will generate long-term agreements or any revenue. In addition, customer sales decisions are frequently influenced by macroeconomic factors, budget constraints, multiple approvals, changes in key customer personnel, and unplanned administrative, processing and other delays. If sales expected from a specific customer are not realized, our revenue and, thus, our future operating results could be adversely impacted.
Our business will be adversely affected if the retail and CP industries do not widely adopt technology solutions incorporating scientific techniques to understand and predict consumer demand to make pricing and other merchandising decisions, as well as our related collaborative network strategy.
Our software addresses the new and emerging market of applying econometric modeling and optimization techniques through software to enable retailers and CP companies to understand and predict consumer demand in order to improve their pricing, promotion, and other merchandising and marketing decisions. These decisions are fundamental to retailers and CP companies. Accordingly, our target customers may be hesitant to accept the risk inherent in applying and relying on new technologies or methodologies to supplant traditional methods. Our business model also relies on these retailers and CP companies adopting and embracing the full features and functionality available on our network for inter- and intra-company collaborative interaction. Our business will not be successful if retailers and CP companies do not embrace the use of software to enable more strategic pricing and other merchandising decisions, or otherwise embrace our collaborative network strategy.
If we are unable to continue to enhance our current software, which is becoming increasingly complex, or to develop or acquire new software to address changing business requirements, we may not be able to attract or retain customers.
Our ability to attract new customers, renew agreements with existing customers and maintain or increase revenue from existing customers will depend in large part on our ability to anticipate the changing needs of the retail and CP industries, to enhance our increasingly complex existing software and to introduce new software that meet those needs. Certain of our implementation and integration engagements, particularly with respect to initial deployment with larger customers, have become increasingly complex. Further, certain of our engagements require, and other future engagements may require, us to develop certain substantial and customer-specific functionality. Such engagements can be significantly more time-consuming and complicated than our other customer engagements. Any new software may not be introduced in a timely or cost-effective manner and may not achieve market acceptance, meet customer expectations or contractual commitments, or generate revenue sufficient to recoup the cost of development or acquisition of such software. For example, we have not yet completed development or achieved market acceptance of certain components of our solutions with respect to which we have made certain commitments to engage in development efforts on a commercially reasonable basis. In addition, we have recently made certain investments in assets and technology related to apparel retailing. If we are unable to successfully develop or acquire new software and enhance our existing applications to meet customer requirements, we may not be able to attract or retain customers.
31
Understanding and predicting consumer behavior is dependent upon the continued availability of accurate and relevant data from retailers and third-party data aggregators. If we are unable to obtain access to relevant data, or if we do not enhance our core science and econometric modeling methodologies to adjust for changing consumer behavior, our software may become less competitive or obsolete.
The ability of our econometric models to forecast consumer demand depends upon the assumptions we make in designing the models and in the quality of the data we use to build them. Our models rely on point of sale (POS), transaction log or loyalty program data provided to us directly by our retail customers and by third-party data aggregators. Consumer behavior is affected by many factors, including evolving consumer needs and preferences, new competitive product offerings, more targeted merchandising and marketing, emerging industry standards, and changing technology. Data adequately representing all of these factors may not be readily available in certain geographies or in certain markets. In addition, the relative importance of the variables that influence demand will change over time, particularly with the continued growth of the Internet as a viable retail alternative and the emergence of non-traditional marketing channels. If we are unable to obtain POS, transaction log or loyalty program data from our retail customers or from third-party data aggregators, or if we fail to enhance our core science and modeling methodologies to adjust for changes in consumer behavior, customers may delay or decide against purchases or renewals of our software.
We rely on our management team and will need additional personnel to grow our business, and the loss of one or more key employees or our inability to attract and retain qualified personnel could harm our business.
Our success depends to a significant degree on our ability to attract, retain and motivate our management team and our other key personnel. Our professional services organization and other customer-facing groups, in particular, play an instrumental role in ensuring our customers' satisfaction. In addition, our science, engineering, and modeling team requires experts in econometrics and advanced mathematics, and there are a limited number of individuals with the education and training necessary to fill these roles should we experience employee departures. All of our employees work for us on an at-will basis, and there is no assurance that any employee will remain with us. Our competitors may be successful in recruiting and hiring members of our executive management team or other key employees, and it may be difficult for us to find suitable replacements on a timely basis. Many of the members of our management team and key employees are substantially vested in their shares of our common stock or options to purchase shares of our common stock, and therefore retention of these employees may be difficult in the highly competitive market and geography in which we operate our business.
We have derived most of our revenue from sales to our retail customers. If our software is not widely accepted by CP companies, and our collaborative network strategy is not fully realized, our ability to grow our revenue and achieve our strategic objectives will be harmed.
To date, we have derived most of our revenue from retail customers. In fiscal 2011, we generated approximately 81% of our revenue from sales to retail customers, while we generated approximately 19% of our revenue from sales to CP companies. In fiscal 2010, we generated approximately 82% of our revenue from sales to retail customers while we generated approximately 18% of our revenue from sales to CP companies. In order to grow our revenue and to achieve our long-term strategic objectives, including growth of our retail and CP customer network, it is important for us to expand our sales to derive a more significant portion of our revenue from new and existing CP customers (including through our recent acquisition of M-Factor), and for those companies to actively participate in our collaborative network strategy. If CP companies do not widely accept our software, our revenue growth and business will be harmed.
32
We face intense competition that could prevent us from increasing our revenue and prevent us from becoming profitable.
The market for our software is highly competitive and we expect competition to intensify in the future. Competitors vary in size and in the scope and breadth of the products and services they offer. Currently, we face competition from traditional enterprise software application vendors such as Oracle Corporation and SAP AG, niche retail software vendors such as KSS Group (recently acquired by dunnhumby USA) and Revionics, Inc., and statistical tool vendors such as SAS, Inc. To a lesser extent, we also compete or potentially compete with marketing information providers for the CP industry such as The Nielsen Company and Information Resources, Inc., as well as business consulting firms such as McKinsey & Company, Inc., Deloitte & Touche LLP and Accenture LLP, which offer merchandising consulting services and analyses. Because the market for our solutions is relatively new, we expect to face additional competition from other established and emerging companies and, potentially, from internally-developed applications. This competition could result in increased pricing pressure, reduced profit margins, increased sales and marketing expenses and a failure to increase, or the loss of, market share.
Competitive offerings may have better performance, lower prices and broader acceptance than our software. Many of our current or potential competitors have longer operating histories, greater brand recognition, larger customer bases and significantly greater financial, technical, sales, research and development, marketing and other resources than we have. Competitors with greater financial resources may be able to offer lower prices, additional products or services, or other incentives that we cannot match or offer. As a result, our competition may be able to offer more effective software or may opt to include software competitive to our software as part of broader, enterprise software solutions at little or no charge.
We may not be able to maintain or improve our competitive position against our current or future competitors, and our failure to do so could seriously harm our business.
We rely on three third-party service providers to host our software, and any interruptions or delays in services from these third parties could impair the delivery of our software as a service or harm our reputation.
We deliver our software to customers over the Internet. The software is hosted in three third-party data centers located in San Jose and Sacramento, California, and Mesa, Arizona. We do not control the operation of any of these facilities, and we rely on these service providers to provide all power, connectivity and physical security. These facilities could be vulnerable to damage or interruption from earthquakes, floods, fires, power loss, telecommunications failures and similar events. They are also subject to break-ins, computer viruses, sabotage, intentional acts of vandalism and other misconduct. The occurrence of a natural disaster or intentional misconduct, a decision to close these facilities without adequate notice or other unanticipated problems could result in lengthy interruptions in our services. Additionally, because we currently rely upon disk and tape bond back-up procedures, but do not operate or maintain a fully-redundant back-up site, there is an increased risk of service interruption.
If our security measures are breached and unauthorized access is obtained to our customers' data, our operations may be perceived as not being secure, customers may curtail or stop using our software and we may incur significant liabilities.
Our operations involve the storage and transmission of our customers' confidential information, and security breaches could expose us to a risk of loss of this information, litigation and possible liability. If our security measures are breached as a result of third-party action, employee error, malfeasance or otherwise, and, as a result, someone obtains unauthorized access to our customers' data, our reputation will be damaged, our business may suffer and we could incur significant liability. Because techniques used to obtain unauthorized access or to sabotage systems change frequently and generally are not recognized until launched against a target, we may be unable to anticipate these techniques or to implement adequate preventative measures. If an actual or perceived breach of our security occurs, the market perception of
33
the effectiveness of our security measures could be harmed and we could lose potential sales and existing customers.
If we fail to respond to rapidly changing technological developments or evolving industry standards, our software may become less competitive or obsolete.
Because our software is designed to operate on a variety of network, hardware and software platforms using standard Internet tools and protocols, we will need to modify and enhance our software continuously to keep pace with changes in Internet-related hardware, software, communication, browser and database technologies. Furthermore, uncertainties about the timing and nature of new network platforms or technologies, or modifications to existing platforms or technologies, could increase our research and development expenses. If we are unable to respond in a timely manner to these rapid technological developments, our software may become less marketable and less competitive or obsolete.
Our use of open source software and third-party technology could impose limitations on our ability to commercialize our software.
We incorporate open source software into our software. Although we monitor our use of open source software closely, the terms of many open source licenses have not been interpreted by United States courts, and there is a risk that these licenses could be construed in a manner that imposes unanticipated conditions, costs, or restrictions on our ability to commercialize our software. In that event, we could be required to seek licenses from third parties in order to continue offering our software, to re-engineer our technology or to discontinue offering our software in the event re-engineering cannot be accomplished on a timely basis, any of which could adversely affect our business, operating results and financial condition. We also incorporate certain third-party technologies, including software programs and algorithms, into our software and may desire to incorporate additional third-party technologies in the future. Licenses to new third-party technologies may not be available to us on commercially reasonable terms, or at all.
If we are unable to protect our intellectual property rights, our competitive position could be harmed and we could be required to incur significant expenses in order to enforce our rights.
To protect our proprietary technology, including our core statistical and mathematic models and our software, we rely on trade secret, patent, copyright, service mark, trademark and other proprietary rights laws and confidentiality agreements with employees and third parties, all of which offer only limited protection. Despite our efforts, the steps we have taken to protect our proprietary rights may not be adequate to preclude misappropriation of our proprietary information or infringement of our intellectual property rights, and our ability to police that misappropriation or infringement is uncertain, particularly in countries outside of the United States, including China, Russia, and India, where we conduct (or third parties conduct on our behalf) a portion of our development activity. Further, we do not know whether any of our pending patent applications will result in the issuance of patents or whether the examination process will require us to narrow our claims. Our current patents and any future patents that may be issued may be contested, circumvented or invalidated. Moreover, the rights granted under any issued patents may not provide us with proprietary protection or competitive advantages, and, as with any technology, competitors may be able to develop technologies similar or superior to our own now or in the future.
Protecting against the unauthorized use of our trade secrets, patents, copyrights, service marks, trademarks and other proprietary rights is expensive, difficult and not always possible. Litigation may be necessary in the future to enforce or defend our intellectual property rights, to protect our trade secrets or to determine the validity and scope of the proprietary rights of others. This litigation could be costly and divert management resources, either of which could harm our business, operating results and financial condition. Furthermore, many of our current and potential competitors have the ability to dedicate substantially greater resources to enforcing their intellectual property rights than we do. Accordingly, despite our efforts, we may not be able to prevent third parties from infringing upon or misappropriating our intellectual property.
34
We cannot be certain that the steps we have taken will prevent the unauthorized use or the reverse engineering of our technology. Moreover, others may independently develop technologies that are competitive to ours or infringe our intellectual property. The enforcement of our intellectual property rights also depends on our legal actions against these infringers being successful, but we cannot be sure these actions will be successful, even when our rights have been infringed. Furthermore, effective patent, trademark, service mark, copyright and trade secret protection may not be available in every country in which our services are available or where we have development work performed. In addition, the legal standards relating to the validity, enforceability and scope of protection of intellectual property rights in Internet-related industries are uncertain and still evolving.
Material defects or errors in our software or any failure to meet service level agreements with our customers could harm our reputation, result in significant expense to us and impair our ability to sell our software.
Our software is inherently complex and may contain material defects or errors that may cause it to fail to perform in accordance with customer expectations. Any defects that cause interruptions to the availability of our software could result in lost or delayed market acceptance and sales, require us to provide sales credits or issue refunds to our customers, cause existing customers not to renew their agreements and prospective customers not to purchase our software, divert development resources, hurt our reputation and expose us to claims for liability. After the release of our software, defects or errors may also be identified from time to time by our internal team and by our customers. In addition, we have entered into service level agreements with some of our customers warranting defined levels of uptime reliability and software performance and permitting those customers to receive service credits or discounted future services, or to terminate their agreements in the event that we fail to meet those levels. The costs incurred in correcting any material defects or errors in our software or in failing to meet any such service levels may be substantial.
Because our long-term success depends, in part, on our ability to operate and to expand sales of our software to customers located outside of the United States, our business may be increasingly susceptible to risks associated with international operations.
We have limited experience operating in international jurisdictions. In fiscal 2011 and 2010, approximately 13% and 14%, respectively, of our revenue was attributable to sales to companies located outside the United States. Our limited experience in operating our business outside of the United States increases the risk that any international expansion efforts that we may undertake will not be successful. In addition, conducting international operations subjects us to new risks that we have not generally faced in the United States. These include:
- •
- fluctuations in currency exchange rates;
- •
- unexpected changes in foreign regulatory requirements, including with respect to the enforcement of the Foreign Corrupt
Practices Act or the recently-adopted U.K. Bribery Act;
- •
- localization of our software, including translation of the interface of our software into foreign languages and creation
of localized agreements;
- •
- longer accounts receivable payment cycles and difficulties in collecting accounts receivable;
- •
- tariffs and trade barriers and other regulatory or contractual limitations on our ability to sell or develop our software
in certain international markets;
- •
- difficulties in managing and staffing international operations;
- •
- potentially adverse tax consequences, including the complexities of international value added tax systems and restrictions on the repatriation of earnings;
35
- •
- the burdens of complying with a wide variety of international laws and different legal standards, including local data
privacy laws and local consumer protection laws that could regulate retailers' permitted pricing and promotion practices;
- •
- potential interruption of internet access by foreign governments;
- •
- political, social and economic instability abroad, terrorist attacks and security concerns in general; and
- •
- reduced or varied protection of intellectual property rights in some countries, in particular China and Russia.
The occurrence of any of these risks could negatively affect our international business and, consequently, our results of operations.
Because portions of our software development, sustaining engineering, quality assurance and testing, operations and customer support are provided internationally, including by third parties in China and Russia, our business is susceptible to risks associated with having substantial operations overseas.
Portions of our software development, sustaining engineering, quality assurance and testing, operations and customer support are provided by Sonata Services Limited, or Sonata, a third party located in Shanghai, China, as well as to a more limited extent by a third party located in Russia and internal development resources in India. As of February 28, 2011, in addition to our 172 employees in our operations, customer support, science, product management and engineering groups located in the United States, an additional 76 Sonata personnel were dedicated to our projects. Remotely coordinating resources in China, Russia, and India requires significant management attention and substantial resources, and there can be no assurance that we will be successful in coordinating these activities. Furthermore, if there is a disruption to these operations, it will require that substantial management attention and time be devoted to achieving resolution. If our international third-party contractors were to stop providing these services or if there was widespread departure of their trained personnel, this could cause a disruption in our product development process, quality assurance and product release cycles and customer support organizations and require us to incur additional costs to replace and train new personnel.
Enforcement of intellectual property rights and contractual rights may be more difficult in China and Russia, and their laws and regulations may not be sufficient to cover all aspects of economic activities. In particular, because these laws and regulations are relatively new, and because of the limited volume of published decisions and their non-binding nature, the interpretation and enforcement of these laws and regulations involve uncertainties. Accordingly, the enforcement of our contractual arrangements with our international third-party contractors, our confidentiality agreements with each contractor dedicated to our work, and the interpretation of the laws governing this relationship are subject to uncertainty.
If we fail to maintain proper and effective internal controls, our ability to produce accurate financial statements could be impaired, which could adversely affect our operating results, our ability to operate our business and investors' views of us.
Ensuring that we have internal financial and accounting controls and procedures adequate to produce accurate financial statements on a timely basis is a costly and time-consuming effort that needs to be re-evaluated frequently. The Sarbanes-Oxley Act requires, among other things, that we maintain effective internal control over financial reporting and disclosure controls and procedures. In particular, we are required to perform annual system and process evaluation and testing of our internal control over financial reporting to allow management and our independent registered public accounting firm to report on the effectiveness of our internal control over financial reporting, as required by Section 404 of the Sarbanes-Oxley Act. In the future, our testing, or the subsequent testing by our independent registered public accounting firm, may reveal deficiencies in our internal control over financial reporting that are deemed to
36
be material weaknesses. Our compliance with Section 404 requires that we incur substantial accounting expense and expend significant management time on compliance-related issues. Moreover, if we are not able to comply with the requirements of Section 404 in the future, or if we or our independent registered public accounting firm identifies deficiencies in our internal control over financial reporting that are deemed to be material weaknesses, the market price of our common stock could decline and we could be subject to sanctions or investigations by the NASDAQ Stock Market, the Securities and Exchange Commission, or SEC, or other regulatory authorities, which would require additional financial and management resources.
Furthermore, implementing any appropriate future changes to our internal control over financial reporting may entail substantial costs in order to modify our existing accounting systems, may take a significant period of time to complete and may distract our officers, directors and employees from the operation of our business. These changes, however, may not be effective in maintaining the adequacy of our internal control over financial reporting, and any failure to maintain that adequacy, or consequent inability to produce accurate financial statements on a timely basis, could increase our operating costs and could materially impair our ability to operate our business. In addition, investors' perceptions that our internal control over financial reporting is inadequate or that we are unable to produce accurate financial statements may adversely affect our stock price. While neither we nor our independent registered public accounting firm has identified deficiencies in our internal control over financial reporting that are deemed to be material weaknesses, there can be no assurance that material weaknesses will not be subsequently identified.
If one or more of our key strategic relationships were to become impaired or if these third parties were to align with our competitors, our business could be harmed.
We have relationships with a number of third parties whose products, technologies and services complement our software. Many of these third parties also compete with us or work with our competitors. If we are unable to maintain our relationships with the key third parties that currently recommend our software or that provide consulting services on our software implementations or if these third parties were to begin to recommend our competitors' products and services, our business could be harmed.
Claims by others that we infringe their proprietary technology could harm our business.
Third parties could claim that our software infringes their proprietary rights. In recent years, there has been significant litigation involving patents and other intellectual property rights, and we expect that infringement claims may increase as the number of products and competitors in our market increases and overlaps occur. In addition, to the extent that we gain greater visibility and market exposure as a public company, we will face a higher risk of being the subject of intellectual property infringement claims. Any claims of infringement by a third party, even those without merit, could cause us to incur substantial defense costs and could distract our management from our business. Furthermore, a party making such a claim, if successful, could secure a judgment that requires us to pay substantial damages. A judgment could also include an injunction or other court order that could prevent us from offering our software. In addition, we might be required to seek a license for the use of the infringed intellectual property, which may not be available on commercially reasonable terms or at all. Alternatively, we might be required to develop non-infringing technology, which could require significant effort and expense and might ultimately not be successful.
Third parties may also assert infringement claims relating to our software against our customers. Any of these claims might require us to initiate or defend potentially protracted and costly litigation on their behalf, regardless of the merits of these claims, because in certain situations we agree to indemnify our customers from claims of infringement of proprietary rights of third parties. If any of these claims succeeds, we might be forced to pay damages on behalf of our customers, which could materially adversely affect our business.
37
Changes in financial accounting standards or practices may cause adverse, unexpected financial reporting fluctuations and affect our reported results of operations.
A change in accounting standards or practices could have a significant effect on our reported results and might affect our reporting of transactions completed before the change is effective. New accounting pronouncements and varying interpretations of accounting pronouncements have occurred in the past and may occur in the future. Changes to existing rules or the questioning of current practices may adversely affect our reported financial results or the way we conduct our business.
We have expanded our operations in recent periods. If we fail to manage this expansion effectively, we may be unable to execute our business plan, maintain high levels of customer service or address competitive challenges adequately.
We have expanded our overall business, headcount and operations in recent periods. For instance, our headcount grew from 198 employees at February 28, 2007 to 340 employees at February 28, 2011, and we added approximately 45 more employees in March 2011, as a result of our acquisition of M-Factor. Headcount in research and development increased from 99 employees at February 28, 2007 to 130 employees at February 28, 2011. We may need to continue to expand our operations in order to increase our customer base and to develop additional software. Increases in our customer base could create challenges in our ability to implement our software and support our customers. In addition, we will be required to continue to improve our operational, financial and management controls and our reporting procedures. As a result, we may be unable to manage our business effectively in the future, which may negatively impact our operating results.
Evolving regulation of the Internet may affect us adversely.
As Internet commerce continues to evolve, increasing regulation by federal, state or foreign agencies becomes more likely. For example, we believe increased regulation is likely in the area of data privacy, and laws and regulations applying to the solicitation, collection, processing, or use of personal or consumer information could affect our customers' ability to use and share data, potentially reducing demand for our software and restricting our ability to store and process data for our customers. In addition, taxation of software provided over the Internet or other charges imposed by government agencies or by private organizations for accessing the Internet may also be imposed. Any regulation imposing greater fees for Internet use or restricting information exchange over the Internet could result in a decline in the use of the Internet and the viability of Internet-based software, which could harm our business, financial condition and operating results.
Third-party claims and litigation could seriously harm our business.
We have from time to time become involved in legal matters that arise in the normal course of business and otherwise. There can be no assurance that third party claims and litigation that may arise in the future will not have a material adverse effect on our business, financial position, results of operations, or cash flows, including a loss of customers, or subject us to significant financial or other remedies.
We incur significant costs as a result of operating as a public company, and our management is required to devote substantial time to compliance efforts.
As a public company, we incur significant legal, accounting and other expenses. The Sarbanes-Oxley Act and the Dodd-Frank Wall Street Reform and Consumer Protection Act (the "Dodd-Frank Act"), and rules currently proposed or subsequently implemented by the SEC and the NASDAQ Global Market, impose additional requirements on public companies. The recently-adopted Dodd-Frank Act will subject us to significant additional executive compensation and corporate governance requirements, many of which have yet to be implemented by the SEC. Our management and other personnel need to devote a substantial amount of time to complying with these requirements. Moreover, these rules and regulations
38
have increased our legal and financial compliance costs and make some activities more time-consuming and costly. These rules and regulations could also make it more difficult for us to attract and retain qualified persons to serve on our board of directors and board committees or as executive officers and more expensive for us to obtain or maintain director and officer liability insurance.
Risks Related to Ownership of Our Common Stock
The trading price of our common stock has been volatile in the past, may continue to be volatile, and may decline.
The trading price of our common stock has fluctuated widely in the past and may do so in the future. Further, our common stock has limited trading history. Factors affecting the trading price of our common stock, many of which are beyond our control, could include:
- •
- variations in our operating results, including any decline in our revenues or material changes in our cash flows;
- •
- announcements of technological innovations, new products and services, acquisitions, strategic alliances or significant
agreements by us or by our competitors;
- •
- recruitment or departure of key personnel;
- •
- the financial projections we may provide to the public, any changes in these projections or our failure to meet these
projections;
- •
- changes in the estimates of our operating results or changes in recommendations by any securities analysts that elect to
follow our common stock;
- •
- potential dilution caused by future issuances of our stock, including through currently outstanding or future stock
options or restricted stock units;
- •
- market conditions in our industry, the retail industry and the economy as a whole;
- •
- price and volume fluctuations in the overall stock market;
- •
- lawsuits threatened or filed against us or other disputes;
- •
- adoption or modification of regulations, policies, procedures or programs applicable to our business; and
- •
- the volume of trading in our common stock, including sales upon exercise of outstanding options.
In addition, if the market for technology stocks or the stock market in general experiences loss of investor confidence as has happened in prior periods, the trading price of our common stock could decline for reasons unrelated to our business, operating results, or financial condition. The trading price of our common stock might also decline in reaction to events that affect other companies in our industry even if these events do not directly affect us. Some companies that have had volatile market prices for their securities have had securities class actions filed against them. A suit filed against us, regardless of its merits or outcome, could cause us to incur substantial costs and could divert management's attention.
Future sales of shares by existing stockholders, or the perception that such sales may occur, could cause our stock price to decline.
If our existing stockholders, particularly our directors and executive officers and other significant stockholders, sell substantial amounts of our common stock in the public market, or are perceived by the public market as intending to sell, the trading price of our common stock could decline.
39
If securities analysts do not publish research or publish unfavorable research about our business, our stock price and trading volume could decline.
The trading market for our common stock depends in part on the research and reports that securities analysts publish about us or our business. We have limited research coverage by securities analysts. If we do not obtain further securities analyst coverage, or if one or more of the analysts who cover us downgrade our stock or publish unfavorable research about our business, our stock price would likely decline. If one or more of these analysts cease coverage of our company or fail to publish reports on us regularly, demand for our stock could decrease, which could cause our stock price and trading volume to decline.
Insiders and other significant stockholders have substantial control over us and will be able to influence corporate matters.
At February 28, 2011, our directors, executive officers and holders of ten percent or more of our common stock beneficially owned, in the aggregate, approximately 21.9% of our outstanding common stock. As a result, these stockholders will be able to exercise significant influence over all matters requiring stockholder approval, including the election of directors and approval of significant corporate transactions, such as a merger or other sale of our company or its assets. This concentration of ownership could limit your ability to influence corporate matters and may have the effect of delaying or preventing a third party from acquiring control over us.
Anti-takeover provisions in our charter documents and Delaware law could discourage, delay or prevent a change in control of our company and may affect the trading price of our common stock.
We are a Delaware corporation and the anti-takeover provisions of the Delaware General Corporation Law may discourage, delay or prevent a change in control by prohibiting us from engaging in a business combination with an interested stockholder for a period of three years after the person becomes an interested stockholder, even if a change in control would be beneficial to our existing stockholders. In addition, our restated certificate of incorporation and amended and restated bylaws may discourage, delay or prevent a change in our management or control over us that stockholders may consider favorable. Our restated certificate of incorporation and amended and restated bylaws:
- •
- authorize the issuance of "blank check" preferred stock that could be issued by our board of directors to thwart a
takeover attempt;
- •
- establish a classified board of directors, as a result of which the successors to the directors whose terms have expired
will be elected to serve from the time of election and qualification until the third annual meeting following their election;
- •
- require that directors only be removed from office for cause and only upon a majority stockholder vote;
- •
- provide that vacancies on our board of directors, including newly created directorships, may be filled only by a majority
vote of directors then in office;
- •
- limit who may call special meetings of stockholders;
- •
- prohibit stockholder action by written consent, thus requiring all actions to be taken at a meeting of the stockholders;
- •
- require supermajority stockholder voting to effect certain amendments to our restated certificate of incorporation and
amended and restated bylaws; and
- •
- require advance notification of stockholder nominations and proposals.
40
Item 1B. Unresolved Staff Comments
None.
Our corporate headquarters and our primary facilities occupy approximately 82,000 square feet in San Mateo, California under a lease that has a total lease term of eight years with an initial non-cancellable lease term of five years commencing December 1, 2009. In addition, we lease approximately 3,660 square feet in La Mirada, California and approximately 9,706 square feet in Minneapolis, Minnesota. We also lease small sales and marketing, and research offices in the United States, Europe and India. The size and location of these properties change from time to time on the basis of business requirements. We do not own any real property. We operate three data centers. Our primary data centers are located in Mesa, Arizona and San Jose, California. The hosting agreements for Mesa and San Jose expire in October 2012 and August 2011, respectively.
We believe our facilities are adequate for our current needs and that suitable additional or substitute space will be available to accommodate any foreseeable expansion of our operations.
We have from time to time become involved in legal matters that arise in the normal course of business and otherwise. There can be no assurance that third party claims and litigation that may arise in the future will not have a material adverse effect on our business, financial position, results of operations, or cash flows, including a loss of customers, or subject us to significant financial or other remedies.
Item 4. (Removed and Reserved)
Not applicable.
41
Item 5. Market for Registrant's Common Equity, Related Stockholder Matters and Issuer Purchases of Equity Securities
Market Information. Our common stock has been listed on the NASDAQ Global Market under the symbol "DMAN" since August 9, 2007. Prior to that time, there was no public market for our common stock. The following table sets forth for the indicated periods the high and low sales prices by quarter for our common stock as reported by the NASDAQ Global Market.
Fiscal Year 2011 Quarters Ended:
|
High | Low | |||||
|---|---|---|---|---|---|---|---|
February 28, 2011 |
$ | 14.08 | $ | 10.05 | |||
November 30, 2010 |
$ | 11.11 | $ | 7.35 | |||
August 31, 2010 |
$ | 7.85 | $ | 5.34 | |||
May 31, 2010 |
$ | 7.05 | $ | 5.79 | |||
Fiscal Year 2010 Quarters Ended:
|
High | Low | |||||
|---|---|---|---|---|---|---|---|
February 28, 2010 |
$ | 9.50 | $ | 5.25 | |||
November 30, 2009 |
$ | 9.57 | $ | 7.83 | |||
August 31, 2009 |
$ | 10.00 | $ | 7.47 | |||
May 31, 2009 |
$ | 9.28 | $ | 6.65 | |||
Stockholders of Record. As of February 28, 2011, we had approximately 90 stockholders of record of our common stock.
Dividends. We have never declared or paid any cash dividends on our common stock. We currently intend to retain earnings, if any, to finance future growth, and therefore do not expect to pay cash dividends on our common stock in the foreseeable future. Any future determination to declare cash dividends will be made at the discretion of our board of directors and will be subject to compliance with certain covenants in our loan and security agreement with Silicon Valley Bank, which may restrict or limit our ability to pay dividends.
Securities Authorized for Issuance Under Equity Compensation Plans. For equity plan compensation information, please refer to Item 12 in Part III of this Annual Report on Form 10-K.
42
Stock Performance Graph and Cumulative Total Return
Notwithstanding any statement to the contrary in any of our previous or future filings with the Securities and Exchange Commission, or SEC, the following information relating to the price performance of our common stock shall not be deemed to be "filed" with the SEC or to be "soliciting material" under the Securities Exchange Act of 1934, as amended, or the Exchange Act, and it shall not be deemed to be incorporated by reference into any of our filings under the Securities Act of 1933, as amended, or the Exchange Act, except to the extent we specifically incorporate it by reference into such filing.
The graph below compares the cumulative total stockholder return of our common stock with that of the Nasdaq Composite Index and the Nasdaq Computer Index from August 9, 2007 (the date on which our common stock commenced trading on the NASDAQ Global Market) through February 28, 2011. The graph assumes that $100 was invested in shares of our common stock, the Nasdaq Composite Index and the Nasdaq Computer & Data Processing Index at the close of market on August 9, 2007, and that dividends, if any, were reinvested. The comparisons in this graph are based on historical data and are not intended to forecast or be indicative of future performance of our common stock.
Comparison of Cumulative Total Returns of DemandTec, Inc., Nasdaq Composite
Index and Nasdaq Computer & Data Processing Index
| |
8/9/07 | 8/31/07 | 2/29/08 | 8/31/08 | 2/28/09 | 8/31/09 | 2/28/10 | 8/31/10 | 2/28/11 | |||||||||||||||||||
|---|---|---|---|---|---|---|---|---|---|---|---|---|---|---|---|---|---|---|---|---|---|---|---|---|---|---|---|---|
DemandTec, Inc. |
$ | 100.00 | $ | 95.90 | $ | 101.50 | $ | 103.70 | $ | 73.60 | $ | 84.70 | $ | 58.70 | $ | 74.60 | $ | 130.10 | ||||||||||
Nasdaq Composite Index |
100.00 | 102.02 | 89.26 | 93.03 | 54.14 | 78.94 | 87.95 | 83.07 | 109.33 | |||||||||||||||||||
Nasdaq Computer & Data Processing Index |
100.00 | 102.64 | 88.45 | 94.56 | 55.86 | 87.30 | 98.55 | 93.75 | 127.85 | |||||||||||||||||||
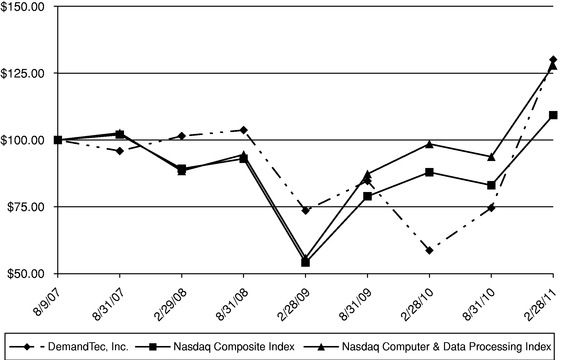
Unregistered Sales of Equity Securities
None.
43
Item 6. Selected Financial Data
The following selected consolidated financial data should be read in conjunction with our audited consolidated financial statements and related notes thereto and with Management's Discussion and Analysis of Financial Condition and Results of Operation, which are included elsewhere in this Annual Report on Form 10-K. The consolidated statements of operations data for fiscal 2011, 2010 and 2009, and the selected consolidated balance sheet data as of February 28, 2011 and 2010, are derived from, and are qualified by reference to, the audited consolidated financial statements that are included in this Annual Report on Form 10-K. The consolidated statements of operations data for fiscal 2008 and 2007 and the consolidated balance sheet data as of February 28, 2009, February 29, 2008, and February 28, 2007 are derived from audited consolidated financial statements which are not included in this Annual Report on Form 10-K. Our historical results are not necessarily indicative of results to be expected for any future period.
| |
Year Ended February 28, | |
|
||||||||||||||
|---|---|---|---|---|---|---|---|---|---|---|---|---|---|---|---|---|---|
| |
Year Ended February 29, 2008 |
Year Ended February 28, 2007(1) |
|||||||||||||||
| |
2011(1) | 2010 | 2009(1) | ||||||||||||||
| |
(In thousands, except per share data) |
||||||||||||||||
Consolidated Statements of Operations Data: |
|||||||||||||||||
Revenue |
$ | 82,418 | $ | 79,052 | $ | 75,005 | $ | 61,270 | $ | 43,485 | |||||||
Cost of revenue(2)(3) |
29,232 | 25,760 | 23,331 | 20,444 | 14,230 | ||||||||||||
Gross profit |
53,186 | 53,292 | 51,674 | 40,826 | 29,255 | ||||||||||||
Operating expenses: |
|||||||||||||||||
Research and development(3) |
32,299 | 32,279 | 26,787 | 22,445 | 15,340 | ||||||||||||
Sales and marketing(3) |
23,613 | 20,828 | 20,343 | 17,290 | 12,108 | ||||||||||||
General and administrative(3) |
9,706 | 9,657 | 9,888 | 6,292 | 2,673 | ||||||||||||
Restructuring charges |
— | 775 | — | — | — | ||||||||||||
Amortization of purchased intangible assets |
1,134 | 2,044 | 1,241 | 360 | 118 | ||||||||||||
Total operating expenses |
66,752 | 65,583 | 58,259 | 46,387 | 30,239 | ||||||||||||
Loss from operations |
(13,566 | ) | (12,291 | ) | (6,585 | ) | (5,561 | ) | (984 | ) | |||||||
Other income (expense), net |
168 | 306 | 1,585 | 1,542 | (480 | ) | |||||||||||
Loss before provision (benefit) for income taxes |
(13,398 | ) | (11,985 | ) | (5,000 | ) | (4,019 | ) | (1,464 | ) | |||||||
Provision (benefit) for income taxes |
265 | (148 | ) | (47 | ) | 455 | 52 | ||||||||||
Net loss |
(13,663 | ) | (11,837 | ) | (4,953 | ) | (4,474 | ) | (1,516 | ) | |||||||
Accretion to redemption value of preferred stock |
— | — | — | 13 | 32 | ||||||||||||
Net loss attributable to common stockholders |
$ | (13,663 | ) | $ | (11,837 | ) | $ | (4,953 | ) | $ | (4,487 | ) | $ | (1,548 | ) | ||
Net loss per common share, basic and diluted |
$ | (0.45 | ) | $ | (0.41 | ) | $ | (0.18 | ) | $ | (0.25 | ) | $ | (0.28 | ) | ||
Shares used in computing net loss per common share, basic and diluted |
30,529 | 28,720 | 27,372 | 17,612 | 5,531 | ||||||||||||
44
| |
February 28, | |
|
|||||||||||||
|---|---|---|---|---|---|---|---|---|---|---|---|---|---|---|---|---|
| |
February 29, 2008 |
February 28, 2007(1) |
||||||||||||||
| |
2011(1) | 2010 | 2009(1) | |||||||||||||
| |
(In thousands) |
|||||||||||||||
Consolidated Balance Sheet Data: |
||||||||||||||||
Cash, cash equivalents and marketable securities |
$ | 72,980 | $ | 67,284 | $ | 87,884 | $ | 75,889 | $ | 25,478 | ||||||
Working capital (deficit) |
26,117 | 22,177 | 21,788 | 44,739 | (66 | ) | ||||||||||
Total assets |
115,095 | 110,662 | 134,155 | 113,796 | 56,795 | |||||||||||
Deferred revenue |
41,425 | 38,921 | 48,815 | 55,375 | 42,172 | |||||||||||
Debt |
2 | 434 | 1,720 | 442 | 15,063 | |||||||||||
Merger consideration payable |
475 | 1,000 | 13,343 | — | — | |||||||||||
Redeemable convertible preferred stock |
— | — | — | — | 49,073 | |||||||||||
Stockholders' equity (deficit) |
58,803 | 56,938 | 56,649 | 50,297 | (58,660 | ) | ||||||||||
- (1)
- We
acquired AIS in December 2010, Connect3 in February 2009, and TradePoint in November 2006. See Overview in Item 7. Management's Discussion and Analysis of Financial Condition and Results of Operations and Note 2 of Notes to Consolidated Financial Statements.
- (2)
- Includes
amortization of purchased intangible assets of (in thousands) $1,903, $1,862, $610, $608, and $203 in fiscal 2011, 2010, 2009, 2008, and 2007,
respectively.
- (3)
- Includes stock-based compensation expense as follows:
| |
Year Ended February 28, | |
|
|||||||||||||
|---|---|---|---|---|---|---|---|---|---|---|---|---|---|---|---|---|
| |
Year Ended February 29, 2008 |
Year Ended February 28, 2007 |
||||||||||||||
| |
2011 | 2010 | 2009 | |||||||||||||
| |
(In thousands) |
|||||||||||||||
Cost of revenue |
$ | 1,776 | $ | 1,732 | $ | 1,712 | $ | 1,261 | $ | 41 | ||||||
Research and development |
3,422 | 3,309 | 2,261 | 1,824 | 62 | |||||||||||
Sales and marketing |
2,744 | 2,411 | 2,263 | 1,367 | 74 | |||||||||||
General and administrative |
2,424 | 2,267 | 1,743 | 883 | 156 | |||||||||||
45
Item 7. Management's Discussion and Analysis of Financial Condition and Results of Operations
Forward-Looking Statements
This Annual Report on Form 10-K contains "forward-looking statements" within the meaning of Section 21E of the Securities Exchange Act of 1934, as amended. In addition, we may make other written and oral communications from time to time that contain such statements. Forward-looking statements include statements as to industry trends and future expectations of ours and other matters that do not relate strictly to historical facts. These statements are often identified by the use of words such as "may," "will," "expect," "believe," "anticipate," "intend," "could," "estimate," or "continue," and similar expressions or variations. These statements are based on the beliefs and assumptions of our management based on information currently available to management. Such forward-looking statements are subject to risks, uncertainties and other factors that could cause actual results and the timing of certain events to differ materially from future results expressed or implied by such forward-looking statements. These forward-looking statements include statements in this Item 7, "Management's Discussion and Analysis of Financial Condition and Results of Operations." Factors that could cause or contribute to such differences include, but are not limited to, those identified below, and those discussed under the heading "Risk Factors" in Item 1A of this Annual Report on Form 10-K and in our other Securities and Exchange Commission filings. Furthermore, such forward-looking statements speak only as of the date of this report. We undertake no obligation to update any forward-looking statements to reflect events or circumstances after the date of such statements.
The following discussion and analysis of our financial condition and results of operations should be read in conjunction with the consolidated financial statements and related notes thereto appearing elsewhere in this Annual Report on Form 10-K. Our fiscal year ends on the last day of February; fiscal 2011, for example, refers to our fiscal year ended February 28, 2011.
Overview
We provide a collaborative optimization network of software services connecting retail and CP companies, enabling them to define category, brand, and shopper marketing strategies based on a scientific understanding of consumer behavior and make actionable pricing, promotion, assortment, space and other merchandising and marketing recommendations to achieve their revenue, profitability, sales volume, and customer loyalty objectives. We provide our applications by means of a software-as-a-service, or SaaS, model, which allows us to capture and analyze the most recent retailer and market-level data and enhance our software services rapidly to address our customers' ever-changing merchandising and marketing needs, and connect retailers and CP companies online to enable improved, more collaborative business processes between trading partners.
Our solutions consist of software services and complementary analytical services and analytical insights derived from the same platform that supports our software services. We offer our solutions individually or as a suite of integrated software services. Our solutions for the retail and CP industries include DemandTec Lifecycle Price Optimization™, DemandTec End-to-End Promotion Management™, DemandTec Assortment & Space™, DemandTec Shopper Insights™, DemandTec Targeted Marketing™, DemandTec Marketing Plan Optimization™, DemandTec Total Trade Optimization™, DemandTec Shopper Marketing Optimization™, and DemandTec Connect™. The DemandTec network connects our solutions for the retail and CP industries. We sell our solutions through our direct sales force and receive a number of customer prospect introductions through third parties, such as systems integrators, strategic consulting firms, and a data syndication company.
We were incorporated in November 1999 and began selling our software in fiscal 2001. Our revenue has grown from $43.5 million in fiscal 2007 to $82.4 million in fiscal 2011. Our operating expenses have also increased significantly during these same periods. We have incurred losses to date and had an accumulated deficit of approximately $102.9 million at February 28, 2011. We sell our software to retailers and CP companies under agreements with initial terms that generally are one to three years in length and provide
46
a variety of services associated with our customers' use of our software. Our software service agreements with retailers and CP companies are often large contracts. The annual contract value for each retail and CP company customer agreement is largely related to the size of the customer. Our Advanced Deal Management agreements with CP companies that leverage the DemandTec network are principally one year in length and much smaller in annual and aggregate contract value than our other CP company customer software services contracts and our retail contracts. Generally, the agreements we have signed in the first fiscal quarter of a fiscal year have had an aggregate annual contract value less than that of the agreements signed in the preceding fiscal fourth quarter. In addition, the aggregate contract value of agreements signed can fluctuate significantly on a quarterly basis within any given fiscal year. A significant percentage of our new and existing customer add-on agreements are entered into during the last month, weeks, or even days of each quarter. We generally recognize the revenue from each agreement ratably over the term of the agreement. Our ability to maintain or increase revenues depends on our attracting new customers, renewing agreements with our existing customers at comparable prices, and selling add-on software services to existing customers as well as successfully incorporating shopper segmentation and analytics into our offerings. In fiscal 2010 and 2011, some customers or potential customers have elected not to enter into new or renewal contracts, and some other customers have renewed at lower prices or for shorter terms. Further, our revenue will be directly affected by the continued acceptance of our software solutions in the marketplace, as well as the timing, size and term length of our customer agreements. If we are unable to successfully develop or acquire new software and enhance our existing applications, we may not be able to attract and retain customers or increase or maintain our revenue.
We are headquartered in San Mateo, California. We have sales and marketing offices in North America and Europe, and conduct research and development operations in India, Russia, and China. In fiscal 2011, approximately 87% of our revenue was attributable to sales of our software to companies located in the United States. Our ability to achieve profitability will be affected by our revenue as well as by the level of our operating expenses associated with growing our business. Our largest category of operating expenses is research and development expenses, and the largest component of our operating expenses is personnel costs.
In March 2011, we acquired M-Factor, Inc. ("M-Factor"), a provider of predictive analytics software for CP companies that optimizes marketing mix and trade investment spending. The aggregate purchase price was approximately $9.5 million in cash. In December 2010, we acquired substantially all of the assets of Applied Intelligence Solutions, LLC ("AIS"), a provider of intelligent software solutions for retail enterprises, for approximately $3.2 million in cash.
In June 2010, we signed a multi-year agreement with Target Corporation for substantially all of our existing and certain potential future software services. This agreement includes obligations for us to engage in certain development efforts on a commercially reasonable basis. This agreement resulted in this customer representing approximately 21% of our revenue during fiscal 2011. In addition, the agreement can be canceled by the customer without cause after three years and restricts our ability to sell certain future software services and functionality to certain retail companies for a specific period of time.
As of April 15, 2011, we had approximately 32.3 million shares of common stock outstanding, excluding approximately 9.6 million shares subject to outstanding options, performance stock units, restricted stock units, and rights under our employee stock purchase program. The issuance of shares upon the exercise of these options and settlement of these units, as well as the grant of additional options and units pursuant to our equity compensation plans, would result in additional dilution and may adversely impact our earnings per share. See Note 7 of Notes to Condensed Consolidated Financial Statements.
Sources of Revenue
We derive all of our revenue from customer agreements that cover the use of our software and various services associated with our customers' use of our software. We generally recognize all revenue ratably
47
over the term of the agreement. Our agreements have generally been non-cancellable, but customers typically have the right to terminate their agreement for cause if we materially breach our obligations under the agreement and, in certain situations, may have the ability to extend the duration of their agreement on pre-negotiated terms. We invoice our customers in accordance with contractual terms, which generally have provided that our customers be invoiced in advance for annual use of our software services. We have provided certain implementation services on a fixed fee basis and have generally invoiced our customers in advance. In addition, we also have provided implementation and training services on a time and materials basis and have invoiced our customers monthly in arrears. Our payment terms typically require our customers to pay us within 30 days of the invoice date.
Cost of Revenue and Operating Expenses
Cost of Revenue
Cost of revenue includes expenses related to data centers, depreciation expenses associated with computer equipment and software, compensation and related expenses of operations, technical customer support, production operations and professional services personnel, amortization of purchased intangible assets, and allocated overhead expenses. We have contracts with three third parties for the use of their data center facilities, and our data center costs principally consist of the amounts we pay to these third parties for rack space, power and similar items. We amortize purchased intangible assets, principally for developed technology acquired in prior acquisitions. We allocate overhead costs, such as rent and occupancy costs, employee benefits, information management costs, and legal and other costs, to all departments predominantly based on headcount. As a result, we include allocated overhead expenses in cost of revenue and each operating expense category.
Research and Development
Research and development expenses include personnel costs for our research, product management and software development personnel, and allocated overhead expenses. We devote substantial resources to extending our existing software applications as well as to developing new software.
Sales and Marketing
Sales and marketing expenses include personnel costs for our sales and marketing personnel, including commissions and incentives, travel and entertainment expenses, marketing programs such as product marketing, events, corporate communications and other brand building expenses, and allocated overhead expenses.
General and Administrative
General and administrative expenses include personnel costs for our executive, finance and accounting, human resources, legal and information management personnel, third-party professional services, travel and entertainment expenses, other corporate expenses and overhead not allocated to cost of revenue, research and development expenses, or sales and marketing expenses. Third-party professional services primarily include outside legal, audit and tax-related consulting costs.
Amortization of Purchased Intangible Assets
In December 2010, we acquired substantially all of the assets of AIS. The aggregate purchase price was approximately $3.2 million in cash. We are amortizing purchased intangible assets, primarily related to developed technology and customer relationships, over two to four years on a straight-line basis, which resulted in approximately $55,000 of amortization expense in fiscal 2011. Annual amortization expense related to this acquisition, absent any impairment, is expected to be approximately $270,000 and $256,000 in fiscal 2012 and 2013, respectively, and will decline thereafter.
48
In February 2009, we acquired Connect3. The aggregate purchase price was approximately $13.5 million, which consisted of approximately $13.3 million in cash and $201,000 of acquisition costs. We have been amortizing purchased intangible assets related to developed technology, customer relationships, non-compete covenants and backlog over one to two and a half years on a straight-line basis, which resulted in approximately $1.8 million and $2.2 million of expense in fiscal 2011 and 2010, respectively. The remaining balance of approximately $626,000 is expected to be fully amortized in fiscal 2012.
In May 2008, we purchased rights to develop assortment optimization technology for $1.5 million, which was amortized over 18 months on a straight-line basis and was fully amortized at February 28, 2010. This resulted in approximately $766,000 and $734,000 of amortization expense in fiscal 2010 and 2009, respectively, which was included in our operating expenses.
In November 2006, we acquired TradePoint. The aggregate purchase price was approximately $9.8 million, which consisted of approximately $3.7 million in cash, approximately $4.1 million in our common stock, a $1.8 million promissory note and $219,000 of acquisition costs. In this acquisition, we purchased intangible assets related to developed technology, customer relationships, a trade name, and non-compete covenants. We have been amortizing purchased intangible assets over three to seven years on a straight-line basis. This resulted in approximately $1.1 million, $911,000 and $967,000 of amortization expense in fiscal 2011, 2010, and 2009, respectively. Annual amortization expenses related to this acquisition, absent any impairment, will be approximately $541,000 in fiscal 2012 and decline significantly thereafter.
In March 2011, subsequent to the end of fiscal 2011, we acquired all privately-held M-Factor for $9.5 million in cash. We expect a significant portion of the purchase consideration be allocated to purchased intangible assets, which will result in a material increase in our annual amortization expenses.
Other Income (Expense), Net
Other income (expense), net includes interest income on our cash and marketable securities balances, interest expense related to debt, and losses or gains on conversions of non-U.S. dollar transactions into U.S. dollars. In the past three fiscal years, we have invested a majority of our cash in money market funds, treasury bills, corporate bonds, obligations of government-sponsored enterprises, and commercial paper. Other income (expense), net will depend on a number of factors, including our ability to generate cash from operations, interest rates on our investments, foreign exchange rates, and whether or not we incur debt.
Critical Accounting Policies and Estimates
We prepare our consolidated financial statements in accordance with accounting principles generally accepted in the United States, or GAAP. These accounting principles often require us to make certain estimates and judgments that can affect the reported amounts of assets and liabilities as of the date of our consolidated financial statements, as well as the reported amounts of revenue and expenses during the periods presented. In some cases, the accounting treatment of a particular transaction is specifically dictated by GAAP and does not require management's judgment in its application or our judgment in selecting among available accounting policy alternatives, as they would not produce a materially different result. In other cases, our judgment in selecting among available alternatives can have a material impact on our accounting results. We believe that our estimates and judgments were reasonable based upon information available to us at the time that these estimates and judgments were made. We evaluate our estimates and judgments on an ongoing basis. Our actual results may differ from these estimates under different assumptions or conditions.
We believe that of our significant accounting policies, which are described in Note 1 to our Consolidated Financial Statements included in Item 8, Financial Statements and Supplementary Data of this Annual Report on Form 10-K, the following accounting polices involve the greatest degree of judgment
49
and complexity and have the potential for the greatest impact on our consolidated financial statements. Accordingly, we believe these policies are the most critical in fully understanding and evaluating our reported financial results.
Revenue Recognition
We generate revenue from fees under agreements with initial terms that generally are one to three years in length. Our agreements contain multiple elements, which include the use of our software, SaaS delivery services, professional services, maintenance, and customer support. Professional services consist of implementation, training, data modeling, and analytical services related to our customers' use of our software. We have determined that the elements within our agreements do not qualify for treatment as separate units of accounting. Therefore, we account for all fees received under our agreements as a single unit of accounting and recognize them ratably over the term of the related agreement, commencing upon the later of the agreement start date or the date access to the application is provided to the customers, and when all of the following conditions are also met:
- •
- there is persuasive evidence of an arrangement;
- •
- the service has been provided to the customer;
- •
- the collection of the fees is probable; and
- •
- the amount of fees to be paid by the customer is fixed or determinable.
Deferred Commissions
We capitalize certain commission costs directly related to the acquisition of a customer agreement in accordance with applicable accounting standards. Commissions are paid shortly after our receipt of the related customer payment. Commissions are deferred and amortized to sales and marketing expense over the revenue recognition term of the related non-cancelable customer agreement. The deferred commission amounts are recoverable through their accompanying future revenue streams under non-cancellable customer agreements. We believe this is the appropriate method of accounting as the commission charges are so closely related to the revenue from the customer contracts that they should be recorded as an asset and charged to expense over the same period that the related revenue is recognized. Commission expense was approximately $1.9 million, $2.3 million, and $3.4 million in fiscal 2011, 2010, and 2009, respectively. Deferred commissions on our consolidated balance sheets totaled approximately $1.9 million and $843,000 at February 28, 2011 and 2010, respectively.
Stock-Based Compensation
We account for and recognize all share-based payments as an expense in our statements of operations. Grants of stock options to employees and to new members of our board of directors generally vest over four years and annual stock option grants to existing members of our board of directors vest over one year. We measure the value of stock options based on the grant date fair value using the Black-Scholes pricing model. Performance-based stock units, or PSUs, vest pursuant to certain performance and time-based vesting criteria set by our Compensation Committee. We evaluate the probability of meeting the performance criteria at the end of each reporting period to determine how much compensation expense to record. Because the actual number of shares to be issued is not known until the end of the performance period, the actual compensation expense related to these awards could differ from our current expectations. We also have time-based restricted stock units, or RSUs, outstanding that entitle the recipient to receive shares of our common stock upon vesting and settlement of the awards pursuant to time-based vesting criteria set by our Compensation Committee. Stock-based compensation expense for PSUs and RSUs is based on the closing price of our common stock on the grant date. We amortize the fair
50
value of those awards, net of estimated forfeitures, as stock-based compensation expense over the vesting period of the awards.
Fair Value of Financial Instruments
The carrying amounts of our financial instruments, which include cash and cash equivalents, marketable securities, accounts receivable, and notes payable approximate their fair values. Our financial assets and liabilities are remeasured and reported at fair value at each reporting period. We measure our foreign currency forward contracts at fair value. Our foreign currency forward contracts are classified within Level 2 as the valuation inputs are based on quoted prices of similar instruments in active markets and do not involve management judgment.
Income Taxes
Deferred tax assets and liabilities are determined based on the temporary differences between their financial reporting and tax bases and are measured using the enacted tax rates that are anticipated to be in effect when the differences are expected to reverse. Valuation allowances are established when necessary to reduce deferred tax assets to the amounts more likely than not expected to be realized. We have established a valuation allowance against substantially all of our deferred tax assets as we believe it is more likely than not that the deferred tax assets will not be realized.
We will continue to evaluate the ongoing need for and amount of the valuation allowance. We may determine that some, or all, of our deferred tax assets will be realized, in which case we will reduce our valuation allowance in the quarter in which such determination is made. If the valuation allowance is reduced, we may recognize a benefit from income taxes on our income statement in that period. In subsequent periods, we may have higher income tax expenses.
Goodwill and Intangible Assets
We record as goodwill the excess of the acquisition purchase price over the fair value of the tangible and identifiable intangible assets acquired. We do not amortize goodwill, but perform an annual impairment review of our goodwill during our third quarter, or more frequently if indicators of potential impairment arise. We have a single operating segment and consequently evaluate goodwill for impairment based on an evaluation of the fair value of our company as a whole. We record purchased intangible assets at their respective estimated fair values at the date of acquisition. Purchased intangible assets are being amortized using the straight-line method over their remaining estimated useful lives, which range from approximately one to seven years. We evaluate the remaining useful lives of intangible assets on a periodic basis to determine whether events or circumstances warrant a revision to the remaining estimated amortization period. We evaluated our goodwill in November 2010 and recognized no impairment charges as a result of the review. Additionally, we observed no impairment indicators for both goodwill and intangible assets through the filing of this Annual Report on Form 10-K.
Impairment of Long-Lived Assets
Long-lived assets are reviewed for possible impairment whenever events or circumstances indicate that the carrying amount of these assets may not be recoverable. We evaluate the recoverability of each of our long-lived assets, including purchased intangible assets and property, equipment, and leasehold improvements, by comparison of its respective carrying amount to the future undiscounted cash flows we expect the asset to generate. If we consider the asset to be impaired, we measure the amount of any impairment as the difference between the carrying amount and the fair value of the impaired asset. We observed no impairment indicators through the filing of this Annual Report on Form 10-K.
51
Results of Operations
The following table sets forth selected consolidated statements of operations data as a percentage of revenue for each of the periods indicated:
| |
Year Ended February 28, | ||||||||||
|---|---|---|---|---|---|---|---|---|---|---|---|
| |
2011 | 2010 | 2009 | ||||||||
Revenue |
100 | % | 100 | % | 100 | % | |||||
Cost of revenue |
35 | 33 | 31 | ||||||||
Gross margin |
65 | 67 | 69 | ||||||||
Operating expenses: |
|||||||||||
Research and development |
39 | 41 | 36 | ||||||||
Sales and marketing |
29 | 26 | 27 | ||||||||
General and administrative |
12 | 12 | 13 | ||||||||
Restructuring charges |
— | 1 | — | ||||||||
Amortization of purchased intangible assets |
1 | 3 | 2 | ||||||||
Total operating expenses |
81 | 83 | 78 | ||||||||
Loss from operations |
(16 | ) | (16 | ) | (9 | ) | |||||
Other income (expense), net |
— | 1 | 2 | ||||||||
Loss before provision (benefit) for income taxes |
(16 | ) | (15 | ) | (7 | ) | |||||
Provision (benefit) for income taxes |
— | — | — | ||||||||
Net loss attributable to common stockholders |
(16 | )% | (15 | )% | (7 | )% | |||||
Revenue
| |
Year Ended February 28, | |||||||||
|---|---|---|---|---|---|---|---|---|---|---|
| |
2011 | 2010 | 2009 | |||||||
| |
(In thousands) |
|||||||||
Revenue |
$ | 82,418 | $ | 79,052 | $ | 75,005 | ||||
Fiscal 2011 Compared to Fiscal 2010. Fiscal 2011 revenue increased approximately $3.4 million, or 4%, from fiscal 2010 revenue, due to revenue of approximately $1.2 million from new customers and an increase of approximately $2.2 million from existing customers. New customers are those that did not contribute any revenue in the prior fiscal year. Existing customers are those that contributed revenue in both the current and prior fiscal years. Revenue from existing customers was approximately 99% and 97% of our total revenue in fiscal 2011 and 2010, respectively. Revenue from new customers in any given period can fluctuate depending upon the period in which the contract is signed, the number of new customer contracts and the size of the new retailer or CP customer.
During fiscal 2009 and 2010, the adverse global economic conditions resulted in delays in the execution of new and some renewal customer contracts, with some customers or potential customers electing not to enter into new or renewal contracts, and some other customers renewing at lower prices or for shorter terms. Accordingly, our revenue growth slowed in fiscal 2010 and revenue even declined in each of the quarters ended February 28, 2010 and May 31, 2010, respectively, compared to the immediately prior quarter. With the existing uncertainties in the global economic environment, we believe that long-term revenue growth is difficult to predict.
Fiscal 2010 Compared to Fiscal 2009. Fiscal 2010 revenue increased approximately $4.0 million, or 5%, from fiscal 2009 revenue, due to revenue of approximately $2.2 million from new customers and an increase of approximately $1.8 million from existing customers. Revenue from existing customers was
52
approximately 97% of our total revenue in each of fiscal 2010 and 2009. Fiscal 2010 revenue included approximately $1.2 million of revenue recognized as a result of terminated agreements associated with customer bankruptcies. Had these customer agreements not terminated, approximately $690,000 of revenue under these agreements would have been recognized throughout fiscal 2011 over their remaining terms rather than being recognized in our fourth quarter of fiscal 2010.
For fiscal 2011, 2010 and 2009, percentage of total revenue by customer type and geographic region was as follows:
| |
Year Ended February 28, | |||||||||||
|---|---|---|---|---|---|---|---|---|---|---|---|---|
| |
2011 | 2010 | 2009 | |||||||||
By customer type: |
||||||||||||
Retail |
81 | % | 82 | % | 86 | % | ||||||
CP |
19 | % | 18 | % | 14 | % | ||||||
Total revenue |
100 | % | 100 | % | 100 | % | ||||||
By location: |
||||||||||||
United States |
87 | % | 86 | % | 86 | % | ||||||
International |
13 | % | 14 | % | 14 | % | ||||||
Total revenue |
100 | % | 100 | % | 100 | % | ||||||
Revenue from CP companies, as a percentage of revenue, continued to increase year-over-year. Revenue from customers located outside the United States as a percentage of revenue remained flat in fiscal 2010 compared to fiscal 2009, but decreased one percentage point in fiscal 2011 from fiscal 2010. Over the long term, we expect that revenue from CP companies and revenue from international customers will increase as a percentage of total revenue on an annual basis.
In fiscal 2011, we had two customers that accounted for approximately 21% and 11%, respectively, of our total revenue. In each of fiscal 2010 and 2009, we had one customer that accounted for approximately 14% of our total revenue. No other customer accounted for more than 10% of our revenue in fiscal 2011, 2010 and 2009. In fiscal 2012, we expect revenue from our largest customer to represent about the same proportion of revenue as in fiscal 2011.
Cost of Revenue
| |
Year Ended February 28, | |||||||||
|---|---|---|---|---|---|---|---|---|---|---|
| |
2011 | 2010 | 2009 | |||||||
| |
(Dollars in thousands) |
|||||||||
Revenue |
$ | 82,418 | $ | 79,052 | $ | 75,005 | ||||
Cost of revenue |
29,232 | 25,760 | 23,331 | |||||||
Gross profit |
$ | 53,186 | $ | 53,292 | $ | 51,674 | ||||
Gross margin |
65 | % | 67 | % | 69 | % | ||||
Fiscal 2011 Compared to Fiscal 2010. Fiscal 2011 cost of revenue increased approximately $3.5 million, or 13%, from fiscal 2010, primarily due to the expansion of the hosting and equipment infrastructure required to support our strategy of incorporating and embedding shopper segmentation and analytics into our software services, and implementation support at certain of our customers.
Data center and equipment costs, including depreciation expense, increased approximately $1.6 million compared to fiscal 2010. Our new data center in Mesa, Arizona provides the infrastructure required to handle the anticipated increase in the level of customer data processed and analyzed to embed shopper segments and insights in our service offerings. Allocated expenses increased $668,000 as a result of
53
increased corporate shared services, including office rent expense, as well as the cost of office moves, increased information technology infrastructure, and human resources support. Travel-related expenses and contractor expenses increased approximately $550,000 and $229,000, respectively, compared to the prior year, primarily as a result of supporting customer implementations and supplementing our consulting workforce in implementations at certain of our customers. Payroll-related expense increased $361,000 as average headcount increased by three employees compared to the prior year.
Our gross margin decreased to 65% in fiscal 2011 from 67% in fiscal 2010, as fiscal 2011 was adversely impacted by an increase in our infrastructure costs to support our service offerings. We expect that our gross margin will remain flat or decrease slightly in the short term, as a result of additional personnel and other costs associated with our recent acquisition of M-Factor.
Fiscal 2010 Compared to Fiscal 2009. Fiscal 2010 cost of revenue increased approximately $2.4 million, or 10%, from fiscal 2009, primarily due to increased amortization of purchased intangible assets and personnel costs.
Amortization of purchased intangible assets increased approximately $1.3 million in fiscal 2010 compared to fiscal 2009, primarily as a result of our acquisition of Connect3 in February 2009. Personnel costs, which include all compensation, employee benefits, and stock-based compensation expenses, increased approximately $968,000 in fiscal 2010 compared to fiscal 2009, mainly due to an increase in headcount during fiscal 2010. Average headcount during fiscal 2010 increased by 10 compared to average headcount during fiscal 2009, primarily as a result of the acquisition of Connect3.
Our gross margin decreased to 67% in fiscal 2010 compared to 69% in fiscal 2009, primarily associated with our acquisition of Connect3, as our personnel costs and the amortization of purchased intangible assets increased at a faster rate than our revenue.
Research and Development Expenses
| |
Year Ended February 28, | |||||||||
|---|---|---|---|---|---|---|---|---|---|---|
| |
2011 | 2010 | 2009 | |||||||
| |
(Dollars in thousands) |
|||||||||
Research and development |
$ | 32,299 | $ | 32,279 | $ | 26,787 | ||||
Percent of revenue |
39 | % | 41 | % | 36 | % | ||||
Fiscal 2011 Compared to Fiscal 2010. Fiscal 2011 research and development expense increased slightly from fiscal 2010, primarily due to an increase in the use of contractors and consultants and allocated facility-related costs, partially offset by a decrease in personnel costs.
Consulting and contractor costs increased approximately $1.0 million in fiscal 2011 compared to fiscal 2010, primarily to support certain development initiatives to embed shopper segmentation and analytics into our software services. Allocated facility-related costs increased approximately $346,000, mainly attributable to the use of a new hosting facility in Mesa, Arizona, and the increased costs of our San Mateo headquarters facility. In addition, software term license fees increased approximately $137,000 in fiscal 2011 compared to fiscal 2010. The increases were offset by a $1.5 million decrease in personnel costs in fiscal 2011 from fiscal 2010, primarily because average headcount decreased by seven and because we migrated certain development resources to lower-cost jurisdictions.
We intend to continue to invest significantly in our research and development efforts because we believe these efforts are essential to maintaining our competitive position. We expect that, in the short term, research and development expenses will increase in absolute dollars and as a percentage of revenue as we continue to grow our business, in particular given the increased headcount and contractor costs from our recent acquisitions of AIS in December 2010 and M-Factor in March 2011.
54
Fiscal 2010 Compared to Fiscal 2009. Fiscal 2010 research and development expenses increased approximately $5.5 million, or 21%, from fiscal 2009, primarily due to increased personnel costs and allocated overhead costs associated with increased headcount.
Personnel costs increased approximately $4.5 million in fiscal 2010 compared to fiscal 2009, mainly due to an increase in headcount as a result of the acquisition of Connect3, and increased stock-based compensation. The average research and development headcount increased by 27 in fiscal 2010 from fiscal 2009. Research and development related stock-based compensation expense, which is a component of personnel costs, was approximately $3.3 million and $2.3 million in fiscal 2010 and 2009, respectively. The increase in stock-based compensation was primarily associated with stock options and PSUs granted to new and existing employees subsequent to February 28, 2009, partially offset by lower expenses associated with fully vested PSUs that were granted in fiscal 2008. Allocated overhead costs increased approximately $932,000 in fiscal 2010 from fiscal 2009, primarily due to increased allocated facility and information technology expenses as a result of our new corporate headquarters.
Sales and Marketing Expenses
| |
Year Ended February 28, | |||||||||
|---|---|---|---|---|---|---|---|---|---|---|
| |
2011 | 2010 | 2009 | |||||||
| |
(Dollars in thousands) |
|||||||||
Sales and marketing |
$ | 23,613 | $ | 20,828 | $ | 20,343 | ||||
Percent of revenue |
29 | % | 26 | % | 27 | % | ||||
Fiscal 2011 Compared to Fiscal 2010. Fiscal 2011 sales and marketing expenses increased by approximately $2.8 million, or 13%, from fiscal 2010, primarily as a result of increased personnel costs and a provision for doubtful accounts, partially offset by decreased marketing program and outside service costs.
Personnel costs increased approximately $2.9 million from fiscal 2010, primarily because average sales and marketing headcount increased by 11 compared to fiscal 2010. Also contributing to the personnel costs increase was an increase of $333,000 in stock-based compensation expense. Bad debt expense increased $460,000 from fiscal 2010 as we were not able to collect on a customer invoice that was in dispute. The increases were partially offset by a decrease of approximately $685,000 in marketing programs, event costs, and outside service expenses compared to fiscal 2010, as we undertook fewer marketing and branding initiatives.
We expect that, in the short term, sales and marketing expenses will increase in absolute dollars as a result of our acquisition of M-Factor in March 2011.
Fiscal 2010 Compared to Fiscal 2009. Fiscal 2010 sales and marketing expenses increased by approximately $485,000, or 2%, from fiscal 2009, primarily as a result of increased consulting and marketing program costs, partially offset by a decrease in commission expenses.
Consulting and marketing program costs increased approximately $1.0 million in fiscal 2010 from fiscal 2009, primarily due to new service introductions, increased online marketing activities, branding, and our strategy initiatives. The increase in consulting and marketing program costs was partially offset by a decrease of $442,000 in personnel costs in fiscal 2010 compared to fiscal 2009, mainly due to decreased commission expenses.
55
General and Administrative Expenses
| |
Year Ended February 28, | |||||||||
|---|---|---|---|---|---|---|---|---|---|---|
| |
2011 | 2010 | 2009 | |||||||
| |
(Dollars in thousands) |
|||||||||
General and administrative |
$ | 9,706 | $ | 9,657 | $ | 9,888 | ||||
Percent of revenue |
12 | % | 12 | % | 13 | % | ||||
Fiscal 2011 Compared to Fiscal 2010. Fiscal 2011 general and administrative expenses increased slightly from fiscal 2010, as an increase in contractor and consulting expenses was largely offset by a decrease in sales tax expense.
Consulting and contractor expenses increased $185,000 as a result of certain accounting system enhancement projects to support the collaborative optimization network and incremental contractor services to support the business growth. Legal costs increased approximately $235,000 associated with the acquisitions in fiscal 2011. Partially offsetting the legal costs and consulting and contractor expense increase, sales tax expense decreased $375,000 compared to fiscal 2010 as we established reserves associated with certain states in fiscal 2010, while in fiscal 2011 we resolved a sales tax matter associated with one of the states and were therefore able to release a portion of our sales tax reserves. We expect that, in the short term, general and administrative expenses will increase in absolute dollars as we continue to grow our business.
Fiscal 2010 Compared to Fiscal 2009. Fiscal 2010 general and administrative expenses decreased approximately $231,000, or 2%, from fiscal 2009. Third party professional services expenses decreased approximately $1.3 million in fiscal 2010 from fiscal 2009, primarily due to lower Sarbanes-Oxley compliance and audit related costs. The decrease in third party professional services expense was partially offset by increased personnel costs of approximately $911,000 in fiscal 2010 from fiscal 2009, primarily due to an increase in stock-based compensation expense. General and administrative related stock-based compensation expense, which is a component of personnel costs, was $2.3 million and $1.7 million in fiscal 2010 and 2009, respectively. The increase in stock-based compensation expense was primarily associated with stock options and PSUs granted to new and existing employees subsequent to February 28, 2009, partially offset by lower expenses associated with fully vested PSUs that were granted in fiscal 2008.
Amortization of Purchased Intangible Assets
| |
Year Ended February 28, | |||||||||
|---|---|---|---|---|---|---|---|---|---|---|
| |
2011 | 2010 | 2009 | |||||||
| |
(Dollars in thousands) |
|||||||||
Amortization of purchased intangible assets |
$ | 1,134 | $ | 2,044 | $ | 1,241 | ||||
Percent of revenue |
1 | % | 3 | % | 2 | % | ||||
Fiscal 2011 Compared to Fiscal 2010. Expenses associated with amortization of purchased intangible assets decreased $910,000 compared to fiscal 2010. The decrease was primarily due to the scheduled full amortization of intangible assets by November 2009 associated with the purchase of rights to develop assortment optimization technology and certain intangible assets from the TradePoint and Connect3 acquisitions. Intangible assets are being amortized using the straight-line method over their estimated useful lives, with an estimated remaining weighted average period of 2.0 years at February 28, 2011. Amortization expense of purchased intangible assets will increase in absolute dollars due to our recent acquisitions of AIS and M-Factor. Excluding intangibles purchased from M-Factor, estimated amortization expense, absent of any impairment, will be approximately $1.7 million and $585,000 in fiscal 2012 and 2013, respectively, with declining amounts thereafter.
56
Fiscal 2010 Compared to Fiscal 2009. Fiscal 2010 amortization of purchased intangible assets increased approximately $803,000 from fiscal 2009. The increase was primarily due to our acquisition of Connect3 in February 2009. Intangible assets associated with the Connect3 acquisition were being amortized over one to two and a half years starting from March 2009, and resulted in amortization expense of approximately $977,000 in operating expenses in fiscal 2010.
Other Income (Expense), Net
| |
Year Ended February 28, | |||||||||
|---|---|---|---|---|---|---|---|---|---|---|
| |
2011 | 2010 | 2009 | |||||||
| |
(In thousands) |
|||||||||
Interest income |
$ | 249 | $ | 577 | $ | 1,772 | ||||
Interest expense |
(94 | ) | (87 | ) | (84 | ) | ||||
Other income (expense) |
13 | (184 | ) | (103 | ) | |||||
Other income (expense), net |
$ | 168 | $ | 306 | $ | 1,585 | ||||
Fiscal 2011 Compared to Fiscal 2010. Fiscal 2011 other income (expense), net decreased $138,000 from fiscal 2010, primarily due to decreased interest income as a result of lower interest rates on invested cash balances and marketable securities. Partially offsetting the decrease, we incurred some foreign exchange rate losses in the prior year associated with accounts receivable balances denominated in Euros, while we had no similar losses in fiscal 2011.
Fiscal 2010 Compared to Fiscal 2009. Fiscal 2010 other income (expense), net decreased approximately $1.3 million compared to fiscal 2009, primarily due to decreased interest income as a result of lower interest rates on invested cash balances and marketable securities.
Provision (Benefit) for Income Taxes
| |
Year Ended February 28, | |||||||||
|---|---|---|---|---|---|---|---|---|---|---|
| |
2011 | 2010 | 2009 | |||||||
| |
(In thousands) |
|||||||||
Provision (benefit) for income taxes |
$ | 265 | $ | (148 | ) | $ | (47 | ) | ||
Since inception, we have incurred annual operating losses and, accordingly, have recorded a provision for income taxes primarily for federal minimum income taxes, state income taxes, and foreign taxes associated with our foreign customers and operations. At February 28, 2011, we had federal and state net operating loss carryforwards of approximately $87.8 million and $63.6 million, respectively, to offset future taxable income, subject to limitations imposed by the Internal Revenue Code or similar state provisions.
In fiscal 2011, we recorded a net income tax expense of $265,000 compared to a net income tax benefit of $148,000 in fiscal 2010. The effective tax rate for fiscal 2011 was approximately 2%. We recorded tax expenses primarily for state minimum taxes, foreign taxes, and adjustments to provisional 2010 federal income tax expense.
In fiscal 2010, we recorded a net income tax benefit of $148,000 compared to $47,000 in fiscal 2009. The effective tax rate for each of fiscal 2010 and 2009 was approximately 1%, excluding certain discrete tax adjustments and benefits associated with federal legislation passed in those periods. In fiscal 2010, we recorded a discrete tax benefit of approximately $135,000 for the expected recovery of federal alternative minimum taxes paid in prior years, as a result of the enactment of the Worker, Homeownership, and Business Assistance Act in November 2009, which increases the carryback period for NOLs incurred in fiscal 2009 and 2010 from two to five years and suspends the alternative minimum tax NOL deduction limitation for the carryback period. Additionally, as in fiscal 2009, we recorded a federal income tax benefit of $83,000 in fiscal 2010, which was related to the provisions of the Housing Assistance Act of 2008 and the
57
American Recovery and Reinvestment Act of 2009 whereby corporations otherwise eligible for first-year bonus depreciation may instead elect to claim a refund for research and development tax credits generated prior to 2006. Excluding the tax impact of these acts, we would have recorded income tax expense primarily for state minimum taxes and for our foreign operations.
Stock-Based Compensation Expense
| |
Year Ended February 28, | |||||||||
|---|---|---|---|---|---|---|---|---|---|---|
| |
2011 | 2010 | 2009 | |||||||
| |
(In thousands) |
|||||||||
Stock-based compensation expense |
$ | 10,366 | $ | 9,719 | $ | 7,979 | ||||
Stock-based compensation expense increased approximately $647,000 and $1.7 million, respectively, in fiscal 2011 and 2010 compared to the prior year. The increases in both periods were due primarily to stock options and PSUs and RSUs granted to new and existing employees in fiscal 2011 and 2010, partially offset by lower expenses associated with PSUs and RSUs that were granted in fiscal 2008 becoming vested in fiscal 2011 and 2010. In particular, in fiscal 2011, we substituted cash bonuses for certain of our executives with PSUs, resulting in approximately $1.2 million in additional stock-based compensation expense in fiscal 2011 compared to fiscal 2010. The increase was partially offset by a decrease in stock-based compensation associated with PSUs granted in fiscal 2008 that were fully vested in fiscal 2010. See Note 7 of Notes to Consolidated Financial Statements for the amount of gross unrecognized stock-based compensation expense at February 28, 2011, and further explanation of how we derive and account for these estimates. We expect that stock-based compensation expense will vary over the long term depending on the timing and magnitude of equity incentive grants and revisions to our estimates of the number of shares expected to vest.
Liquidity and Capital Resources
At February 28, 2011, our principal sources of liquidity consisted of cash, cash equivalents, and marketable securities of $73.0 million, accounts receivable (net of allowance) of $9.4 million, and available borrowing capacity under our credit facility of $19.1 million, after reduction of approximately $917,000 to secure an operating lease commitment.
Our $20.0 million revolving credit facility may be borrowed, repaid, and reborrowed until May 7, 2012 and includes a number of covenants and restrictions with which we must comply. For example, our ability to incur debt, grant liens, make investments, enter into mergers and acquisitions, pay dividends, repurchase our outstanding common stock, change our business, enter into transactions with affiliates, and dispose of assets is limited. To secure the line of credit, we have granted our lenders a first priority security interest in substantially all of our assets. Through the filing of this Annual Report on Form 10-K, we were in compliance with all loan covenants.
| |
Year Ended February 28, | |||||||||
|---|---|---|---|---|---|---|---|---|---|---|
| |
2011 | 2010 | 2009 | |||||||
| |
(In thousands) |
|||||||||
Net cash provided by (used in) operating activities |
$ | 9,236 | $ | (6,779 | ) | $ | 13,813 | |||
Net cash used in investing activities |
(9,582 | ) | (6,694 | ) | (25,840 | ) | ||||
Net cash provided by financing activities |
5,542 | 1,267 | 2,595 | |||||||
Operating Activities
Our cash flows from operating activities in any period have been significantly influenced by the number of customers using our software, the number and size of new customer contracts, the timing and size of renewals of existing customer contracts, and the timing of payments by these customers. Our largest
58
source of operating cash flows is cash collections from our customers, which results in decreases to accounts receivable. Our primary uses of cash in operating activities are for personnel-related expenditures. Our cash flows from operating activities in any period will continue to be significantly affected by the extent to which we add new customers, renew or sell add-on functionality to existing customers, collect payments from our customers and increase personnel to grow our business.
Fiscal 2011 Compared to Fiscal 2010. In fiscal 2011, net cash provided by operating activities was approximately $9.2 million compared to $6.8 million of cash used in operating activities in fiscal 2010. The $16.0 million of net increase in cash inflow in fiscal 2011 compared to the prior year was primarily attributable to the growth in our business and cash collection efforts in fiscal 2011. Growth in our customer base and improved collection efforts resulted in an increase in our deferred revenue and a decrease in our accounts receivables, with a net $19.5 million increase in cash flow in fiscal 2011 compared to fiscal 2010. Our adjusted days sales outstanding was 40 days in fiscal 2011 compared to 74 days in fiscal 2010. The increase in cash collection from customers was partially offset by approximately $1.9 million net cash outflows from operating activities associated with other working capital items compared to fiscal 2010 due to the timing of vendor payments, and approximately $1.6 million lower net profit after taking into consideration non-cash expenses primarily associated with stock-based compensation, depreciation and amortization of intangible assets included in our net loss. The decrease in net profit was primarily due to increased headcount and the expansion of the hosting and equipment infrastructure.
Fiscal 2010 Compared to Fiscal 2009. In fiscal 2010, we used approximately $6.8 million of net cash in operating activities compared to $13.8 million cash generated from operating activities in fiscal 2009. The increase in net cash outflow in fiscal 2010 was primarily attributable to lower deferred revenue balances as a result of delays in the execution of new, add-on and some renewal customer contracts, with some customers electing not to renew contracts, and some other customers renewing at lower rates. We believe the adverse global economic conditions contributed to these delays. These factors also resulted in higher accounts receivable balances as average days sales outstanding increased. Consequently cash from operations decreased by approximately $13.5 million compared to fiscal 2009. Further, our acquisition of Connect3 in February 2009 increased headcount and related expenses in fiscal 2010, resulting in approximately $3.3 million lower net profit, after adjusting for non-cash related expenses, compared to fiscal 2009. In addition, other working capital items decreased cash from operations in fiscal 2010 by approximately $3.8 million compared to fiscal 2009, primarily due to reduced accrued compensation that resulted in a decrease of approximately $3.0 million in cash from operations related to the amount and timing of bonus payments.
Investing Activities
Our primary investing activities have been capital expenditures on equipment for our data centers, net purchases of marketable securities and payments for acquisitions.
Fiscal 2011 Compared to Fiscal 2010. Net cash used in investing activities was $9.6 million in fiscal 2011 compared to $6.7 million in fiscal 2010, primarily due to $2.7 million and $900,000 cash payments associated with the AIS and Connect3 acquisitions, respectively, and $5.1 million in capital expenditures. The $5.1 million in capital expenditures was largely related to the expansion of our data centers and equipment infrastructure required to support our strategy of embedding shopper segmentation and analytics into our software services.
Fiscal 2010 Compared to Fiscal 2009. Net cash used in investing activities was $6.7 million in fiscal 2010 compared to $25.8 million in fiscal 2009, primarily due to $12.5 million cash payments associated with the Connect3 acquisition and $2.5 million in capital expenditures, offset by approximately $8.4 million of net cash inflows from maturities of marketable securities. The $2.5 million in capital expenditures was largely related to the expansion of our data centers, including the setup of our new data center in Mesa, Arizona, and the leasehold improvements on our new corporate headquarters located in San Mateo,
59
California. Net cash used in investing activities was approximately $25.8 million in fiscal 2009, primarily due to approximately $21.7 million of net cash outflows to purchase marketable securities as we increased our investment due to uncertainty and volatility in interest rates. In addition, we made payments of $3.1 million for capital expenditures and $1.5 million to acquire assortment optimization technology in fiscal 2009.
Financing Activities
Our primary financing activities have been issuances of common stock related to our Initial Public Offering ("IPO") in August 2007, the exercise of stock options, and the sale of shares pursuant to our ESPP, as well as borrowings and repayments of notes payable and advances taken and repayments made under our lines of credit.
Fiscal 2011 Compared to Fiscal 2010. Net cash provided by financing activities was approximately $5.5 million in fiscal 2011. In fiscal 2011, we had $6.5 million of net proceeds from the issuance of common stock related to exercises of stock options and the sale of shares pursuant to our ESPP, partially offset by $937,000 in cash payments to fulfill employee federal and state withholding tax obligations in connection with the vesting and settlement of certain outstanding RSUs. We withheld 148,523 shares of our common stock in lieu of the tax withholding obligations upon settlement of these RSUs.
Fiscal 2010 Compared to Fiscal 2009. Net cash provided by financing activities was approximately $1.3 million in fiscal 2010. In fiscal 2010, we had $2.6 million of net proceeds from the issuance of common stock related to exercises of stock options and the sale of shares pursuant to our ESPP, partially offset by the payoff of $1.3 million of the assumed short-term notes payable held by a former Connect3 officer and principal shareholder. Net cash provided by financing activities was approximately $2.6 million in fiscal 2009, primarily attributable to net proceeds from the issuance of our common stock.
We believe that our cash, cash equivalents, and marketable securities balances as of February 28, 2011, along with cash provided by operating activities, if any, will be sufficient to fund our projected operating requirements for at least the next twelve months. We may need to raise additional capital or incur debt to continue to fund our operations over the long term. Our future capital requirements will depend on many factors, including revenues, any expansion of our workforce, the timing and extent of any expansion into new markets, the timing of introductions of any new functionality and enhancements to our software, the timing and size of any acquisitions of other companies or assets and the continuing market acceptance of our software. We may enter into arrangements for potential acquisitions of complementary businesses, services or technologies, which also could require us to seek additional equity or debt financing. Additional funds may not be available on terms favorable to us or at all. In March 2011, we had a cash outflow of approximately $9.0 million in connection with our acquisition of M-Factor.
Contractual Obligations
Our principal commitments consist of obligations under operating leases for office space in the United States, data center facilities and equipment, merger consideration payable, and certain contractual commitments. Our future operating lease obligations will change if we enter into new lease agreements upon the expiration of our existing lease agreements or if we enter into new lease agreements to expand our operations.
60
At February 28, 2011, the future minimum payments under our lease commitments, contractual commitments, and amounts due for merger consideration were as follows:
| |
Payments Due by Period | |||||||||||||||
|---|---|---|---|---|---|---|---|---|---|---|---|---|---|---|---|---|
| |
Total | Less than 1 Year |
1 - 3 Years | 3 - 5 Years | More than 5 Years |
|||||||||||
| |
(In thousands) |
|||||||||||||||
Operating leases(1) |
$ | 10,653 | $ | 3,043 | $ | 5,232 | $ | 2,366 | $ | 12 | ||||||
Contractual commitments(2) |
2,187 | 2,187 | — | — | — | |||||||||||
Merger consideration payable |
475 | — | 475 | — | — | |||||||||||
Total contractual obligations |
$ | 13,315 | $ | 5,230 | $ | 5,707 | $ | 2,366 | $ | 12 | ||||||
- (1)
- Includes
approximately $9.1 million in future minimum lease payments, $8.5 million of which was associated with our headquarters facility in
San Mateo, California, and approximately $1.5 million in future minimum lease payments for equipment and facility operating leases associated with our data center in Mesa, Arizona, entered into
in fiscal 2010 and 2011. See Note 5 of Notes to Consolidated Financial Statements.
- (2)
- Amounts are associated with agreements for contract engineering services and other purchase commitments that are enforceable and legally binding and that specify all significant terms, including fixed or minimum services to be used; fixed, minimum, or variable price provisions; and the approximate timing of the transactions. Obligations under contracts that we can cancel without a significant penalty are not included.
Off-Balance Sheet Arrangements
We do not have any relationships with unconsolidated entities or financial partnerships, such as entities often referred to as structured finance or special purpose entities, which would have been established for the purpose of facilitating off-balance sheet arrangements or other contractually narrow or limited purposes, nor do we have any undisclosed material transactions or commitments involving related persons or entities.
Recent Accounting Pronouncements
For information with respect to recent accounting pronouncements and the impact of these pronouncements on our consolidated financial statements, see Note 1 of Notes to Consolidated Financial Statements.
Item 7A. Quantitative and Qualitative Disclosures About Market Risk
Foreign Currency Risk
As we operate internationally and fund our international operations, our cash and cash equivalents could be affected by fluctuations in foreign exchange rates. The net increase (decrease) as a result of foreign exchange rate changes on our cash and cash equivalents were approximately $52,000, $(31,000), and $(253,000) in fiscal 2011, 2010, and 2009, respectively.
Certain of our international sales agreements are denominated in the country of origin currency, and therefore our revenue and receivables are subject to foreign currency risk. Also, some of our operating expenses and cash flows are denominated in foreign currencies and, thus, are subject to fluctuations due to changes in foreign currency exchange rates, particularly changes in the exchange rates for the British Pound and the Euro. We periodically enter into foreign exchange forward contracts to reduce exposure in non-U.S. dollar denominated receivables. We formally assess, both at a hedge's inception and on an ongoing basis, whether the derivatives used in hedging transactions are highly effective in negating
61
currency risk. At February 28, 2011, we had two outstanding forward foreign exchange contracts to sell Euros for U.S. dollars in November 2011 and 2012, with the same notional principal of €926,000 (or approximately $1.2 million). We do not enter into derivative financial instruments for speculative or trading purposes.
With respect to our international operations, we have remeasured our accounts denominated in non-U.S. currencies using the U.S. dollar as the functional currency and recorded the resulting gains (losses) within other income (expense) for the period. We remeasure all monetary assets and liabilities at the current exchange rate at the end of the period, non-monetary assets and liabilities at historical exchange rates, and revenue and expenses at average exchange rates in effect during the period.
Interest Rate Sensitivity
We had cash and cash equivalents totaling $26.6 million and marketable securities totaling $46.4 million as of February 28, 2011. These amounts were invested primarily in government securities and corporate notes and bonds with credit ratings of at least A-1 or better, money market funds registered with the SEC under rule 2a-7 of the Investment Company Act of 1940, and interest-bearing demand deposit accounts. By policy, we limit the amount of credit exposure to any one issuer and we do not enter into investments for trading or speculative purposes. Our cash and cash equivalents and marketable securities are held and invested with capital preservation as the primary objective.
Our cash equivalents and marketable securities are subject to market risk due to changes in interest rates. Fixed-rate interest securities may have their market value adversely impacted due to a rise in interest rates, while floating rate securities may produce less income than expected if interest rates fall. Due in part to these factors, our future investment income may fall short of expectations due to changes in interest rates or we may suffer losses in principal if we are forced to sell securities that decline in market value due to changes in interest rates. However, because we classify our marketable securities as "held-to-maturity," no gains or losses are recognized due to changes in interest rates unless such securities are sold prior to maturity or declines in fair value are determined to be other-than-temporary. We believe that we do not have any material exposure to changes in the fair value of our investment portfolio as a result of changes in interest rates. Declines in interest rates, however, will reduce future investment income, if any. For instance, a fluctuation in interest rates of 100 basis points at February 28, 2011 would result in a change of approximately $730,000 in annual interest income.
Effects of Inflation
We do not believe that inflation has had a material effect on our business, financial condition or results of operations. If our costs were to become subject to significant inflationary pressures, we might not be able to offset these higher costs fully through price increases. Our inability or failure to do so could harm our business, operating results and financial condition.
62
Item 8. Financial Statements and Supplementary Data
| |
Page | |
|---|---|---|
DemandTec, Inc. Consolidated Financial Statements |
||
Reports of Independent Registered Public Accounting Firm |
64 | |
Consolidated Balance Sheets |
66 | |
Consolidated Statements of Operations |
67 | |
Consolidated Statements of Stockholders' Equity |
68 | |
Consolidated Statements of Cash Flows |
69 | |
Notes to Consolidated Financial Statements |
70 |
63
Report of Independent Registered Public Accounting Firm
The
Board of Directors and Stockholders
DemandTec, Inc.
We have audited the accompanying consolidated balance sheets of DemandTec, Inc. as of February 28, 2011 and 2010, and the related consolidated statements of operations, stockholders' equity, and cash flows for each of the three years in the period ended February 28, 2011. Our audits also included the financial statement schedule listed in the Index at Item 15(b). These financial statements and schedule are the responsibility of the Company's management. Our responsibility is to express an opinion on these financial statements and schedule based on our audits.
We conducted our audits in accordance with the standards of the Public Company Accounting Oversight Board (United States). Those standards require that we plan and perform the audit to obtain reasonable assurance about whether the financial statements are free of material misstatement. An audit includes examining, on a test basis, evidence supporting the amounts and disclosures in the financial statements. An audit also includes assessing the accounting principles used and significant estimates made by management, as well as evaluating the overall financial statement presentation. We believe that our audits provide a reasonable basis for our opinion.
In our opinion, the financial statements referred to above present fairly, in all material respects, the consolidated financial position of DemandTec, Inc. at February 28, 2011 and 2010, and the consolidated results of its operations and its cash flows for each of the three years in the period ended February 28, 2011, in conformity with U.S. generally accepted accounting principles. Also, in our opinion, the related financial statement schedule, when considered in relation to the basic financial statements taken as a whole, presents fairly, in all material respects the information set forth therein.
We also have audited, in accordance with the standards of the Public Company Accounting Oversight Board (United States), DemandTec, Inc.'s internal control over financial reporting as of February 28, 2011, based on criteria established in Internal Control—Integrated Framework issued by the Committee of Sponsoring Organizations of the Treadway Commission and our report dated April 21, 2011 expressed an unqualified opinion thereon.
| /s/ ERNST & YOUNG LLP | ||
San Jose, California April 21, 2011 |
64
Report of Independent Registered Public Accounting Firm
The
Board of Directors and Stockholders
DemandTec, Inc.
We have audited DemandTec, Inc.'s internal control over financial reporting as of February 28, 2011, based on criteria established in Internal Control—Integrated Framework issued by the Committee of Sponsoring Organizations of the Treadway Commission (the COSO criteria). DemandTec, Inc.'s management is responsible for maintaining effective internal control over financial reporting, and for its assessment of the effectiveness of internal control over financial reporting included in the accompanying Management's Annual Report on Internal Control over Financial Reporting. Our responsibility is to express an opinion on the company's internal control over financial reporting based on our audit.
We conducted our audit in accordance with the standards of the Public Company Accounting Oversight Board (United States). Those standards require that we plan and perform the audit to obtain reasonable assurance about whether effective internal control over financial reporting was maintained in all material respects. Our audit included obtaining an understanding of internal control over financial reporting, assessing the risk that a material weakness exists, testing and evaluating the design and operating effectiveness of internal control based on the assessed risk, and performing such other procedures as we considered necessary in the circumstances. We believe that our audit provides a reasonable basis for our opinion.
A company's internal control over financial reporting is a process designed to provide reasonable assurance regarding the reliability of financial reporting and the preparation of financial statements for external purposes in accordance with generally accepted accounting principles. A company's internal control over financial reporting includes those policies and procedures that (1) pertain to the maintenance of records that, in reasonable detail, accurately and fairly reflect the transactions and dispositions of the assets of the company; (2) provide reasonable assurance that transactions are recorded as necessary to permit preparation of financial statements in accordance with generally accepted accounting principles, and that receipts and expenditures of the company are being made only in accordance with authorizations of management and directors of the company; and (3) provide reasonable assurance regarding prevention or timely detection of unauthorized acquisition, use or disposition of the company's assets that could have a material effect on the financial statements.
Because of its inherent limitations, internal control over financial reporting may not prevent or detect misstatements. Also, projections of any evaluation of effectiveness to future periods are subject to the risk that controls may become inadequate because of changes in conditions, or that the degree of compliance with the policies or procedures may deteriorate.
In our opinion, DemandTec, Inc. maintained, in all material respects, effective internal control over financial reporting as of February 28, 2011, based on the COSO criteria.
We also have audited, in accordance with the standards of the Public Company Accounting Oversight Board (United States), the consolidated balance sheets of DemandTec, Inc. as of February 28, 2011 and 2010, and the related consolidated statements of operations, stockholders' equity, and cash flows for each of the three years in the period ended February 28, 2011 of DemandTec, Inc. and our report dated April 21, 2011 expressed an unqualified opinion thereon.
| /s/ ERNST & YOUNG LLP | ||
San Jose, California April 21, 2011 |
65
DemandTec, Inc.
Consolidated Balance Sheets
(In thousands, except par value data)
| |
February 28, | |||||||
|---|---|---|---|---|---|---|---|---|
| |
2011 | 2010 | ||||||
ASSETS |
||||||||
Current assets: |
||||||||
Cash and cash equivalents |
$ | 26,583 | $ | 21,335 | ||||
Marketable securities, current |
40,834 | 36,068 | ||||||
Accounts receivable, net of allowances of $130 and $145 at February 28, 2011 and 2010, respectively |
9,357 | 13,984 | ||||||
Prepaid expenses and other current assets |
3,548 | 3,127 | ||||||
Total current assets |
80,322 | 74,514 | ||||||
Marketable securities, non-current |
5,563 | 9,881 | ||||||
Property, equipment and leasehold improvements, net |
6,556 | 4,777 | ||||||
Intangible assets |
2,714 | 4,328 | ||||||
Goodwill |
18,828 | 16,599 | ||||||
Other assets, net |
1,112 | 563 | ||||||
Total assets |
$ | 115,095 | $ | 110,662 | ||||
LIABILITIES AND STOCKHOLDERS' EQUITY |
||||||||
Current liabilities: |
||||||||
Accounts payable and accrued expenses |
$ | 13,084 | $ | 12,875 | ||||
Deferred revenue, current |
41,121 | 38,462 | ||||||
Merger consideration payable |
— | 1,000 | ||||||
Total current liabilities |
54,205 | 52,337 | ||||||
Deferred revenue, non-current |
304 | 459 | ||||||
Other long-term liabilities |
1,783 | 928 | ||||||
Commitments and contingencies (see Note 5) |
||||||||
Stockholders' equity: |
||||||||
Common stock, $0.001 par value—175,000 shares authorized, and 31,782 and 29,501 shares issued and outstanding at February 28, 2011 and 2010, respectively |
32 | 29 | ||||||
Additional paid-in capital |
161,505 | 145,600 | ||||||
Accumulated other comprehensive income |
147 | 527 | ||||||
Accumulated deficit |
(102,881 | ) | (89,218 | ) | ||||
Total stockholders' equity |
58,803 | 56,938 | ||||||
Total liabilities and stockholders' equity |
$ | 115,095 | $ | 110,662 | ||||
See Notes to Consolidated Financial Statements.
66
DemandTec, Inc.
Consolidated Statements of Operations
| |
Year Ended February 28, | ||||||||||
|---|---|---|---|---|---|---|---|---|---|---|---|
| |
2011 | 2010 | 2009 | ||||||||
| |
(In thousands, except per share data) |
||||||||||
Revenue |
$ | 82,418 | $ | 79,052 | $ | 75,005 | |||||
Cost of revenue(1) |
29,232 | 25,760 | 23,331 | ||||||||
Gross profit |
53,186 | 53,292 | 51,674 | ||||||||
Operating expenses: |
|||||||||||
Research and development |
32,299 | 32,279 | 26,787 | ||||||||
Sales and marketing |
23,613 | 20,828 | 20,343 | ||||||||
General and administrative |
9,706 | 9,657 | 9,888 | ||||||||
Amortization of purchased intangible assets |
1,134 | 2,044 | 1,241 | ||||||||
Restructuring charges |
— | 775 | — | ||||||||
Total operating expenses |
66,752 | 65,583 | 58,259 | ||||||||
Loss from operations |
(13,566 | ) | (12,291 | ) | (6,585 | ) | |||||
Other income (expense), net: |
|||||||||||
Interest income |
249 | 577 | 1,772 | ||||||||
Interest expense |
(94 | ) | (87 | ) | (84 | ) | |||||
Other income (expense) |
13 | (184 | ) | (103 | ) | ||||||
Other income (expense), net |
168 | 306 | 1,585 | ||||||||
Loss before provision (benefit) for income taxes |
(13,398 | ) | (11,985 | ) | (5,000 | ) | |||||
Provision (benefit) for income taxes |
265 | (148 | ) | (47 | ) | ||||||
Net loss |
$ | (13,663 | ) | $ | (11,837 | ) | $ | (4,953 | ) | ||
Net loss per common share, basic and diluted |
$ | (0.45 | ) | $ | (0.41 | ) | $ | (0.18 | ) | ||
Shares used in computing net loss per common share, basic and diluted |
30,529 | 28,720 | 27,372 | ||||||||
(1) Includes amortization of purchased intangible assets |
$ | 1,903 | $ | 1,862 | $ | 610 |
See Notes to Consolidated Financial Statements.
67
DemandTec, Inc.
Consolidated Statements of Stockholders' Equity
| |
Common Stock | |
Accumulated Other Comprehensive Income |
|
|
|||||||||||||||
|---|---|---|---|---|---|---|---|---|---|---|---|---|---|---|---|---|---|---|---|---|
| |
Additional Paid-In Capital |
Accumulated Deficit |
Total Stockholders' Equity |
|||||||||||||||||
| |
Shares | Amount | ||||||||||||||||||
| |
(In thousands) |
|||||||||||||||||||
Balance at February 29, 2008 |
26,452 | $ | 26 | $ | 122,699 | $ | — | $ | (72,428 | ) | $ | 50,297 | ||||||||
Issuance of common stock under employee stock purchase plan and upon exercise of stock options |
1,341 | 2 | 2,608 | — | — | 2,610 | ||||||||||||||
Conversion of vested restricted stock units to shares |
243 | — | — | — | — | — | ||||||||||||||
Vesting of common stock related to early exercise of stock option |
23 | — | 34 | — | — | 34 | ||||||||||||||
Stock-based compensation expense |
— | — | 7,979 | — | — | 7,979 | ||||||||||||||
Components of comprehensive loss: |
||||||||||||||||||||
Net loss |
— | — | — | — | (4,953 | ) | (4,953 | ) | ||||||||||||
Change in fair value of cash flow hedge |
— | — | — | 682 | — | 682 | ||||||||||||||
Comprehensive loss |
— | — | — | — | — | (4,271 | ) | |||||||||||||
Balance at February 28, 2009 |
28,059 | 28 | 133,320 | 682 | (77,381 | ) | 56,649 | |||||||||||||
Issuance of common stock under employee stock purchase plan and upon exercise of stock options |
1,004 | 1 | 2,552 | — | — | 2,553 | ||||||||||||||
Conversion of vested restricted stock units to shares |
434 | — | — | — | — | — | ||||||||||||||
Vesting of common stock related to early exercise of stock options |
4 | — | 9 | — | — | 9 | ||||||||||||||
Stock-based compensation expense |
— | — | 9,719 | — | — | 9,719 | ||||||||||||||
Components of comprehensive loss: |
||||||||||||||||||||
Net loss |
— | — | — | — | (11,837 | ) | (11,837 | ) | ||||||||||||
Gain reclassified from accumulated other comprehensive income into revenue |
— | — | — | (101 | ) | — | (101 | ) | ||||||||||||
Change in fair value of cash flow hedge |
— | — | — | (54 | ) | — | (54 | ) | ||||||||||||
Comprehensive loss |
— | — | — | — | — | (11,992 | ) | |||||||||||||
Balance at February 28, 2010 |
29,501 | 29 | 145,600 | 527 | (89,218 | ) | 56,938 | |||||||||||||
Issuance of common stock under employee stock purchase plan and upon exercise of stock options |
1,782 | 2 | 6,477 | — | — | 6,479 | ||||||||||||||
Conversion of vested restricted stock units to shares |
647 | 1 | (1 | ) | — | — | — | |||||||||||||
Repurchase of restricted stock units in settlement of employee withholding tax |
(148 | ) | — | (937 | ) | — | — | (937 | ) | |||||||||||
Stock-based compensation expense |
— | — | 10,366 | — | — | 10,366 | ||||||||||||||
Components of comprehensive loss: |
||||||||||||||||||||
Net loss |
— | — | — | — | (13,663 | ) | (13,663 | ) | ||||||||||||
Gain reclassified from accumulated other comprehensive income into revenue |
— | — | — | (357 | ) | — | (357 | ) | ||||||||||||
Change in fair value of cash flow hedge |
— | — | — | (23 | ) | — | (23 | ) | ||||||||||||
Comprehensive loss |
— | — | — | — | — | (14,043 | ) | |||||||||||||
Balance at February 28, 2011 |
31,782 | $ | 32 | $ | 161,505 | $ | 147 | $ | (102,881 | ) | $ | 58,803 | ||||||||
See Notes to Consolidated Financial Statements.
68
DemandTec, Inc
Consolidated Statements of Cash Flows
| |
Year Ended February 28, | ||||||||||
|---|---|---|---|---|---|---|---|---|---|---|---|
| |
2011 | 2010 | 2009 | ||||||||
| |
(In thousands) |
||||||||||
Operating activities: |
|||||||||||
Net loss |
$ | (13,663 | ) | $ | (11,837 | ) | $ | (4,953 | ) | ||
Adjustments to reconcile net loss to net cash provided by (used in) operating activities: |
|||||||||||
Depreciation |
3,353 | 3,009 | 2,930 | ||||||||
Stock-based compensation expense |
10,366 | 9,719 | 7,979 | ||||||||
Amortization of purchased intangible assets |
3,037 | 3,906 | 1,851 | ||||||||
Provision for doubtful accounts |
485 | 25 | — | ||||||||
Other |
(365 | ) | (45 | ) | 266 | ||||||
Changes in operating assets and liabilities: |
|||||||||||
Accounts receivable |
4,115 | (3,027 | ) | 7,706 | |||||||
Prepaid expenses and other current assets |
(660 | ) | 716 | 402 | |||||||
Other assets |
(550 | ) | 8 | 761 | |||||||
Accounts payable and accrued liabilities |
622 | 1,209 | 1,586 | ||||||||
Accrued compensation |
40 | (596 | ) | 2,363 | |||||||
Deferred revenue |
2,456 | (9,866 | ) | (7,078 | ) | ||||||
Net cash provided by (used in) operating activities |
9,236 | (6,779 | ) | 13,813 | |||||||
Investing activities: |
|||||||||||
Purchases of property, equipment and leasehold improvements |
(5,127 | ) | (2,513 | ) | (3,117 | ) | |||||
Purchases of marketable securities |
(64,577 | ) | (61,107 | ) | (82,500 | ) | |||||
Maturities of marketable securities |
64,129 | 69,470 | 60,820 | ||||||||
Acquisition of AIS |
(2,675 | ) | — | — | |||||||
Acquisition of Connect3, net of cash received |
(900 | ) | (12,544 | ) | 257 | ||||||
Acquisition of TradePoint (payment of promissory note) |
(432 | ) | — | — | |||||||
Purchase of intangible assets |
— | — | (1,500 | ) | |||||||
Removal of restricted cash |
— | — | 200 | ||||||||
Net cash used in investing activities |
(9,582 | ) | (6,694 | ) | (25,840 | ) | |||||
Financing activities: |
|||||||||||
Proceeds from issuance of common stock, net of repurchases |
6,479 | 2,553 | 2,603 | ||||||||
Payment of employee withholding tax in lieu of issuing common stock |
(937 | ) | — | — | |||||||
Payments on notes payable |
— | (1,286 | ) | (8 | ) | ||||||
Net cash provided by financing activities |
5,542 | 1,267 | 2,595 | ||||||||
Effect of exchange rate changes on cash and cash equivalents |
52 | (31 | ) | (253 | ) | ||||||
Net increase (decrease) in cash and cash equivalents |
5,248 | (12,237 | ) | (9,685 | ) | ||||||
Cash and cash equivalents at beginning of year |
21,335 | 33,572 | 43,257 | ||||||||
Cash and cash equivalents at end of year |
$ | 26,583 | $ | 21,335 | $ | 33,572 | |||||
Supplemental information: |
|||||||||||
Cash paid for interest |
$ | 70 | $ | 60 | $ | 65 | |||||
Cash paid for (refund of) income taxes |
$ | (40 | ) | $ | (107 | ) | $ | 157 | |||
Non-cash financing and investing activities: |
|||||||||||
Merger consideration payable to AIS and Connect3 shareholders |
$ | 475 | $ | — | $ | 13,343 | |||||
Assumed notes payable to a former Connect3 officer and principal shareholder |
$ | — | $ | — | $ | 1,286 | |||||
See Notes to Consolidated Financial Statements.
69
DemandTec, Inc.
Notes to Consolidated Financial Statements
1. Business Summary and Significant Accounting Policies
Description of Business
DemandTec, Inc. (the "Company" or "We") was incorporated in Delaware on November 1, 1999. We provide a collaborative optimization network of software services connecting retail and CP companies, enabling them to define category, brand, and shopper marketing strategies based on a scientific understanding of consumer behavior and make actionable pricing, promotion, assortment, space, and other merchandising and marketing decisions to achieve their revenue, profitability, sales volume, and customer loyalty objectives. We provide our applications by means of a software-as-a-service, or SaaS, model, which allows us to capture and analyze the most recent retailer and market-level data, enhance our software services rapidly to address our customers' ever-changing merchandising and marketing needs, and connect retailers and CP companies online to enable improved, more collaborative business processes between trading partners. We are headquartered in San Mateo, California, with additional sales presence in North America, Europe, and South America, and research and development personnel in India, China, and Russia.
Principles of Consolidation
Our consolidated financial statements include our accounts and those of our wholly owned subsidiaries. All significant intercompany balances and transactions have been eliminated in consolidation.
Fiscal Year
Our fiscal year ends on the last day in February. References to fiscal 2011, for example, refer to our fiscal year ended February 28, 2011.
Segments
We operate in a single segment and we report financial information on a consolidated basis.
Use of Estimates
We prepare our consolidated financial statements in accordance with accounting principles generally accepted in the United States, or GAAP. These accounting principles require us to make certain estimates and judgments that can affect the reported amounts of assets and liabilities as of the date of our consolidated financial statements, as well as the reported amounts of revenue and expenses during the periods presented. Significant estimates and assumptions made by management include the determination of the fair value of share-based payments, the fair value of purchased intangible assets, the recoverability of long-lived assets, and the provision for income taxes. We believe that the estimates and judgments upon which we rely are reasonable based upon information available to us at the time that these estimates and judgments are made. To the extent there are material differences between these estimates and actual results, our consolidated financial statements will be affected.
Revenue Recognition
We generate revenue from fees under agreements with initial terms that generally are one to three years in length. Our agreements contain multiple elements, which include the use of our software, SaaS delivery services, professional services, maintenance, and customer support. Professional services consist of implementation, training, data modeling, and analytical services related to our customers' use of our
70
DemandTec, Inc.
Notes to Consolidated Financial Statements (Continued)
1. Business Summary and Significant Accounting Policies (Continued)
software. We have determined that the elements within our agreements do not qualify for treatment as separate units of accounting. Therefore, we account for all fees received under our agreements as a single unit of accounting and recognize them ratably over the term of the related agreement, commencing upon the later of the agreement start date or the date access to the application is provided to the customers, and when all of the following conditions are also met:
- •
- there is persuasive evidence of an arrangement;
- •
- the service has been provided to the customer;
- •
- the collection of the fees is probable; and
- •
- the amount of fees to be paid by the customer is fixed or determinable.
Deferred Revenue
Deferred revenue consists of amounts billed or payments received in advance of revenue recognition. Contracts under which we advance bill customers have been generally non-cancellable. For agreements with terms over one year, we generally invoice our customers in annual installments. Accordingly, the deferred revenue balance associated with such multi-year, non-cancellable agreements does not represent the total contract value. Deferred revenue to be recognized in the succeeding twelve month period is included in current deferred revenue on our consolidated balance sheets, with the remaining amounts included in non-current deferred revenue.
Foreign Currency Translation
The denomination of the majority of our sales arrangements and the functional currency of our international operations is the United States dollar. Our international operations' financial statements are remeasured into United States dollars, with adjustments recorded as foreign currency gains (losses) in the consolidated statements of operations. All monetary assets and liabilities are remeasured at the current exchange rate at the end of the period, non-monetary assets and liabilities are remeasured at historical exchange rates, and revenue and expenses are remeasured at average exchange rates in effect during the period. We recognized a foreign currency gain (loss) of approximately $12,000, $(176,000), and $(97,000) in fiscal 2011, 2010, and 2009, respectively, in other income (expense).
Concentrations of Credit Risk, Significant Customers and Suppliers and Geographic Information
Our financial instruments that are exposed to concentrations of credit risk consist primarily of cash and cash equivalents, marketable securities, accounts receivable, and a line of credit. Although we deposit our cash with multiple financial institutions, our deposits, at times, may exceed federally insured limits. Collateral is not required for accounts receivable.
We had two customers that accounted for 21% and 11%, respectively, of our total revenue in fiscal 2011. We had one customer that accounted for 14% of our total revenue in each of fiscal 2010 and 2009.
71
DemandTec, Inc.
Notes to Consolidated Financial Statements (Continued)
1. Business Summary and Significant Accounting Policies (Continued)
At February 28, 2011 and 2010, long-lived assets located outside the United States were not significant. Revenue by geographic region, based on the billing address of the customer, was as follows (in thousands):
| |
Year Ended February 28, | |||||||||
|---|---|---|---|---|---|---|---|---|---|---|
| |
2011 | 2010 | 2009 | |||||||
| |
(In thousands) |
|||||||||
United States |
$ | 71,366 | $ | 68,174 | $ | 64,664 | ||||
International |
11,052 | 10,878 | 10,341 | |||||||
Total revenue |
$ | 82,418 | $ | 79,052 | $ | 75,005 | ||||
As of February 28, 2011, two customers accounted for 22% and 13%, respectively, of our accounts receivable balance. As of February 28, 2010, three customers accounted for 21%, 17%, and 10%, respectively, of our accounts receivable balance.
The equipment hosting our software is located in three third-party data center facilities located in San Jose and Sacramento, California, and Mesa, Arizona. We do not control the operation of these facilities, and our operations are vulnerable to damage or interruption in the event either of these third-party data center facilities fails.
Fair Value of Financial Instruments
The carrying amounts of our financial instruments, which include cash and cash equivalents, marketable securities, accounts receivable, and notes payable, approximate their fair values. Our financial assets and liabilities are remeasured and reported at fair value at each reporting period. We measure our foreign currency forward contracts at fair value. Our foreign currency forward contracts are classified within Level 2 as the valuation inputs are based on quoted prices of similar instruments in active markets and do not involve management judgment.
Cash and Cash Equivalents
We consider all highly liquid investments purchased with original maturities of three months or less to be cash equivalents. Cash and cash equivalents, which primarily consist of cash on deposit with banks and money market funds, are recorded at cost, which approximates fair value.
Marketable Securities
Our primary objectives when investing excess cash, in order of priority, are capital preservation, short-term liquidity, and achieving a reasonable rate of return. A significant portion of our marketable securities mature within one year and we limit the amount of credit exposure to any one issuer. We invest excess cash primarily in the securities of high credit quality issuers, such as highly liquid debt instruments of the government-sponsored enterprises, commercial paper, corporate bonds, certificate of deposit, and money market instruments.
We classify our investments as held-to-maturity at the time of purchase and reevaluate the classification at each balance sheet date. We further classify them as current or non-current based on the maturity dates of the individual debt securities at each reporting date.
72
DemandTec, Inc.
Notes to Consolidated Financial Statements (Continued)
1. Business Summary and Significant Accounting Policies (Continued)
We monitor our investments in marketable securities for impairment on a periodic basis. In the event that the carrying value of an investment exceeds its fair value and the decline in value is determined to be other-than-temporary, we record an impairment charge and establish a new cost basis for the investment. We did not record any impairment adjustments in the current and prior year periods. In order to determine whether a decline in value is other-than-temporary, we evaluate, among other things, the duration and extent to which the fair value has been less than the carrying value, current market conditions, and our intent and ability to retain the investment for a period of time sufficient to allow for any anticipated recovery in fair market value.
Allowance for Doubtful Accounts
We provide an allowance for doubtful accounts based on a review of the current status of existing accounts receivable and historical collection experience. As of February 28, 2011 and 2010, our allowance for doubtful accounts receivable was approximately $130,000 and $145,000, respectively. Write-offs of accounts receivable during fiscal 2011 were approximately $500,000, associated with a customer invoice that was in dispute. Write-offs of accounts receivable during fiscal 2009 were approximately $40,000, and there were no write-offs during fiscal 2010.
Deferred Commissions
We capitalize certain commission costs directly related to the acquisition of a customer agreement. Our commission payments are paid shortly after our receipt of the related customer payment. Commissions are deferred and amortized to sales and marketing expense over the revenue recognition term of the related non-cancelable customer agreement. We believe this is the appropriate method of accounting as the commission charges are so closely related to the revenue from the customer contracts that they should be recorded as an asset and charged to expense over the same period that the related revenue is recognized. Commission costs amortized to sales and marketing expense were approximately $1.9 million, $2.3 million, and $3.4 million in fiscal 2011, 2010, and 2009, respectively. At February 28, 2011 and 2010, deferred commission costs totaled approximately $1.9 million and $843,000, respectively, and are included in "Prepaid expenses and other current assets" and "Other assets, net" on our balance sheets.
Property, Equipment and Leasehold Improvements
Property, equipment and leasehold improvements are stated at historical cost, net of accumulated depreciation. Depreciation is calculated using the straight-line method over estimated useful lives of three to five years. Leasehold improvements are amortized over the shorter of the lease term or the estimated useful lives of the improvements. Repair and maintenance costs are expensed as incurred.
Goodwill and Intangible Assets
We record as goodwill the excess of the acquisition purchase price over the fair value of the tangible and identifiable intangible assets acquired. We do not amortize goodwill, but perform an annual impairment review of our goodwill during our third quarter, or more frequently if indicators of potential impairment arise. We have a single operating segment and consequently evaluate goodwill for impairment based on an evaluation of the fair value of our company as a whole. We record purchased intangible assets at their respective estimated fair values at the date of acquisition. Purchased intangible assets are being amortized using the straight-line method over their remaining estimated useful lives, which currently range
73
DemandTec, Inc.
Notes to Consolidated Financial Statements (Continued)
1. Business Summary and Significant Accounting Policies (Continued)
from approximately one to seven years. We evaluate the remaining useful lives of intangible assets on a periodic basis to determine whether events or circumstances warrant a revision to the remaining estimated amortization period. We evaluated our goodwill in November 2010 and recognized no impairment charges as a result of the review. Additionally, we observed no impairment indicators for both goodwill and intangible assets through the filing of this Annual Report on Form 10-K.
Impairment of Long-Lived Assets
Long-lived assets are reviewed for possible impairment whenever events or circumstances indicate that the carrying amount of these assets may not be recoverable. We evaluate the recoverability of each of our long-lived assets, including purchased intangible assets and property, equipment, and leasehold improvements, by comparison of its carrying amount to the future undiscounted cash flows we expect the asset to generate. If we consider the asset to be impaired, we measure the amount of any impairment as the difference between the carrying amount and the fair value of the impaired asset. We observed no impairment indicators through the filing of this Annual Report on Form 10-K.
Advertising Expenses
Advertising costs are expensed when incurred and are included in sales and marketing expenses in the accompanying consolidated statements of operations. We incurred advertising expenses of approximately $319,000, $532,000, and $124,000 for fiscal 2011, 2010, and 2009, respectively.
Research and Development and Software Development Costs
We capitalize the costs to develop software for our website and other internal uses, as well as the cost of upgrades and enhancements to that software, when preliminary development efforts are successfully completed, management has authorized and committed project funding, and it is probable that the project will be completed and the software will be used as intended. Any capitalized costs are amortized to expense on a straight-line basis over their expected lives. To date, internal software development costs eligible for capitalization have been insignificant, and accordingly we have charged all software development costs to research and development expense as incurred.
Warranties and Indemnification
Our software services are generally warranted to perform in a manner consistent with industry standards and materially in accordance with our documentation under normal use and circumstances. Additionally, our arrangements generally include provisions for indemnifying customers against liabilities if our services infringe a third party's intellectual property rights or if a breach of confidentiality obligations harms a third party. Further, we have entered into indemnification agreements with our officers, directors, and certain key employees, and our bylaws contain similar indemnification obligations. To date, we have not incurred any material costs as a result of those indemnification provisions and have not accrued any liabilities related to these obligations in the accompanying consolidated financial statements.
We have occasionally entered into service level agreements with our customers warranting defined levels of uptime reliability and performance and permitting those customers to receive service credits or discounted future services, or to terminate their agreements in the event that we fail to meet those levels. To date, we have not experienced any significant failures to meet defined levels of reliability and
74
DemandTec, Inc.
Notes to Consolidated Financial Statements (Continued)
1. Business Summary and Significant Accounting Policies (Continued)
performance as a result of those agreements and, accordingly, we have not accrued any liabilities related to these agreements in the accompanying consolidated financial statements
Income Taxes
Deferred tax assets and liabilities are determined based on the temporary differences between their financial reporting and tax bases and are measured using the enacted tax rates that are anticipated to be in effect when the differences are expected to reverse. Valuation allowances are established when necessary to reduce deferred tax assets to the amounts more likely than not expected to be realized. We have established a valuation allowance against substantially all of our deferred tax assets as we believe it is more likely than not that the deferred tax assets will not be realized.
We will continue to evaluate the need for a valuation allowance. We may determine that some, or all, of our deferred tax assets will be realized, in which case we will reduce our valuation allowance in the quarter in which such determination is made. If the valuation allowance is reduced, we may recognize a benefit from income taxes on our statement of operations in that period. In subsequent periods, we may have higher income tax expenses.
Derivative Instruments and Hedging Activities
We operate internationally and entered into foreign exchange forward contracts during fiscal 2011, 2010 and 2009 to reduce our exposure in non-U.S. dollar denominated accounts receivable. We designated these forward contracts as cash flow hedges of foreign currency denominated firm commitments; their objective was to negate the impact of currency exchange rate movements on our operating results. We do not enter into derivative financial instruments for speculative or trading purposes. We formally assess, both at a hedge's inception and on an ongoing basis, whether the derivatives used in hedging transactions are highly effective in negating currency risk. Combined implied interest on forward contracts was excluded from effectiveness testing. In fiscal 2011, 2010 and 2009, implicit interest costs totaled approximately $24,000, $40,000 and $40,000, respectively, and were included within interest expense. All forward contracts entered during fiscal 2011, 2010 and 2009 were deemed highly effective.
Comprehensive Loss
Comprehensive loss consists of net loss and other comprehensive income (loss), which includes certain changes in equity that are excluded from net loss. In fiscal 2011, 2010 and 2009, an unrealized gain (loss) on cash flow hedges and implicit interest of approximately $(23,000), $(54,000) and $682,000, respectively, was included in accumulated other comprehensive income, which has been reflected in stockholders' equity. In addition, in fiscal 2011 and 2010, we recognized in revenue approximately $357,000 and $101,000 of gain from accumulated other comprehensive income, which was associated with forward contracts that matured in November 2010, and May 2010 and 2009.
Stock-Based Compensation
We account for and recognize all share-based payments as expense in our statements of operations. Grants of stock options to employees, consultants, and to new members of our board of directors generally vest over four years and annual stock option grants to existing members of our board of directors vest over one year. We measure the value of stock options based on their grant date fair value using the Black-Scholes pricing model. Performance-based stock units, or PSUs, vest pursuant to certain performance and
75
DemandTec, Inc.
Notes to Consolidated Financial Statements (Continued)
1. Business Summary and Significant Accounting Policies (Continued)
time-based vesting criteria set by our Compensation Committee. We evaluate the probability of meeting the performance criteria at the end of each reporting period to determine how much compensation expense to record. Because the actual number of shares to be issued is not known until the end of the performance period, the actual compensation expense related to these awards could differ from our current expectations. We also have time-based restricted stock units, or RSUs, outstanding that entitle the recipient to receive shares of our common stock upon vesting and settlement of the awards pursuant to time-based vesting criteria set by our Compensation Committee. Stock-based compensation expense for PSUs and RSUs is based on the closing price of our common stock on the grant date. Options and RSUs granted to consultants and other non-employees are subject to periodic revaluation over their vesting terms and are charged to expense over the vesting term using the graded method. We amortize the fair value of those awards, net of estimated forfeitures, as stock-based compensation expense over the vesting period of the awards.
Net Loss per Common Share
Basic net loss per share is computed using the weighted average number of common shares outstanding during the period, excluding any unvested common shares subject to repurchase. All common shares subject to repurchase were fully vested prior to February 28, 2010 and the weighted average number of common shares subject to repurchase was immaterial in fiscal 2010 and 2009.
Potential common shares consist of the incremental common shares issuable upon the exercise of stock options or upon the settlement of PSUs and RSUs, and shares subject to issuance under our 2007 Employee Stock Purchase Program, or ESPP. The dilutive effect of such potential common shares is reflected in diluted loss per share by application of the treasury stock method and on an if-converted basis from the date of issuance. In fiscal 2011, 2010 and 2009, weighted average outstanding shares subject to options to purchase common stock, PSUs and RSUs, and shares subject to issuance under our ESPP were approximately 3,686,000, 3,824,000 shares and 4,371,000 shares, respectively. Because the Company has been in a loss position in all periods shown, shares used in computing basic and diluted net loss per common share were the same for all periods presented, as the impact of all potentially dilutive securities outstanding was anti-dilutive.
Recent Accounting Pronouncements
In December 2010, the Financial Accounting Standards Board (the "FASB") issued guidance to amend the disclosure requirements for supplementary pro forma information for business combinations. The guidance addresses the diversity in practice about the interpretation of the pro forma revenue and earnings disclosure requirements for business combinations. The amendments specify that if a public entity presents comparative financial statements, the entity should disclose revenue and earnings of the combined entity as though the business combination(s) that occurred during the current year had occurred as of the beginning of the comparable prior annual reporting period only. The amendments also expand the supplemental pro forma disclosures to include a description of the nature and amount of material, nonrecurring pro forma adjustments directly attributable to the business combination included in the reported pro forma revenue and earnings. The amendments are effective prospectively for business combinations for which the acquisition date is on or after the beginning of the first annual reporting period beginning on or after December 15, 2010. We will adopt this standard for acquisitions in fiscal 2012 and beyond and it will affect our disclosures of supplementary pro forma information in our consolidated financial statements associated with those acquisitions.
76
DemandTec, Inc.
Notes to Consolidated Financial Statements (Continued)
1. Business Summary and Significant Accounting Policies (Continued)
In April 2010, the FASB issued guidance on defining a milestone and determining when it may be appropriate to apply the milestone method of revenue recognition for research or development transactions. The guidance is effective on a prospective basis for milestones achieved in fiscal years beginning on or after June 15, 2010 and interim periods within those years, with early adoption permitted. We anticipate adopting this standard beginning in our first quarter of fiscal 2012 ending May 31, 2011 and do not expect a material impact on our consolidated financial statements upon the adoption of the new accounting standard.
In January 2010, the FASB issued guidance that requires additional disclosures for fair value measurements and provides clarification for existing disclosure requirements. The guidance requires a reporting entity to disclose separately the amounts of significant transfers in and out of Level 1 and Level 2 fair value measurements and the reasons for these transfers. In addition, the guidance requires enhanced disclosure of activity in Level 3 fair value measurements. The guidance is effective for interim and annual periods beginning after December 15, 2009, except for gross presentation of activity in Level 3 which is effective for annual periods beginning after December 15, 2010, and for interim periods in those years. We adopted the guidance for new disclosures for fair value measurements and clarification for existing disclosure requirements on March 1, 2010 and there was no impact on our condensed consolidated financial statements. We do not expect any impact on our consolidated financial statements upon effectiveness of the new standard for Level 3 activity.
In October 2009, the FASB issued a new accounting standard for revenue recognition for arrangements with multiple deliverables. The new standard impacts the determination of when the individual deliverables included in a multiple-element arrangement may be treated as separate units of accounting. Additionally, the new standard modifies the manner in which the transaction consideration is allocated across the separately identified deliverables by no longer permitting the residual method of allocating arrangement consideration. The new standard is effective for fiscal years beginning on or after June 15, 2010; however, early adoption of this standard is permitted. We are assessing the potential impact, if any, that the adoption will have on our consolidated results of operations and financial condition going forward.
In October 2009, the FASB issued a new accounting standard for the accounting for certain revenue arrangements that include software elements. The new standard amends the scope of pre-existing software revenue guidance by removing from the guidance non-software components of tangible products and certain software components of tangible products. The new standard is effective for fiscal years beginning on or after June 15, 2010; however, early adoption of this standard is permitted. We are assessing the potential impact, if any, that the adoption will have on our consolidated results of operations and financial condition going forward.
2. Acquisition
In December 2010, we acquired substantially all of the assets of Applied Intelligence Solutions, LLC ("AIS"), a provider of intelligent software solutions for retail enterprises, for approximately $3.2 million in cash. We accounted for the transaction as a business combination. We recorded approximately $2.2 million of goodwill and $950,000 of identifiable intangible assets. Intangible assets are being amortized on a straight-line basis over a period of two to four years. The goodwill is deductible for tax purposes.
In February 2009, we acquired all of the issued and outstanding capital stock of privately-held Connect3 Systems, Inc., or Connect3, a provider of advertising, planning, and execution software. The
77
DemandTec, Inc.
Notes to Consolidated Financial Statements (Continued)
2. Acquisition (Continued)
aggregate purchase price of Connect3 was approximately $13.5 million, which consisted of $13.3 million cash consideration and $201,000 of acquisition costs, all of which had been paid off as of February 28, 2011. We accounted for the Connect3 acquisition under the purchase method of accounting. The assets acquired and liabilities assumed were recorded at fair market value, based on the valuation performed by an independent third-party valuation firm. We recorded approximately $11.3 million of goodwill, $4.5 million of identifiable intangible assets, and $2.3 million of net liabilities assumed. Intangible assets have been amortized on a straight-line basis over a period of one to two and a half years, with a remaining weighted average useful life of six months at February 28, 2011. The goodwill is not deductible for tax purposes.
The results of both AIS's and Connect3's operations are included in our consolidated financial statements from the date of acquisition. Pro forma results of the two businesses have not been presented as they were not material to our consolidated financial statements for the periods presented prior to the acquisitions.
3. Goodwill and Purchased Intangibles
Goodwill
The changes in the carrying amount of goodwill for the fiscal years ended February 28, 2011 and 2010 are as follows (in thousands):
Balance at February 28, 2009 |
$ | 16,492 | |||
Connect3 subsequent goodwill adjustment, net of tax |
107 | ||||
Balance at February 28, 2010 |
16,599 | ||||
Goodwill recorded for AIS acquisition |
2,229 | ||||
Balance at February 28, 2011 |
$ | 18,828 | |||
Purchased Intangible Assets
Our purchased intangible assets are subject to amortization on a straight-line basis over their estimated useful lives as follows:
| |
Estimated Life |
Weighted Average Remaining Life |
|||||
|---|---|---|---|---|---|---|---|
| |
(In years) |
||||||
Developed technology |
2.5 to 5 | 1.9 | |||||
Customer relationships |
1.5 to 7 | 2.1 | |||||
Non-compete covenants |
2 to 3 | — | |||||
Backlog |
1.5 | — | |||||
Trade name |
4.3 | — | |||||
78
DemandTec, Inc.
Notes to Consolidated Financial Statements (Continued)
3. Goodwill and Purchased Intangibles (Continued)
The carrying values of intangible assets are as follows (in thousands):
| |
February 28, 2011 | February 28, 2010 | |||||||||||||||||
|---|---|---|---|---|---|---|---|---|---|---|---|---|---|---|---|---|---|---|---|
| |
Gross Value |
Accumulated Amortization |
Net Carrying Amount |
Gross Value |
Accumulated Amortization |
Net Carrying Amount |
|||||||||||||
Developed technology |
$ | 8,420 | $ | (6,679 | ) | $ | 1,741 | $ | 7,680 | $ | (4,785 | ) | $ | 2,895 | |||||
Customer relationships |
2,788 | (1,845 | ) | 943 | 2,150 | (1,254 | ) | 896 | |||||||||||
Non-compete covenants |
840 | (840 | ) | — | 840 | (670 | ) | 170 | |||||||||||
Trade name |
560 | (560 | ) | — | 560 | (187 | ) | 373 | |||||||||||
Backlog |
175 | (175 | ) | — | (158 | ) | 152 | (6 | ) | ||||||||||
In-process research and development |
30 | — | 30 | — | — | — | |||||||||||||
Total |
$ | 12,813 | $ | (10,099 | ) | $ | 2,714 | $ | 11,072 | $ | (6,744 | ) | $ | 4,328 | |||||
Amortization expense related to purchased intangible assets was approximately $3.0 million, $3.9 million, and $1.9 million in fiscal 2011, 2010, and 2009, respectively. In addition, $150,000 of in-process technology purchased from Connect3 was expensed immediately upon acquisition in February 2009.
At February 28, 2011, the estimated amortization expense related to purchased intangible assets for each of the next four fiscal years (remaining useful lives) is as follows (in thousands):
Fiscal Year
|
February 28, 2011 |
|||
|---|---|---|---|---|
2012 |
$ | 1,670 | ||
2013 |
585 | |||
2014 |
305 | |||
2015 |
154 | |||
Total |
$ | 2,714 | ||
4. Balance Sheet Components
Marketable Securities
Marketable securities consisted of the following (in thousands):
| |
February 28, 2011 | February 28, 2010 | |||||||||||||||||||||||
|---|---|---|---|---|---|---|---|---|---|---|---|---|---|---|---|---|---|---|---|---|---|---|---|---|---|
| |
|
Unrecognized | |
|
Unrecognized | |
|||||||||||||||||||
| |
Cost | Gain | Loss | Fair Value | Cost | Gain | Loss | Fair Value | |||||||||||||||||
Commercial paper |
$ | 1,800 | $ | — | $ | — | $ | 1,800 | $ | 3,999 | $ | 3 | $ | — | $ | 4,002 | |||||||||
Certificate of deposit |
— | — | — | — | 1,000 | 3 | — | 1,003 | |||||||||||||||||
Corporate bonds |
13,904 | 30 | (2 | ) | 13,932 | 15,563 | 14 | (10 | ) | 15,567 | |||||||||||||||
Obligations of government-sponsored enterprises |
30,693 | 13 | (2 | ) | 30,704 | 25,387 | 19 | — | 25,406 | ||||||||||||||||
|
$ | 46,397 | $ | 43 | $ | (4 | ) | $ | 46,436 | $ | 45,949 | $ | 39 | $ | (10 | ) | $ | 45,978 | |||||||
79
DemandTec, Inc.
Notes to Consolidated Financial Statements (Continued)
4. Balance Sheet Components (Continued)
The following table summarizes the book value of our investments in marketable debt securities classified by the contractual maturity date of the security as of the dates indicated (in thousands):
| |
February 28, | ||||||
|---|---|---|---|---|---|---|---|
| |
2011 | 2010 | |||||
Due within one year |
$ | 40,834 | $ | 36,068 | |||
Due within one to two years |
5,563 | 9,881 | |||||
|
$ | 46,397 | $ | 45,949 | |||
We classify all investments as held-to-maturity and, accordingly, record them on our balance sheet at amortized cost. We monitor our investments for impairment on a periodic basis and record an impairment charge if the carrying value of an investment exceeds its fair value and the decline in value is determined to be other-than-temporary. For the purposes of this impairment evaluation, we determine fair value based on the quoted market rate for the instrument or similar instruments. We have the ability and intent to hold our marketable securities to maturity and do not believe any of the marketable securities were impaired based on our evaluation of available evidence at current balance sheet date and through the time of filing of this annual report on Form 10-K. We expect to receive all principal and interest on all of our investment securities.
Property, Equipment and Leasehold Improvements
Property, equipment and leasehold improvements consisted of the following (in thousands):
| |
February 28, | ||||||
|---|---|---|---|---|---|---|---|
| |
2011 | 2010 | |||||
Computers, software and equipment |
$ | 17,285 | $ | 12,791 | |||
Furniture and fixtures |
183 | 172 | |||||
Leasehold improvements |
827 | 753 | |||||
|
18,295 | 13,716 | |||||
Less: accumulated depreciation |
(11,739 | ) | (8,939 | ) | |||
Property, equipment and leasehold improvements, net |
$ | 6,556 | $ | 4,777 | |||
Accounts Payable and Accrued Expenses
Accounts payable and accrued expenses consisted of the following (in thousands):
| |
February 28, | ||||||
|---|---|---|---|---|---|---|---|
| |
2011 | 2010 | |||||
Accounts payable |
$ | 3,528 | $ | 2,751 | |||
Accrued professional services |
824 | 807 | |||||
Income taxes payable |
45 | 32 | |||||
Other accrued liabilities |
1,730 | 2,368 | |||||
Accrued bonuses |
3,054 | 3,820 | |||||
Other accrued compensation |
3,903 | 3,097 | |||||
Total accounts payable and accrued expenses |
$ | 13,084 | $ | 12,875 | |||
80
DemandTec, Inc.
Notes to Consolidated Financial Statements (Continued)
5. Commitments and Contingencies
We lease office space in various locations throughout the United States and Europe. In September 2009, we entered into a lease agreement for office space in San Mateo, California, under which the total lease term is eight years with an initial non-cancellable lease term of five years commencing December 1, 2009. We use the office space as our corporate headquarters. The aggregate minimum lease commitment is approximately $10.1 million at the inception of the lease. To secure our obligations under the lease, we have provided the lessor a $223,000 cash security deposit and a $917,000 letter of credit, secured by using our existing revolving line of credit as described in Note 6. Additionally, the lessor provided us with a tenant improvement allowance of $265,000 and assumed our payment obligations (equal to approximately $200,000) under the previous sublease for our then-existing corporate headquarters in San Carlos, California for the period from December 1, 2009 through February 28, 2010, the expiration date of such sublease. The tenant improvement allowance and the $200,000 of assumed sublease obligations have been deferred and are being recognized on a straight-line basis over the lease term as reductions of rent expenses. The leasehold improvements are being amortized on a straight-line basis over the lesser of the lease term or the estimated useful lives of the assets.
In fiscal 2010 and 2011, we entered into equipment and facility operating leases associated with our data center in Mesa, Arizona. The aggregate minimum lease payments are approximately $2.6 million.
Future minimum lease commitments due under non-cancelable operating leases with an initial term greater than one year were as follows (in thousands):
Fiscal Year
|
February 28, 2011 |
|||
|---|---|---|---|---|
2012 |
$ | 3,043 | ||
2013 |
2,733 | |||
2014 |
2,499 | |||
2015 |
2,297 | |||
2016 and thereafter |
81 | |||
Total |
$ | 10,653 | ||
Total rent expense was $4.1 million, $2.2 million, and $1.9 million for fiscal 2011, 2010, and 2009, respectively.
Legal Proceedings
We have from time to time become involved in legal matters that arise in the normal course of business and otherwise. There can be no assurance that third party claims and litigation that may arise in the future will not have a material adverse effect on our business, financial position, results of operations, or cash flows, including a loss of customers, or subject us to significant financial or other remedies.
6. Debt
In May 2009, we amended our revolving line of credit that we had entered in April 2008 with a financial institution to, among other things, extend the maturity date of the loan agreement and to increase the revolving line of credit from $15.0 million to $20.0 million. The amended revolving line of credit can be used to (a) borrow, (b) issue letters of credit, and (c) enter into foreign exchange contracts. Revolving loans may be borrowed, repaid, and reborrowed until May 2012. Amounts borrowed will bear interest, at
81
DemandTec, Inc.
Notes to Consolidated Financial Statements (Continued)
6. Debt (Continued)
our option at the time of borrowing, at either (1) a floating per annum rate equal to the financial institution's prime rate, or (2) the greater of (A) the LIBOR rate plus 250 basis points or (B) a per annum rate equal to 4.0%. A default interest rate shall apply during an event of default at a rate per annum equal to 500 basis points above the otherwise applicable interest rate. The line of credit is collateralized by substantially all of our assets and requires us to comply with working capital, net worth, and other non-financial covenants, including limitations on indebtedness and restrictions on dividend distributions, among others. The available balance was approximately $19.1 million as of February 28, 2011, having been reduced by approximately $917,000 in September 2009 to secure an operating lease commitment. Through the filing of this Annual Report on Form 10-K, we were in compliance with all loan covenants.
7. Share-Based Compensation
Equity Incentive Plans
1999 Equity Incentive Plan
In December 1999, our Board of Directors adopted the 1999 Equity Incentive Plan (the "1999 Plan"). The 1999 Plan provided for incentive or nonstatutory stock options, stock bonuses, and rights to acquire restricted stock to be granted to employees, outside directors, and consultants. We ceased issuing awards under the 1999 Plan upon the completion of our Initial Public Offering ("IPO") in August 2007. As of February 28, 2011, options to purchase 3,247,261 shares were outstanding under the 1999 Plan. Such options are exercisable as specified in each option agreement, generally vest over four years, and expire no more than ten years from the date of grant. If options awarded under the 1999 Plan are forfeited or repurchased, then shares underlying those options will no longer be available for awards.
2007 Equity Incentive Plan
In May 2007, our Board of Directors adopted, and in July 2007 our stockholders approved, the 2007 Equity Incentive Plan (the "2007 Plan"). The 2007 Plan became effective upon our IPO. The 2007 Plan, which is administered by the Compensation Committee of our Board of Directors, provides for stock options, stock units, restricted shares, and stock appreciation rights to be granted to employees, outside directors and consultants. We initially reserved 3.0 million shares of our common stock for issuance under the 2007 Plan. In addition, on the first day of each fiscal year commencing with fiscal year 2009, the aggregate number of shares reserved for issuance under the 2007 Plan is automatically increased by a number equal to the lowest of a) 5% of the total number of shares of common stock then outstanding, b) 3,750,000 shares, or c) a number determined by our Board of Directors. As of February 28, 2011, 7,202,390 shares were reserved for issuance under the 2007 Plan. An additional 1,589,120 shares were reserved for issuance under the 2007 Plan on March 1, 2011.
Stock Options
Options granted under the 2007 Plan may be either incentive stock options or nonstatutory stock options and are exercisable as determined by the Compensation Committee and as specified in each option agreement. Options vest over a period of time as determined by the Compensation Committee, generally four years, and generally expire seven years (but in any event no more than ten years) from the date of grant. The exercise price of any stock option granted under the 2007 Plan may not be less than the fair market value of our common stock on the date of grant. The term of the 2007 Plan is ten years. As of February 28, 2011, options to purchase 3,404,053 shares were outstanding under the 2007 Plan.
82
DemandTec, Inc.
Notes to Consolidated Financial Statements (Continued)
7. Share-Based Compensation (Continued)
Performance Stock Units ("PSUs")
PSUs are awards under the 2007 Plan that entitle the recipient to receive shares of our common stock upon vesting and settlement of the awards pursuant to certain performance and time-based vesting criteria set by our Compensation Committee.
In May and June 2009, our Compensation Committee granted 901,000 and 25,000 PSUs, respectively, to certain of our executive officers and other employees. These PSU grants related to fiscal 2010 company performance objectives and subsequent individual service requirements over a period of approximately 23 months, subject to each grantee's continued service. In May 2010, our Compensation Committee granted 314,250 PSUs to our executive officers, which relate to fiscal 2011 company performance objectives and subsequent individual service requirements over a period of approximately 17 months, subject to each grantee's continued service. As of February 28, 2011, there were approximately 482,738 shares subject to outstanding PSUs from these grants.
In April 2011, our Compensation Committee granted 839,800 PSUs to certain of our executive officers and other employees. These PSU grants relate to fiscal 2012 company performance objectives and subsequent individual service requirements over a period of approximately 33 months. Additionally, our Compensation Committee granted 159,375 PSUs to certain of our executive officers, which relate to fiscal 2012 company performance objectives and subsequent service requirements over a period of approximately 17 months.
Restricted Stock Units ("RSUs")
RSUs are awards under the 2007 Plan that entitle the recipient to receive shares of our common stock upon vesting and settlement of the awards pursuant to time-based vesting criteria set by our Compensation Committee.
In the quarter ended May 31, 2008, our Compensation Committee granted 545,900 RSUs to our executive officers and certain other employees. During fiscal 2011, 459,450 of those RSUs vested, which represented all remaining outstanding RSUs from this grant. In connection with the vesting and settlement of these RSUs, we withheld 148,523 shares of our common stock in settlement of employee income and payroll tax withholding obligations and paid the corresponding amounts in cash, approximately $937,000, to the appropriate federal and state taxing authorities.
In January 2010, our Compensation Committee granted 100,000 RSUs that vest over a period of approximately four years, subject to the grantee's continued services. In fiscal 2011, our Compensation Committee granted 1,322,000 RSUs to certain of our executive officers, other employees, and consultants. Such RSUs will vest over a period of approximately 24 to 27 months, subject to each grantee's continued service. In August 2010, our Compensation Committee granted a total of 79,317 RSUs to the non-employee members of our board of directors, which will be fully vested on the earlier of a) the date of our 2011 Annual Meeting of Stockholders, or b) one year from the date of grant. As of February 28, 2011, there were approximately 1,365,817 shares subject to outstanding RSUs from these grants. In April 2011, our Compensation Committee granted 98,750 RSUs to certain employees. These RSUs will vest over a period of approximately 27 months, subject to each grantee's continued service.
83
DemandTec, Inc.
Notes to Consolidated Financial Statements (Continued)
7. Share-Based Compensation (Continued)
A summary of stock-based awards activity during fiscal 2011, 2010, and 2009 follows (shares in thousands):
| |
Shares Available for Grant |
Shares Subject to Options Outstanding |
Weighted Average Option Exercise Price per Share |
||||||||
|---|---|---|---|---|---|---|---|---|---|---|---|
| |
(Shares in thousands) |
||||||||||
Balance at February 29, 2008 |
1,480 | 7,409 | $ | 3.80 | |||||||
Additional shares authorized |
1,324 | — | — | ||||||||
Options granted |
(1,819 | ) | 1,819 | 8.94 | |||||||
Performance stock units granted |
(160 | ) | — | — | |||||||
Restricted stock units granted |
(546 | ) | — | — | |||||||
Options exercised |
— | (1,188 | ) | 1.42 | |||||||
1999 Plan options cancelled/forfeited(1) |
— | (180 | ) | 5.37 | |||||||
2007 Plan options cancelled/forfeited |
128 | (128 | ) | 12.03 | |||||||
Performance and restricted stock units cancelled/forfeited |
197 | — | — | ||||||||
Shares repurchased(1) |
4 | — | — | ||||||||
Options expired(1) |
(4 | ) | — | — | |||||||
Balance at February 28, 2009 |
604 | 7,732 | $ | 5.20 | |||||||
Additional shares authorized |
1,403 | — | — | ||||||||
Options granted |
(664 | ) | 664 | 8.23 | |||||||
Performance stock units granted |
(926 | ) | — | — | |||||||
Restricted stock units granted |
(100 | ) | — | — | |||||||
Options exercised |
— | (823 | ) | 1.71 | |||||||
1999 Plan options cancelled/forfeited(1) |
— | (105 | ) | 6.89 | |||||||
2007 Plan options cancelled/forfeited |
220 | (220 | ) | 9.52 | |||||||
PSUs and RSUs cancelled/forfeited |
822 | — | — | ||||||||
Balance at February 28, 2010 |
1,359 | 7,248 | $ | 5.72 | |||||||
Additional shares authorized |
1,475 | — | — | ||||||||
Options granted |
(1,570 | ) | 1,570 | 8.34 | |||||||
PSUs granted |
(314 | ) | — | — | |||||||
RSUs granted |
(1,401 | ) | — | — | |||||||
Options exercised |
— | (1,515 | ) | 3.32 | |||||||
1999 Plan options cancelled/forfeited(1) |
— | (54 | ) | 9.37 | |||||||
2007 Plan options cancelled/forfeited |
598 | (598 | ) | 8.96 | |||||||
PSUs and RSUs cancelled/forfeited |
166 | — | — | ||||||||
Balance at February 28, 2011 |
313 | 6,651 | $ | 6.56 | |||||||
- (1)
- Under the terms of the 1999 Plan, shares underlying cancelled, forfeited, or repurchased options are no longer available for awards.
84
DemandTec, Inc.
Notes to Consolidated Financial Statements (Continued)
7. Share-Based Compensation (Continued)
A summary of PSU activity during fiscal 2011, 2010 and 2009 follows (in thousands):
| |
Shares Subject to PSUs Outstanding |
||||
|---|---|---|---|---|---|
Balance at February 29, 2008 |
913 | ||||
Granted |
160 | ||||
Released |
(244 | ) | |||
Cancelled/forfeited |
(389 | ) | |||
Balance at February 28, 2009 |
440 | ||||
Granted |
926 | ||||
Released |
(434 | ) | |||
Cancelled/forfeited |
(545 | ) | |||
Balance at February 28, 2010 |
387 | ||||
Granted |
314 | ||||
Released |
(188 | ) | |||
Cancelled/forfeited |
(30 | ) | |||
Balance at February 28, 2011 |
483 | ||||
A summary of RSU activity during fiscal 2011, 2010 and 2009 follows (in thousands):
| |
Shares Subject to RSUs Outstanding |
||||
|---|---|---|---|---|---|
Balance at February 29, 2008 |
— | ||||
Granted |
546 | ||||
Cancelled/forfeited |
(44 | ) | |||
Balance at February 28, 2009 |
502 | ||||
Granted |
100 | ||||
Cancelled/forfeited |
(42 | ) | |||
Balance at February 28, 2010 |
560 | ||||
Granted |
1,401 | ||||
Released |
(459 | ) | |||
Cancelled/forfeited |
(136 | ) | |||
Balance at February 28, 2011 |
1,366 | ||||
85
DemandTec, Inc.
Notes to Consolidated Financial Statements (Continued)
7. Share-Based Compensation (Continued)
The following table summarizes information concerning options outstanding at February 28, 2011:
| |
Options Outstanding | Options Exercisable | ||||||||||||||
|---|---|---|---|---|---|---|---|---|---|---|---|---|---|---|---|---|
Range of Exercise Prices
|
Number of Shares Subject to Options |
Weighted Average Remaining Contractual Term |
Weighted Average Exercise Price per Shares |
Number of Shares Subject to Options |
Weighted Average Exercise Price Per Share |
|||||||||||
| |
(In thousands) |
(In years) |
|
(In thousands) |
|
|||||||||||
$0.50 - $1.30 |
898 | 3.22 | $ | 1.22 | 898 | $ | 1.22 | |||||||||
$1.50 - $3.80 |
1,550 | 5.13 | 2.93 | 1,550 | 2.93 | |||||||||||
$5.40 - $8.74 |
1,991 | 5.63 | 6.94 | 921 | 6.98 | |||||||||||
$8.77 - $11.00 |
1,701 | 5.08 | 10.07 | 1,116 | 10.12 | |||||||||||
$11.15 - $19.67 |
511 | 5.95 | 13.81 | 121 | 17.45 | |||||||||||
|
6,651 | 5.07 | $ | 6.56 | 4,606 | $ | 5.53 | |||||||||
At February 28, 2011, the aggregate intrinsic value of currently exercisable options was approximately $35.0 million and the weighted average remaining contractual term of those options was approximately 4.7 years. The aggregate intrinsic value was calculated as the difference between the exercise price of the underlying stock option awards and the closing market value of our common stock on February 28, 2011 of $13.01 per share.
The following table summarizes information concerning vested and expected to vest options outstanding (dollars in thousands, except per share amounts):
| |
February 28, 2011 |
|||
|---|---|---|---|---|
Number of vested and expected-to-vest options outstanding |
6,459 | |||
Weighted average exercise price per share |
$ | 6.49 | ||
Aggregate intrinsic value |
$ | 42,748 | ||
Weighted average remaining contractual term (in years) |
5.0 | |||
The intrinsic value of options exercised during fiscal 2011, 2010, and 2009 was $11.3 million, $5.3 million, and $8.5 million, respectively.
Employee Stock Purchase Plan ("ESPP")
In May 2007 our Board of Directors adopted, and in July 2007 our stockholders approved, the 2007 Employee Stock Purchase Plan. We subsequently amended the ESPP in March 2010. Under the ESPP, eligible employees may purchase shares of common stock at a price per share equal to 85% of the lesser of the fair market values of our common stock at the beginning or end of the applicable offering period. The initial offering period commenced on August 8, 2007 and ended on April 15, 2008. Each subsequent offering period lasts for six months. We initially reserved 500,000 shares of our common stock for issuance under the ESPP. In addition, on the first day of each fiscal year commencing with fiscal year 2009, the aggregate number of shares reserved for issuance under the ESPP is automatically increased by a number equal to the lowest of a) 1% of the total number of shares of common stock then outstanding, b) 375,000 shares, or c) a number determined by our Board of Directors. In fiscal 2011, employees purchased 267,396 shares under the ESPP, and the weighted average per share fair value of the options to purchase those
86
DemandTec, Inc.
Notes to Consolidated Financial Statements (Continued)
7. Share-Based Compensation (Continued)
shares was approximately $1.91. As of February 28, 2011, a total of 739,947 shares were available for issuance under the ESPP.
Stock-Based Compensation Expense Associated with Awards to Employees
We have issued employee stock-based awards in the form of stock options, PSUs, RSUs, and shares subject to the ESPP. We measure the value of stock options and shares subject to the ESPP based on their grant date fair value using the Black-Scholes pricing model. Stock-based compensation expense for PSUs and RSUs granted to employees is based on the closing price of our common stock on the grant date. The aggregate fair value of the PSUs and RSUs granted to employees in fiscal 2011, 2010, and 2009 was approximately $10.8 million, $7.9 million, $7.3 million, respectively.
The determination of the fair value of stock options and shares subject to the ESPP on the date of grant is affected by our stock price, as well as by assumptions regarding a number of complex and subjective variables. These variables include our expected stock price volatility over the term of the options and awards, actual and projected employee stock option exercise behaviors, risk-free interest rates, and expected dividends, which are set forth in the table below:
| |
Weighted Average Expected Term (in years) |
Expected Stock Price Volatility |
Risk-free Interest Rate |
Expected Dividend Yield |
Weighted Average Fair Value of Awards Granted (per share) |
||||||||||||
|---|---|---|---|---|---|---|---|---|---|---|---|---|---|---|---|---|---|
Fiscal Year Ended February 28, 2011 |
|||||||||||||||||
Stock options |
4.5 | 66 | % | 2.0 | % | 0 | % | $ | 4.41 | ||||||||
ESPP |
0.5 | 44 | % | 0.2 | % | 0 | % | $ | 2.30 | ||||||||
Fiscal Year Ended February 28, 2010 |
|||||||||||||||||
Stock options |
4.4 | 64 | % | 2.1 | % | 0 | % | $ | 4.22 | ||||||||
ESPP |
0.5 | 70 | % | 0.2 | % | 0 | % | $ | 2.68 | ||||||||
Fiscal Year Ended February 28, 2009 |
|||||||||||||||||
Stock options |
4.1 | 52 | % | 2.6 | % | 0 | % | $ | 3.85 | ||||||||
ESPP |
0.5 | 57 | % | 1.5 | % | 0 | % | $ | 2.30 | ||||||||
Weighted Average Expected Term. Under the 1999 Plan, the 2007 Plan, and the ESPP, the expected term of awards granted is based on the awards' vesting terms, contractual terms and historical exercise and vesting information, as well as data from similar entities. In evaluating similarity, we considered factors such as industry, stage of lifecycle, size, employee demographics and the nature of stock option plans. We believe that, with this information taken together, we have been able to develop reasonable expectations about future exercise patterns and post-vesting employment termination behavior.
Volatility. Since we were a private entity until August 2007 and have insufficient historical data regarding the volatility of our common stock price, the expected volatility used in fiscal 2010 and 2009 was based on the volatility of stock prices for similar entities. In fiscal 2011, the expected volatility was based on our historical common stock trading price.
Risk-Free Interest Rate. The risk-free interest rate is based on U.S. Treasury zero-coupon issues with remaining terms similar to the expected terms of the awards.
87
DemandTec, Inc.
Notes to Consolidated Financial Statements (Continued)
7. Share-Based Compensation (Continued)
Dividend Yield. We have never declared or paid any cash dividends and do not plan to pay cash dividends in the foreseeable future, and therefore we used an expected dividend yield of zero in the valuation model.
Forfeitures. We estimate forfeitures at the time of grant, and revise those estimates in subsequent periods if actual forfeitures differ from those estimates. We use historical data to estimate pre-vesting forfeitures and record stock-based compensation expense only for those awards that are expected to vest. We believe that we have been able to develop reasonable expectations about future forfeiture patterns. If our actual forfeiture rate is materially different from our estimate, the stock-based compensation expense could be significantly different from what we have recorded in the current period.
We amortize the fair value of the awards granted, net of estimated forfeitures, as stock-based compensation expense on a straight-line basis over the vesting period. We estimate forfeitures for our stock options, PSUs, and RSUs at the time of grant. At the end of each reporting period, we evaluate the probability of the service condition being met and revise those estimates based on actual results, taking into account cancellations related to terminations, as applicable to each award. In addition, for PSUs granted, we evaluate the probability of meeting the performance criteria at the end of each reporting period to determine how much compensation expense to record. The estimation of whether the performance targets and service periods will be achieved requires judgment. To the extent actual results or updated estimates differ from our current estimates, either (a) the cumulative effect on current and prior periods of those changes will be recorded in the period those estimates are revised or (b) the change in estimate will be applied prospectively, depending on whether the change affects the estimate of total stock-based compensation expense to be recognized or merely affects the period over which such expense will be recognized. In fiscal 2010 and 2009, we recorded cumulative effect adjustments that resulted in a decrease to stock-based compensation expense of approximately $601,000 and $1.4 million, respectively. The cumulative adjustment in fiscal 2011 was not material.
Stock-Based Compensation for Non-Employees
Stock-based compensation expense related to stock awards granted to non-employees is recognized as the awards vest. We believe that the fair value of the stock-based awards granted is more reliably measurable than the fair value of the services received. The fair value of the stock options granted is calculated using the Black-Scholes option pricing model. The fair value of RSUs granted is based on the closing price of our common stock on each reporting date. The fair value of the award is remeasured at each reporting date until the earlier of (a) the performance commitment date or (b) the date the services required under the arrangement have been completed. Stock-based compensation expense related to awards granted to non-employees for fiscal 2011 was approximately $168,000, and the expenses for fiscal 2010 and 2009 were not material.
88
DemandTec, Inc.
Notes to Consolidated Financial Statements (Continued)
7. Share-Based Compensation (Continued)
The fair values of unvested options granted to non-employees were calculated using the following assumptions for the periods presented:
| |
Year Ended February 28, | |||||||||
|---|---|---|---|---|---|---|---|---|---|---|
| |
2011 | 2010 | 2009 | |||||||
Weighted average expected term (in years) |
6.0 | 7.0 | 7.9 | |||||||
Expected stock price volatility |
66 | % | 61 | % | 58 | % | ||||
Risk-free interest rate |
3.1 | % | 3.1 | % | 3.7 | % | ||||
Expected dividend yield |
0 | % | 0 | % | 0 | % | ||||
The following table sets forth the stock-based compensation expense for equity awards recorded in the consolidated statements of operations for the periods presented (in thousands):
| |
Year Ended February 28, | |||||||||
|---|---|---|---|---|---|---|---|---|---|---|
| |
2011 | 2010 | 2009 | |||||||
Cost of revenue |
$ | 1,776 | $ | 1,732 | $ | 1,712 | ||||
Research and development |
3,422 | 3,309 | 2,261 | |||||||
Sales and marketing |
2,744 | 2,411 | 2,263 | |||||||
General and administrative |
2,424 | 2,267 | 1,743 | |||||||
Total stock-based compensation expense |
$ | 10,366 | $ | 9,719 | $ | 7,979 | ||||
The following table summarizes gross unrecognized stock-based compensation expense at February 28, 2011, excluding estimated forfeitures:
| |
Unrecognized Stock-Based Compensation Expense |
Remaining Weighted Average Recognition Period |
|||||
|---|---|---|---|---|---|---|---|
| |
(In millions) |
(In years) |
|||||
Stock options |
$ | 10,431 | 2.8 | ||||
PSUs |
596 | 0.3 | |||||
RSUs |
6,849 | 1.4 | |||||
ESPP |
109 | 0.1 | |||||
|
$ | 17,985 | 2.2 | ||||
89
DemandTec, Inc.
Notes to Consolidated Financial Statements (Continued)
7. Share-Based Compensation (Continued)
Shares of Common Stock Reserved for Future Issuance
We are required to reserve and keep available out of our authorized but unissued shares of common stock a number of shares sufficient to permit the exercise of options and settlement of restricted or performance stock units granted under our 1999 Plan and our 2007 Plan, as well as shares available for grant under our 2007 Plan and our ESPP. At February 28, 2011, common stock was reserved for issuance as follows (in thousands):
| |
February 28, 2011 |
|||
|---|---|---|---|---|
Equity plans: |
||||
Outstanding stock options, PSUs and RSUs |
8,500 | |||
Reserved for future grants |
1,053 | |||
Total |
9,553 | |||
8. Income Taxes
The provision (benefit) for income taxes consisted of the following (in thousands):
| |
Year Ended February 28, | |||||||||
|---|---|---|---|---|---|---|---|---|---|---|
| |
2011 | 2010 | 2009 | |||||||
Current: |
||||||||||
Federal |
$ | 136 | $ | (219 | ) | $ | (154 | ) | ||
State |
15 | 17 | 54 | |||||||
Foreign |
115 | 54 | 53 | |||||||
Total current |
265 | (148 | ) | (47 | ) | |||||
Total provision (benefit) for income taxes |
$ | 265 | $ | (148 | ) | $ | (47 | ) | ||
The provision (benefit) for income taxes for fiscal 2011 includes state and foreign income taxes as well as adjustments to provisional 2010 federal income tax expense. Included in the federal tax provision for each of fiscal 2010 and 2009 is a benefit of approximately $83,000, which resulted from the enactment of the Housing Assistance Act of 2008 and the American Recovery and Reinvestment Act of 2009. Under these acts, corporations otherwise eligible for first-year bonus deprecation could instead elect to claim a refund of certain tax credits generated prior to 2006. We also recorded a federal income tax benefit of $135,000 for the expected recovery of federal alternative minimum taxes paid in fiscal 2008, 2007, and 2006, as a result of the enactment of the Worker, Homeownership, and Business Assistance Act of 2009, which was enacted in November 2009.
90
DemandTec, Inc.
Notes to Consolidated Financial Statements (Continued)
8. Income Taxes (Continued)
Our effective tax rate differs from the amount computed by applying the statutory federal income tax rate to net loss before income tax as follows:
| |
Year Ended February 28, | |||||||||
|---|---|---|---|---|---|---|---|---|---|---|
| |
2011 | 2010 | 2009 | |||||||
Federal income tax benefit at statutory rate |
(34.0 | )% | (34.0 | )% | (34.0 | )% | ||||
Net operating losses not benefitted |
33.8 | 30.6 | 25.4 | |||||||
State tax |
0.1 | 0.1 | 1.1 | |||||||
Non-deductible stock compensation expense |
0.1 | 2.7 | 6.0 | |||||||
Non-deductible expenses |
0.1 | 0.8 | 1.6 | |||||||
Foreign income tax |
0.9 | 0.4 | 1.1 | |||||||
Other |
1.0 | (1.8 | ) | (2.2 | ) | |||||
|
2.0 | % | (1.2 | )% | (1.0 | )% | ||||
Deferred income taxes reflect the tax effects of temporary differences between the carrying amounts of assets and liabilities for financial reporting purposes and the amounts used for income tax purposes. Significant components of our deferred tax assets and liabilities are as follows (in thousands):
| |
February 28, | |||||||
|---|---|---|---|---|---|---|---|---|
| |
2011 | 2010 | ||||||
Current deferred tax assets: |
||||||||
Differences in timing of revenue recognition |
$ | 249 | $ | 758 | ||||
Stock-based compensation |
1,114 | 988 | ||||||
Accruals and allowances |
2,551 | 2,473 | ||||||
Valuation allowance |
(3,859 | ) | (4,019 | ) | ||||
Total current deferred tax assets |
55 | 200 | ||||||
Non-current deferred tax assets: |
||||||||
Net operating loss carryforwards |
24,847 | 21,243 | ||||||
Research and development credits |
6,225 | 5,176 | ||||||
Stock-based compensation |
4,456 | 3,952 | ||||||
Depreciating and amortizing assets |
1,135 | 926 | ||||||
Valuation allowance |
(36,147 | ) | (29,763 | ) | ||||
Total non-current deferred tax assets |
516 | 1,534 | ||||||
Non-current deferred tax liabilities: |
||||||||
Acquired intangible assets |
(571 | ) | (1,734 | ) | ||||
Net deferred tax assets (liabilities) |
$ | — | $ | — | ||||
Realization of the deferred tax assets is dependent upon future earnings, if any, the amount and timing of which are uncertain. Accordingly, substantially all of our net deferred tax assets have been offset by a valuation allowance. The valuation allowance increased by approximately $6.2 million, $4.7 million, and $1.3 million during fiscal 2011, 2010, and 2009, respectively.
At February 28, 2011, we had cumulative federal net operating loss carryforwards of approximately $87.8 million. We also had federal research and development tax credit carryforwards of approximately
91
DemandTec, Inc.
Notes to Consolidated Financial Statements (Continued)
8. Income Taxes (Continued)
$5.9 million. The net operating loss will expire at various dates beginning in 2021 and tax credit carryforwards will expire at various dates beginning in 2022. The net operating loss carryforwards include $21.7 million for stock option deductions which will be credited to additional paid in capital when realized.
At February 28, 2011, we had cumulative California and other states net operating loss carryforwards of approximately $48.3 million and $15.3 million, respectively. The state net operating loss carryforwards will expire at various dates beginning in 2011 if not utilized. We also had California research and development tax credit carryforwards of approximately $5.7 million that will carry forward indefinitely if not utilized. The state net operating loss carryforwards include $23.2 million for stock option deductions which will be credited to additional paid-in capital when realized.
We are tracking the portion of our deferred tax assets attributable to stock option benefits in a separate memo account in accordance with accounting standards. Therefore, these amounts are no longer included in our gross or net deferred tax assets. The stock option benefits of approximately $8.5 million will only be recorded to additional paid-in capital when they reduce taxes payable.
Utilization of the net operating loss carryforwards and research and development tax credit carryforwards may be subject to annual limitations due to the ownership change limitations provided by the Internal Revenue Code and similar state provisions. The annual limitation may result in the expiration of net operating losses and credits before utilization.
Uncertain Tax Positions
A reconciliation of the beginning and ending amounts of unrecognized income tax benefits during the year is as follows (in thousands):
| |
Year Ended February 28, | |||||||||
|---|---|---|---|---|---|---|---|---|---|---|
| |
2011 | 2010 | 2009 | |||||||
Balance as of beginning of fiscal year |
$ | 4,322 | $ | 3,606 | $ | 3,033 | ||||
Additions for tax positions in the current fiscal year |
828 | 761 | 814 | |||||||
Reductions for tax positions in prior fiscal years |
(117 | ) | (45 | ) | (240 | ) | ||||
Balance as of end of fiscal year |
$ | 5,033 | $ | 4,322 | $ | 3,607 | ||||
None of the unrecognized tax benefits, if recognized, would impact our effective tax rate, as the benefit would be offset by an increase in the valuation allowance.
We recognize interest and penalties related to uncertain tax positions in income tax expense. The total amount of interest and penalties recognized in each statement of operations and in each statement of financial position presented is insignificant. It is possible that the amount of unrecognized tax benefits will change in the next twelve months; however, an estimate of the range of the possible change cannot be made at this time.
We file U.S and state income tax returns with varying statutes of limitations. The tax years from 2000 and thereafter remain open to examination due to the carryover of unused federal and state net operating losses or tax credits. We also file various foreign income tax returns with varying statutes of limitation, and the tax years from 2007 and thereafter remain open to examination.
92
DemandTec, Inc.
Notes to Consolidated Financial Statements (Continued)
9. Derivative Financial Instruments
We maintain a foreign currency risk management strategy that includes the use of derivative financial instruments designed to protect our economic value from the possible adverse effects of currency fluctuations. We do not enter into derivative financial instruments for speculative or trading purposes. Our hedging relationships are formally documented at the inception of the hedge, and hedges must be highly effective in offsetting changes to future cash flows on hedged transactions both at the inception of a hedge and on an ongoing basis. We record the ineffective portion of hedging instruments, if any, to other income (expense) in the consolidated statements of operations.
At February 28, 2011, we had two outstanding forward contracts with a total notional principal of approximately $2.5 million, which are summarized as follows (in thousands):
| |
Notional Principal (Local Currency) |
Notional Principal (USD) |
Fair Value (USD) |
Accumulated Amortized Implicit Interest (USD) |
|||||||||
|---|---|---|---|---|---|---|---|---|---|---|---|---|---|
Euro—maturing in December 2011 and 2012(1) |
€ | 1,851 | $ | 2,496 | $ | (33 | ) | $ | 2 | ||||
- (1)
- Related to a three-year customer arrangement, under which we separately hedge each equal annual billing amount. The forward contract related to the first annual billing amount matured in December 2010 and the remaining two mature in December 2011 and 2012, respectively.
We designated these forward contracts as cash flow hedges of foreign currency denominated firm commitments. Our objective in purchasing these forward contracts was to negate the impact of currency exchange rate movements on our operating results. We record effective spot-to-spot changes in these cash flow hedges in accumulated other comprehensive income until the hedged transaction takes place. Combined implied interest on all forward contracts was excluded from effectiveness testing and is being recorded using the straight-line method over the terms of the forward contracts to interest expense and accumulated other comprehensive income. We did not incur any hedge ineffectiveness during fiscal 2011, 2010 and 2009.
| |
|
Amount of Gain Recognized In Income |
||||||||||
|---|---|---|---|---|---|---|---|---|---|---|---|---|
| |
|
Year Ended February 28, |
||||||||||
Derivatives Designated as Hedging Instruments
|
Location | 2011 | 2010 | 2009 | ||||||||
Forward contracts |
Revenue | $ | 357 | $ | 101 | $ | — | |||||
We expect to reclassify approximately $151,000, $15,000 and $12,000 from accumulated other comprehensive income ratably into revenue in fiscal 2012, 2013 and 2014, respectively. These unrealized gains are associated with forward contracts that matured in February 2011, December 2010, May 2010 and May 2009.
10. Fair Value Measurements
Effective March 1, 2008, we adopted new accounting standards for fair value measurements, which clarify that fair value is an exit price, representing the amount that would be received to sell an asset or
93
DemandTec, Inc.
Notes to Consolidated Financial Statements (Continued)
10. Fair Value Measurements (Continued)
paid to transfer a liability in an orderly transaction between market participants. As such, fair value is a market-based measurement that should be determined based on assumptions that market participants would use in pricing an asset or a liability. As a basis for considering such assumptions, the new accounting standards establish a three-tier value hierarchy, which prioritizes the inputs used in the valuation methodologies in measuring fair value:
Level 1—Observable inputs that reflect quoted prices (unadjusted) for identical assets or liabilities in active markets.
Level 2—Include other inputs that are directly or indirectly observable in the marketplace.
Level 3—Unobservable inputs which are supported by little or no market activity.
The fair value hierarchy requires an entity to maximize the use of observable inputs and minimize the use of unobservable inputs when measuring fair value.
We measure our foreign currency forward contracts at fair value using Level 2 inputs, as the valuation inputs are based on quoted prices of similar instruments in active markets and do not involve management judgment.
The following table summarizes the amounts measured at fair value (in thousands):
| |
Total | Significant Other Observable Inputs (Level 2) |
||||||
|---|---|---|---|---|---|---|---|---|
February 28, 2011 |
||||||||
Liabilities: |
||||||||
Foreign currency forward contracts(1) |
$ | 33 | $ | 33 | ||||
February 28, 2010 |
||||||||
Assets: |
||||||||
Foreign currency forward contracts(1) |
$ | 308 | $ | 308 | ||||
- (1)
- At February 28, 2011, $24 was included in other current liabilities and $9 was included in other long-term liabilities on our consolidated balance sheet. At February 28, 2010, $308 was included in prepaid expenses and current assets on our consolidated balance sheet.
11. Restructuring Charges
In fiscal 2010, we recorded approximately $775,000 of expenses associated with the reduction of our workforce as a result of synergies gained through the acquisition of Connect3, and the consolidation and relocation of our corporate headquarters. Expenses associated with these actions were primarily for severance payments, outplacement services, moving costs, and approximately $402,000 of remaining operating lease obligations. All severance payments were made prior to February 28, 2010.
12. Employee Savings and Retirement Plan
We have a 401(k) plan that allows eligible employees to contribute up to 15% of their total compensation, subject to annual limits. Under the plan, eligible employees may defer a portion of their pretax salaries, but not more than statutory limits. In fiscal 2011, 2010, and 2009, we made approximately
94
DemandTec, Inc.
Notes to Consolidated Financial Statements (Continued)
12. Employee Savings and Retirement Plan (Continued)
$445,000, $428,000, and $365,000, respectively, of discretionary matching contributions to the plan. No discretionary matching contributions were made prior to fiscal 2009.
13. Selected Quarterly Financial Data (Unaudited)
The following table sets forth our selected unaudited quarterly consolidated statements of operations data for the eight most recent quarters:
| |
For the Three Months Ended | ||||||||||||||||||||||||
|---|---|---|---|---|---|---|---|---|---|---|---|---|---|---|---|---|---|---|---|---|---|---|---|---|---|
| |
May 31, 2009 |
Aug. 31, 2009 |
Nov. 30, 2009 |
Feb. 28, 2010 |
May 31, 2010 |
Aug. 31, 2010 |
Nov. 30, 2010 |
Feb. 28, 2011(1) |
|||||||||||||||||
| |
(In thousands, except per share data) |
||||||||||||||||||||||||
Revenue |
$ | 19,545 | $ | 19,796 | $ | 20,088 | $ | 19,623 | $ | 18,045 | $ | 20,388 | $ | 21,670 | $ | 22,315 | |||||||||
Gross profit |
12,841 | 13,496 | 13,727 | 13,228 | 10,931 | 13,306 | 14,202 | 14,747 | |||||||||||||||||
Loss from operations |
(3,987 | ) | (3,289 | ) | (2,676 | ) | (2,339 | ) | (5,870 | ) | (2,849 | ) | (2,088 | ) | (2,759 | ) | |||||||||
Net loss attributable to common stockholders |
(3,722 | ) | (3,145 | ) | (2,397 | ) | (2,573 | ) | (5,867 | ) | (2,850 | ) | (2,085 | ) | (2,861 | ) | |||||||||
Net loss per common share, basic and diluted |
$ | (0.13 | ) | $ | (0.11 | ) | $ | (0.08 | ) | $ | (0.09 | ) | $ | (0.20 | ) | $ | (0.09 | ) | $ | (0.07 | ) | $ | (0.09 | ) | |
- (1)
- We acquired AIS in December 2010. See Note 2.
14. Subsequent Event
On March 11, 2011, we acquired all of the outstanding equity interests of privately-held M-Factor for approximately $9.5 million in cash, as adjusted downward for certain M-Factor expenses and liabilities to be paid by the company. M-Factor is a software-as-a-service company that provides predictive analytics software for marketing and trade investment management.
Pursuant to the merger agreement, $500,000 of the cash consideration otherwise payable at closing will be held by the Company to secure potential indemnification obligations of M-Factor investors. This holdback amount, to the extent not used to satisfy the indemnity obligations, will be released after sixteen months. We will account for the transaction as a business combination.
95
Item 9. Changes in and Disagreements with Accountants on Accounting and Financial Disclosure
None.
Item 9A. Controls and Procedures
Evaluation of Disclosure Controls and Procedures
We evaluated the effectiveness of the design and operation of our disclosure controls and procedures as of February 28, 2011, the end of the period covered by this Annual Report on Form 10-K. This evaluation (the "controls evaluation") was done under the supervision and with the participation of management, including our Chief Executive Officer ("CEO") and Chief Financial Officer ("CFO"). Disclosure controls and procedures means controls and other procedures that are designed to provide reasonable assurance that information required to be disclosed in the reports that we file or submit under the Securities and Exchange Act of 1934, as amended (the "Exchange Act"), such as this Annual Report on Form 10-K, is recorded, processed, summarized and reported within the time periods specified in the SEC's rules and forms. Disclosure controls and procedures include, without limitation, controls and procedures designed such that information is accumulated and communicated to our management, including our CEO and CFO, as appropriate to allow timely decisions regarding required disclosure. Based on the controls evaluation, our CEO and CFO have concluded that as of February 28, 2011, our disclosure controls and procedures were effective to provide reasonable assurance that information required to be disclosed in our Exchange Act reports is recorded, processed, summarized and reported within the time periods specified by the SEC and to ensure that material information relating to the Company and our consolidated subsidiaries is made known to management, including our CEO and CFO, particularly during the period when our periodic reports are being prepared.
Management's Report on Internal Control over Financial Reporting
Our management is responsible for establishing and maintaining adequate internal control over financial reporting (as defined in Exchange Act Rule 13a-15(f) under the Securities Exchange Act of 1934, as amended). Under the supervision and with the participation of our management, including our CEO and CFO, we conducted an evaluation of the effectiveness of our internal control over financial reporting as of February 28, 2011, based on the guidelines established in Internal Control—Integrated Framework issued by the Committee of Sponsoring Organizations of the Treadway Commission (COSO). Our internal control over financial reporting includes policies and procedures designed to provide reasonable assurance regarding the reliability of financial reporting and the preparation of financial statements for external reporting purposes in accordance with U.S. generally accepted accounting principles. Based on the results of our evaluation, our management has concluded that, as of February 28, 2011, our internal control over financial reporting was effective. We have reviewed the results of our evaluation with our Audit Committee.
The effectiveness of our internal control over financial reporting as of February 28, 2011 has been audited by Ernst & Young LLP, an independent registered public accounting firm, as stated in its report which is included in Item 8 of this Annual Report on Form 10-K.
Changes in Internal Control over Financial Reporting
No change in our internal control over financial reporting occurred during the three months ended February 28, 2011 that has materially affected, or is reasonably likely to materially affect, our internal control over financial reporting. Internal control over financial reporting means a process designed to provide reasonable assurance regarding the reliability of financial reporting and the preparation of financial statements for external purposes in accordance with generally accepted accounting principles.
96
Inherent Limitations on Effectiveness of Controls
Our management, including our CEO and CFO, believe that our disclosure controls and procedures and our internal control over financial reporting are effective at the reasonable assurance level. However, our management, including our CEO and CFO, do not expect that our disclosure controls and procedures or our internal control over financial reporting will prevent all errors and all fraud. A control system, no matter how well conceived and operated, can provide only reasonable, not absolute, assurance that the objectives of the control system are met. Further, the design of a control system must reflect the fact that there are resource constraints, and the benefits of controls must be considered relative to their costs. Because of the inherent limitations in all control systems, no evaluation of controls can provide absolute assurance that all control issues and instances of fraud, if any, within the company have been detected. These inherent limitations include the realities that judgments in decision-making can be faulty, and that breakdowns can occur because of simple error or mistake. Additionally, controls can be circumvented by the individual acts of some persons, by collusion of two or more people, or by management override of the controls. The design of any system of controls also is based in part upon certain assumptions about the likelihood of future events, and there can be no assurance that any design will succeed in achieving its stated goals under all potential future conditions. Over time, controls may become inadequate because of changes in conditions, or the degree of compliance with the policies or procedures may deteriorate. Because of the inherent limitations in a cost-effective control system, misstatements due to error or fraud may occur and not be detected.
None.
97
Item 10. Directors, Executive Officers and Corporate Governance
The information required by this item with respect to directors and executive officers is incorporated by reference to our Proxy Statement for our 2011 Annual Meeting of Stockholders, which is expected to be filed with the SEC within 120 days after the end of the fiscal year ended February 28, 2011 (the "2011 Proxy Statement").
We have adopted a code of business conduct applicable to our directors, officers (including our principal executive officer and principal financial officer) and employees. The Code of Business Conduct is available on our website at www.demandtec.com under the Investor Relations section.
Item 11. Executive Compensation
The information required by this item will be set forth in the 2011 Proxy Statement and is incorporated herein by reference.
Item 12. Security Ownership of Certain Beneficial Owners and Management and Related Stockholder Matters
The information required by this item will be set forth in the 2011 Proxy Statement and is incorporated herein by reference.
Item 13. Certain Relationships and Related Transactions, and Director Independence
The information required by this item will be set forth in the 2011 Proxy Statement and is incorporated herein by reference.
Item 14. Principal Accounting Fees and Services
The information required by this item will be set forth in the 2011 Proxy Statement and is incorporated herein by reference.
98
Item 15. Exhibits, Financial Statement Schedules
The following documents are filed as a part of this Report:
- (a)
- Financial Statements: See Index to Consolidated Financial Statements in Part II,
Item 8.
- (b)
- Financial Statement Schedules:
DemandTec, Inc.
Schedule II: Valuation and Qualifying Accounts
Allowance for Doubtful Accounts
Description
|
Balance at Beginning of Year |
Additions Charged to Costs and Expenses |
Write-off, Net of Recoveries |
Balance at End of Year |
|||||||||
|---|---|---|---|---|---|---|---|---|---|---|---|---|---|
Fiscal 2011 |
$ | 145,000 | $ | 485,000 | $ | 500,000 | $ | 130,000 | |||||
Fiscal 2010 |
$ | 119,801 | $ | 25,199 | $ | — | $ | 145,000 | |||||
Fiscal 2009 |
$ | 160,000 | $ | — | $ | 40,199 | $ | 119,801 | |||||
The Financial Statement Schedules not listed have been omitted because they are not applicable or are not required or the information required to be set forth herein is included in the Consolidated Financial Statements or Notes thereto.
- (c)
- Exhibits: The following exhibits are incorporated by reference herein or filed herewith:
| |
|
Incorporated by Reference | |
|||||||||||||||
|---|---|---|---|---|---|---|---|---|---|---|---|---|---|---|---|---|---|---|
| Exhibit Number |
Exhibit Description | Form | File No. | Date of First Filing |
Exhibit Number |
Filed Herewith |
||||||||||||
| 3.1 | Restated Certificate of Incorporation | S-1/A | 333-143248 | 07/20/07 | 3.2 | |||||||||||||
| 3.2 | Amended and Restated Bylaws of DemandTec, Inc. | S-1/A | 333-143248 | 07/20/07 | 3.4 | |||||||||||||
| 10.1 | Form of Indemnification Agreement between the Registrant and each of its directors and executive officers and certain key employees* | S-1/A | 333-143248 | 07/20/07 | 10.1 | |||||||||||||
| 10.2 | DemandTec, Inc. 1999 Equity Incentive Plan, as amended, and forms of agreements thereunder* | S-1 | 333-143248 | 07/20/07 | 10.2 | |||||||||||||
| 10.3 | DemandTec, Inc. 2007 Equity Incentive Plan* | S-1 | 333-143248 | 07/20/07 | 10.3 | |||||||||||||
| 10.4 | DemandTec, Inc. 2007 Employee Stock Purchase Plan, as amended* | S-8 | 333-165908 | 04/06/10 | 99.2 | |||||||||||||
| 10.5 | Lease dated as of September 21, 2009 between DemandTec, Inc. and Franklin Templeton Companies, LLC | 8-K | 09/25/09 | 10.1 | ||||||||||||||
99
| |
|
Incorporated by Reference | |
|||||||||||||||
|---|---|---|---|---|---|---|---|---|---|---|---|---|---|---|---|---|---|---|
| Exhibit Number |
Exhibit Description | Form | File No. | Date of First Filing |
Exhibit Number |
Filed Herewith |
||||||||||||
| 10.6 | Offer Letter with Daniel R. Fishback, dated June 1, 2001, as amended* | S-1 | 333-143248 | 05/24/07 | 10.6 | |||||||||||||
| 10.7 | Amendment, dated December 10, 2008, to Offer Letter with Daniel R. Fishback* | 10-K | 04/23/09 | 10.7 | ||||||||||||||
| 10.8 | Offer Letter with Mark A. Culhane, dated July 20, 2001, as amended* | S-1 | 333-143248 | 05/24/07 | 10.7 | |||||||||||||
| 10.9 | Amendment, dated December 10, 2008, to Offer Letter with Mark A. Culhane* | 10-K | 04/23/09 | 10.9 | ||||||||||||||
| 10.10 | Offer Letter with Ronald E. F. Codd, dated March 1, 2007* | S-1 | 333-143248 | 05/24/07 | 10.11 | |||||||||||||
| 10.11 | Offer Letter with Linda Fayne Levinson, dated April 27, 2005, as amended* | S-1 | 333-143248 | 05/24/07 | 10.12 | |||||||||||||
| 10.12 | Offer Letter with Victor L. Lund, dated March 22, 2005, as amended* | S-1 | 333-143248 | 05/24/07 | 10.13 | |||||||||||||
| 10.13 | Offer Letter with Joshua W. R. Pickus, dated March 1, 2007* | S-1 | 333-143248 | 05/24/07 | 10.14 | |||||||||||||
| 10.14 | Offer Letter with Charles J. Robel, dated September 12, 2006, as amended* | S-1 | 333-143248 | 05/24/07 | 10.15 | |||||||||||||
| 10.15 | Offer Letter with William R. Phelps, dated May 29, 2007* | S-1/A | 333-143248 | 07/03/07 | 10.23 | |||||||||||||
| 10.16 | Amendment, dated December 10, 2008, to Offer Letter with William R. Phelps* | 10-K | 04/24/09 | 10.16 | ||||||||||||||
| 10.17 | Amended and Restated Master Agreement between the Registrant and Target Corporation, effective as of June 14, 2010, and Order Form thereunder† | 10-Q | 10/01/10 | 10.1 | ||||||||||||||
| 10.18 | Amended and Restated Outsourcing Services Agreement, dated May 1, 2006, by and between the Registrant and Sonata Services Limited | S-1 | 333-143248 | 05/24/07 | 10.17 | |||||||||||||
| 10.19 | First Amendment to Amendment and Restated Outsourcing Services Agreement, dated as of April 21, 2009, by and between the Registrant and Sonata Services Limited† | 10-Q | 07/02/09 | 10.1 | ||||||||||||||
| 10.20 | Loan and Security Agreement, dated April 9, 2008, by and between the Registrant and Silicon Valley Bank | 8-K | 04/14/08 | 10.1 | ||||||||||||||
100
| |
|
Incorporated by Reference | |
|||||||||||||||
|---|---|---|---|---|---|---|---|---|---|---|---|---|---|---|---|---|---|---|
| Exhibit Number |
Exhibit Description | Form | File No. | Date of First Filing |
Exhibit Number |
Filed Herewith |
||||||||||||
| 10.21 | Amendment No. 1 to Loan and Security Agreement, dated as of May 7, 2009, by and between the Registrant and Silicon Valley Bank | 10-Q | 07/02/09 | 10.2 | ||||||||||||||
| 10.22 | DemandTec, Inc. Management Cash Incentive Plan* | S-1/A | 333-143248 | 07/03/07 | 10.21 | |||||||||||||
| 10.23 | DemandTec, Inc. Non-Employee Director Compensation Policy, effective as of March 1, 2010* | X | ||||||||||||||||
| 10.24 | Offer Letter with Ronald R. Baker, dated November 9, 2007* | 10-K | 04/25/08 | 10.21 | ||||||||||||||
| 10.25 | Form of Stock Option Agreement under the Registrant's 2007 Equity Incentive Plan* | 10-K | 04/25/08 | 10.23 | ||||||||||||||
| 10.26 | Form of Stock Option Agreement for Non-Employee Directors under the Registrant's 2007 Equity Incentive Plan* | 10-K | 04/25/08 | 10.24 | ||||||||||||||
| 10.27 | Form of Fiscal Year 2010 PSU Agreement under the Registrant's 2007 Equity Incentive Plan* | 10-Q | 07/02/09 | 10.4 | ||||||||||||||
| 10.28 | Form of Fiscal Year 2009 PSU Agreement under the Registrant's 2007 Equity Incentive Plan* | 10-K | 04/25/08 | 10.26 | ||||||||||||||
| 10.29 | Form of Restricted Stock Unit Agreement under the Registrant's 2007 Equity Incentive Plan For Grants Commencing December 2009* | 10-K | 04/23/10 | 10.29 | ||||||||||||||
| 10.30 | Form of Stock Option Agreement for Non-U.S. Optionees under the Registrant's 2007 Equity Incentive Plan* | 10-Q | 01/07/11 | 10.1 | ||||||||||||||
| 21.1 | List of Subsidiaries | X | ||||||||||||||||
| 23.1 | Consent of Independent Registered Public Accounting Firm | X | ||||||||||||||||
| 24.1 | Power of Attorney (contained in the signature page to this Annual Report on Form 10-K) | X | ||||||||||||||||
| 31.1 | Certification of the Chief Executive Officer pursuant to Section 302 of the Sarbanes-Oxley Act of 2002 | X | ||||||||||||||||
101
| |
|
Incorporated by Reference | |
|||||||||||||||
|---|---|---|---|---|---|---|---|---|---|---|---|---|---|---|---|---|---|---|
| Exhibit Number |
Exhibit Description | Form | File No. | Date of First Filing |
Exhibit Number |
Filed Herewith |
||||||||||||
| 31.2 | Certification of the Chief Financial Officer pursuant to Section 302 of the Sarbanes-Oxley Act of 2002 | X | ||||||||||||||||
| 32.1 | Certifications of the Chief Executive Officer and Chief Financial Officer pursuant to 18 U.S.C. Section 1350, as adopted pursuant to Section 906 of the Sarbanes-Oxley Act of 2002** | X | ||||||||||||||||
- †
- Confidential
treatment has been requested for a portion of this exhibit.
- *
- Represents
a management agreement or compensatory plan.
- **
- This certification is not deemed "filed" for purposes of Section 18 of the Securities Exchange Act, or otherwise subject to the liability of that section. Such certification will not be deemed to be incorporated by reference into any filing under the Securities Act of 1933 or the Securities Exchange Act of 1934, except to the extent that DemandTec, Inc. specifically incorporates it by reference.
102
Pursuant to the requirements of Section 13 or 15(d) of the Securities Exchange Act of 1934, the registrant has duly caused this report to be signed on its behalf by the undersigned thereunto duly authorized.
| DEMANDTEC, INC. | ||||
By: |
/s/ Daniel R. Fishback Daniel R. Fishback, President and Chief Executive Officer |
|||
Dated: April 21, 2011
KNOW ALL PERSONS BY THESE PRESENTS, that each person whose signature appears below constitutes and appoints Daniel R. Fishback and Mark A. Culhane, and each of them, his or her true and lawful attorneys-in-fact, each with full power of substitution, for him or her in any and all capacities, to sign any amendments to this report on Form 10-K and to file the same, with exhibits thereto and other documents in connection therewith, with the Securities and Exchange Commission, hereby ratifying and confirming all that each of said attorneys-in-fact or their substitute or substitutes may do or cause to be done by virtue hereof.
Pursuant to the requirements of the Securities Act of 1934, this report has been signed below by the following persons on behalf of the registrant and in the capacities and on the dates indicated:
Signature
|
Title
|
Date
|
||
|---|---|---|---|---|
| /s/ Daniel R. Fishback Daniel R. Fishback |
President, Chief Executive Officer and Director (Principal Executive Officer) | April 21, 2011 | ||
/s/ Mark A. Culhane Mark A. Culhane |
Executive Vice President and Chief Financial Officer (Principal Financial and Accounting Officer) |
April 21, 2011 |
||
/s/ Ronald R. Baker Ronald R. Baker |
Director |
April 21, 2011 |
||
/s/ Ronald E.F. Codd Ronald E.F. Codd |
Director |
April 21, 2011 |
||
/s/ Linda Fayne Levinson Linda Fayne Levinson |
Director |
April 21, 2011 |
103
Signature
|
Title
|
Date
|
||
|---|---|---|---|---|
| /s/ Victor L. Lund Victor L. Lund |
Chairman of the Board of Directors | April 21, 2011 | ||
/s/ Joshua W.R. Pickus Joshua W.R. Pickus |
Director |
April 21, 2011 |
||
/s/ Charles J. Robel Charles J. Robel |
Director |
April 21, 2011 |
104
| |
|
Incorporated by Reference | |
|||||||||||||||
|---|---|---|---|---|---|---|---|---|---|---|---|---|---|---|---|---|---|---|
| Exhibit Number | Exhibit Description | Form | File No. | Date of First Filing |
Exhibit Number |
Filed Herewith |
||||||||||||
| 3.1 | Restated Certificate of Incorporation | S-1/A | 333-143248 | 07/20/07 | 3.2 | |||||||||||||
3.2 |
Amended and Restated Bylaws of DemandTec, Inc. |
S-1/A |
333-143248 |
07/20/07 |
3.4 |
|||||||||||||
10.1 |
Form of Indemnification Agreement between the Registrant and each of its directors and executive officers and certain key employees* |
S-1/A |
333-143248 |
07/20/07 |
10.1 |
|||||||||||||
10.2 |
DemandTec, Inc. 1999 Equity Incentive Plan, as amended, and forms of agreements thereunder* |
S-1 |
333-143248 |
07/20/07 |
10.2 |
|||||||||||||
10.3 |
DemandTec, Inc. 2007 Equity Incentive Plan* |
S-1 |
333-143248 |
07/20/07 |
10.3 |
|||||||||||||
10.4 |
DemandTec, Inc. 2007 Employee Stock Purchase Plan, as amended* |
S-8 |
333-165908 |
04/06/10 |
99.2 |
|||||||||||||
10.5 |
Lease dated as of September 21, 2009 between DemandTec, Inc. and Franklin Templeton Companies, LLC |
8-K |
09/25/09 |
10.1 |
||||||||||||||
10.6 |
Offer Letter with Daniel R. Fishback, dated June 1, 2001, as amended* |
S-1 |
333-143248 |
05/24/07 |
10.6 |
|||||||||||||
10.7 |
Amendment, dated December 10, 2008, to Offer Letter with Daniel R. Fishback* |
10-K |
4/23/09 |
10.7 |
||||||||||||||
10.8 |
Offer Letter with Mark A. Culhane, dated July 20, 2001, as amended* |
S-1 |
333-143248 |
05/24/07 |
10.7 |
|||||||||||||
10.9 |
Amendment, dated December 10, 2008, to Offer Letter with Mark A. Culhane* |
10-K |
4/23/09 |
10.9 |
||||||||||||||
10.10 |
Offer Letter with Ronald E. F. Codd, dated March 1, 2007* |
S-1 |
333-143248 |
05/24/07 |
10.11 |
|||||||||||||
10.11 |
Offer Letter with Linda Fayne Levinson, dated April 27, 2005, as amended* |
S-1 |
333-143248 |
05/24/07 |
10.12 |
|||||||||||||
10.12 |
Offer Letter with Victor L. Lund, dated March 22, 2005, as amended* |
S-1 |
333-143248 |
05/24/07 |
10.13 |
|||||||||||||
10.13 |
Offer Letter with Joshua W. R. Pickus, dated March 1, 2007* |
S-1 |
333-143248 |
05/24/07 |
10.14 |
|||||||||||||
10.14 |
Offer Letter with Charles J. Robel, dated September 12, 2006, as amended* |
S-1 |
333-143248 |
05/24/07 |
10.15 |
|||||||||||||
10.15 |
Offer Letter with William R. Phelps, dated May 29, 2007* |
S-1/A |
333-143248 |
07/03/07 |
10.23 |
|||||||||||||
10.16 |
Amendment, dated December 10, 2008, to Offer Letter with William R. Phelps* |
10-K |
04/24/09 |
10.16 |
||||||||||||||
105
| |
|
Incorporated by Reference | |
|||||||||||||||
|---|---|---|---|---|---|---|---|---|---|---|---|---|---|---|---|---|---|---|
| Exhibit Number | Exhibit Description | Form | File No. | Date of First Filing |
Exhibit Number |
Filed Herewith |
||||||||||||
| 10.17 | Amended and Restated Master Agreement between the Registrant and Target Corporation, effective as of June 14, 2010, and Order Form thereunder† | 10-Q | 10/01/10 | 10.1 | ||||||||||||||
10.18 |
Amended and Restated Outsourcing Services Agreement, dated May 1, 2006, by and between the Registrant and Sonata Services Limited |
S-1 |
333-143248 |
05/24/07 |
10.17 |
|||||||||||||
10.19 |
First Amendment to Amendment and Restated Outsourcing Services Agreement, dated as of April 21, 2009, by and between the Registrant and Sonata Services Limited† |
10-Q |
07/02/09 |
10.1 |
||||||||||||||
10.20 |
Loan and Security Agreement, dated April 9, 2008, by and between the Registrant and Silicon Valley Bank |
8-K |
04/14/08 |
10.1 |
||||||||||||||
10.21 |
Amendment No. 1 to Loan and Security Agreement, dated as of May 7, 2009, by and between the Registrant and Silicon Valley Bank |
10-Q |
07/02/09 |
10.2 |
||||||||||||||
10.22 |
DemandTec, Inc. Management Cash Incentive Plan* |
S-1/A |
333-143248 |
07/03/07 |
10.21 |
|||||||||||||
10.23 |
DemandTec, Inc. Non-Employee Director Compensation Policy, effective as of March 1, 2010* |
X |
||||||||||||||||
10.24 |
Offer Letter with Ronald R. Baker, dated November 9, 2007* |
10-K |
04/25/08 |
10.21 |
||||||||||||||
10.25 |
Form of Stock Option Agreement under the Registrant's 2007 Equity Incentive Plan* |
10-K |
04/25/08 |
10.23 |
||||||||||||||
10.26 |
Form of Stock Option Agreement for Non-Employee Directors under the Registrant's 2007 Equity Incentive Plan* |
10-K |
04/25/08 |
10.24 |
||||||||||||||
10.27 |
Form of Fiscal Year 2010 PSU Agreement under the Registrant's 2007 Equity Incentive Plan* |
10-Q |
07/02/09 |
10.4 |
||||||||||||||
10.28 |
Form of Fiscal Year 2009 PSU Agreement under the Registrant's 2007 Equity Incentive Plan* |
10-K |
04/25/08 |
10.26 |
||||||||||||||
10.29 |
Form of Restricted Stock Unit Agreement under the Registrant's 2007 Equity Incentive Plan For Grants Commencing December 2009* |
10-K |
04/23/10 |
10.29 |
||||||||||||||
10.30 |
Form of Stock Option Agreement for Non-U.S. Optionees under the Registrant's 2007 Equity Incentive Plan* |
10-Q |
01/07/11 |
10.1 |
||||||||||||||
21.1 |
List of Subsidiaries |
X |
||||||||||||||||
106
| |
|
Incorporated by Reference | |
|||||||||||||||
|---|---|---|---|---|---|---|---|---|---|---|---|---|---|---|---|---|---|---|
| Exhibit Number | Exhibit Description | Form | File No. | Date of First Filing |
Exhibit Number |
Filed Herewith |
||||||||||||
| 23.1 | Consent of Independent Registered Public Accounting Firm | X | ||||||||||||||||
24.1 |
Power of Attorney (contained in the signature page to this Annual Report on Form 10-K) |
X |
||||||||||||||||
31.1 |
Certification of the Chief Executive Officer pursuant to Section 302 of the Sarbanes-Oxley Act of 2002 |
X |
||||||||||||||||
31.2 |
Certification of the Chief Financial Officer pursuant to Section 302 of the Sarbanes-Oxley Act of 2002 |
X |
||||||||||||||||
32.1 |
Certifications of the Chief Executive Officer and Chief Financial Officer pursuant to 18 U.S.C. Section 1350, as adopted pursuant to Section 906 of the Sarbanes-Oxley Act of 2002** |
X |
||||||||||||||||
- †
- Confidential
treatment has been requested for a portion of this exhibit.
- *
- Represents
a management agreement or compensatory plan.
- **
- This certification is not deemed "filed" for purposes of Section 18 of the Securities Exchange Act, or otherwise subject to the liability of that section. Such certification will not be deemed to be incorporated by reference into any filing under the Securities Act of 1933 or the Securities Exchange Act of 1934, except to the extent that DemandTec, Inc. specifically incorporates it by reference.
107