Attached files
| file | filename |
|---|---|
| EX-99.2 - EX-99.2 - DOVER Corp | y90923exv99w2.htm |
| EX-99.1 - EX-99.1 - DOVER Corp | y90923exv99w1.htm |
| 8-K - FORM 8-K - DOVER Corp | y90923e8vk.htm |
Exhibit 99.3

| Dover Corporation First Quarter 2011 Conference Call April 21, 2011 11:30 am ET |
| 2 Forward Looking Statements We want to remind everyone that our comments may contain forward-looking statements that are inherently subject to uncertainties. We caution everyone to be guided in their analysis of Dover Corporation by referring to our Form 10-K for a list of factors that could cause our results to differ from those anticipated in any such forward-looking statements. We would also direct your attention to our internet site, www.dovercorporation.com, where considerably more information can be found. |
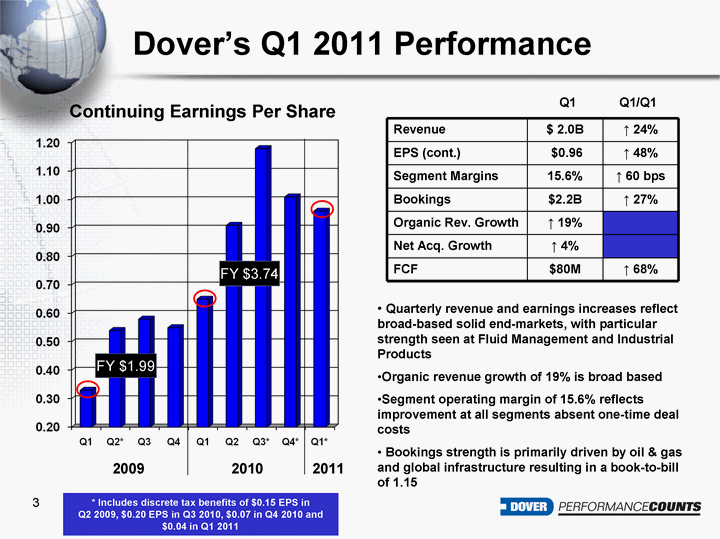
| 3 Dover's Q1 2011 Performance Continuing Earnings Per Share 2009 FY $3.74 Revenue $ 2.0B ^ 24% EPS (cont.) $0.96 ^ 48% Segment Margins 15.6% ^ 60 bps Bookings $2.2B ^ 27% Organic Rev. Growth ^ 19% Net Acq. Growth ^ 4% FCF $80M ^ 68% Quarterly revenue and earnings increases reflect broad-based solid end-markets, with particular strength seen at Fluid Management and Industrial Products Organic revenue growth of 19% is broad based Segment operating margin of 15.6% reflects improvement at all segments absent one-time deal costs Bookings strength is primarily driven by oil & gas and global infrastructure resulting in a book-to-bill of 1.15 Q1 Q1/Q1 2010 FY $1.99 2011 * Includes discrete tax benefits of $0.15 EPS in Q2 2009, $0.20 EPS in Q3 2010, $0.07 in Q4 2010 and $0.04 in Q1 2011 |
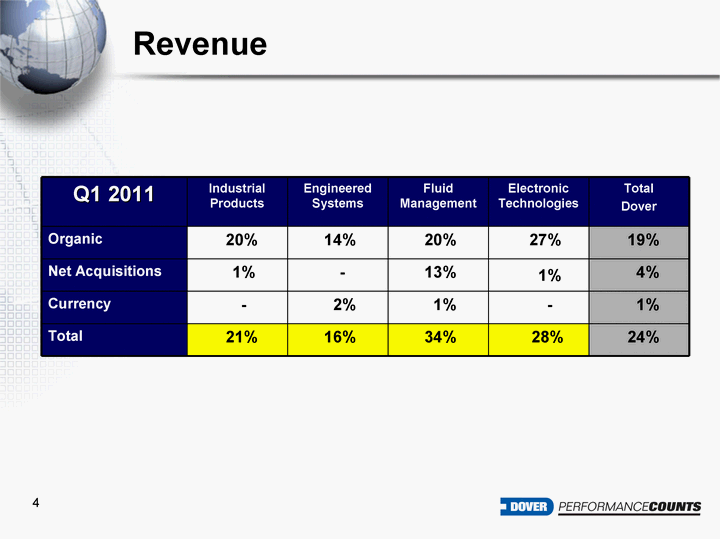
| 4 Revenue Q1 2011 Industrial Products Engineered Systems Fluid Management Electronic Technologies Total Dover Organic 20% 14% 20% 27% 19% Net Acquisitions 1% - 13% 1% 4% Currency - 2% 1% - 1% Total 21% 16% 34% 28% 24% |
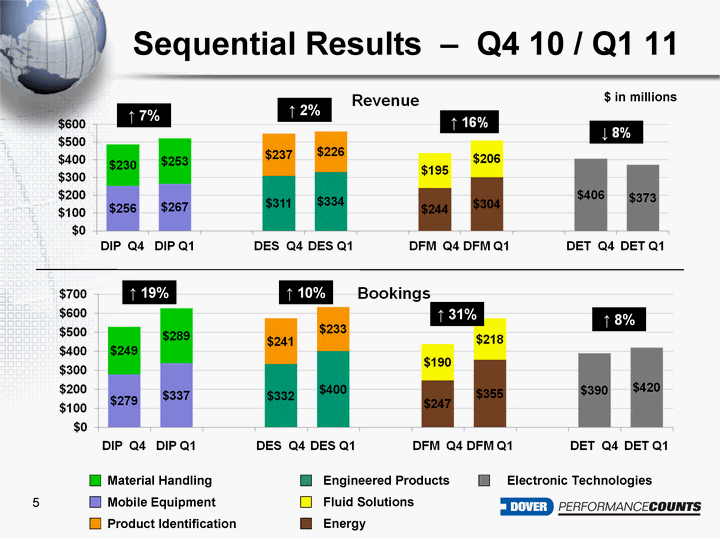
| 5 Sequential Results - Q4 10 / Q1 11 Material Handling Fluid Solutions Mobile Equipment Energy Product Identification Engineered Products ^ 7% ^ 2% Electronic Technologies ^ 19% ^ 10% ^ 31% ^ 8% $ in millions |
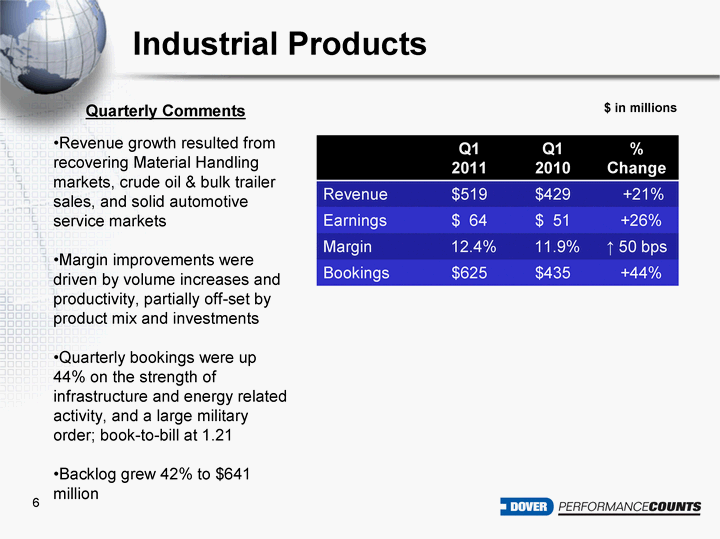
| 6 Industrial Products Revenue growth resulted from recovering Material Handling markets, crude oil & bulk trailer sales, and solid automotive service markets Margin improvements were driven by volume increases and productivity, partially off-set by product mix and investments Quarterly bookings were up 44% on the strength of infrastructure and energy related activity, and a large military order; book-to-bill at 1.21 Backlog grew 42% to $641 million $ in millions Q1 2011 Q1 2010 % Change Revenue $519 $429 +21% Earnings $ 64 $ 51 +26% Margin 12.4% 11.9% ^ 50 bps Bookings $625 $435 +44% Quarterly Comments |

| 7 Engineered Systems Revenue gains were broad-based with Hill Phoenix having the largest positive impact Earnings and operating margin improvements were driven by increased volume and productivity, partially off-set by materials cost inflation Product ID saw strength in emerging markets, which was partially off-set by weakness in the US •Bookings were up 10% sequentially, including the normal seasonal upswing at Hill Phoenix; book-to-bill is 1.13 $ in millions Quarterly Comments Q1 2011 Q1 2010 % Change Revenue $560 $484 +16% Earnings $ 67 $ 55 +23% Margin 12.0% 11.3% ^ 70 bps Bookings $633 $589 +8% |
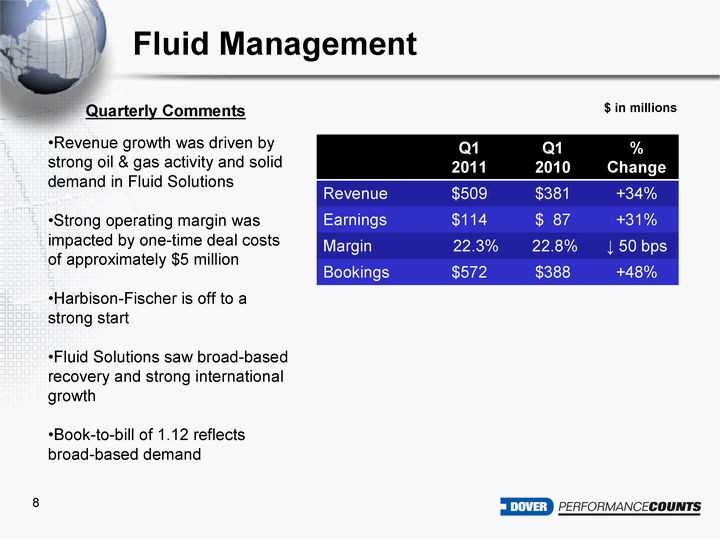
| 8 Fluid Management Revenue growth was driven by strong oil & gas activity and solid demand in Fluid Solutions Strong operating margin was impacted by one-time deal costs of approximately $5 million Harbison-Fischer is off to a strong start Fluid Solutions saw broad-based recovery and strong international growth Book-to-bill of 1.12 reflects broad-based demand $ in millions Quarterly Comments Q1 2011 Q1 2010 % Change Revenue $509 $381 +34% Earnings $114 $ 87 +31% Margin 22.3% 22.8% ^ 50 bps Bookings $572 $388 +48% |
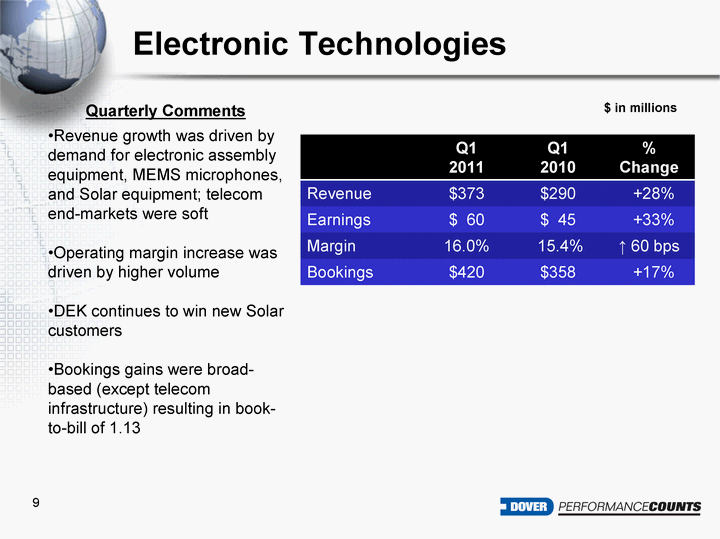
| 9 Electronic Technologies Revenue growth was driven by demand for electronic assembly equipment, MEMS microphones, and Solar equipment; telecom end-markets were soft Operating margin increase was driven by higher volume DEK continues to win new Solar customers Bookings gains were broad- based (except telecom infrastructure) resulting in book- to-bill of 1.13 $ in millions Quarterly Comments Q1 2011 Q1 2010 % Change Revenue $373 $290 +28% Earnings $ 60 $ 45 +33% Margin 16.0% 15.4% ^ 60 bps Bookings $420 $358 +17% |
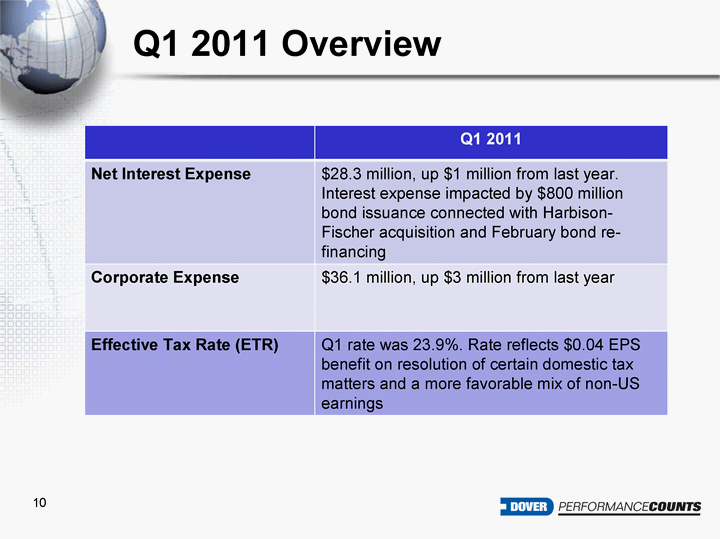
| Q1 2011 Overview Q1 2011 Net Interest Expense $28.3 million, up $1 million from last year. Interest expense impacted by $800 million bond issuance connected with Harbison-Fischer acquisition and February bond re-financing Corporate Expense $36.1 million, up $3 million from last year Effective Tax Rate (ETR) Q1 rate was 23.9%. Rate reflects $0.04 EPS benefit on resolution of certain domestic tax matters and a more favorable mix of non-US earnings 10 |
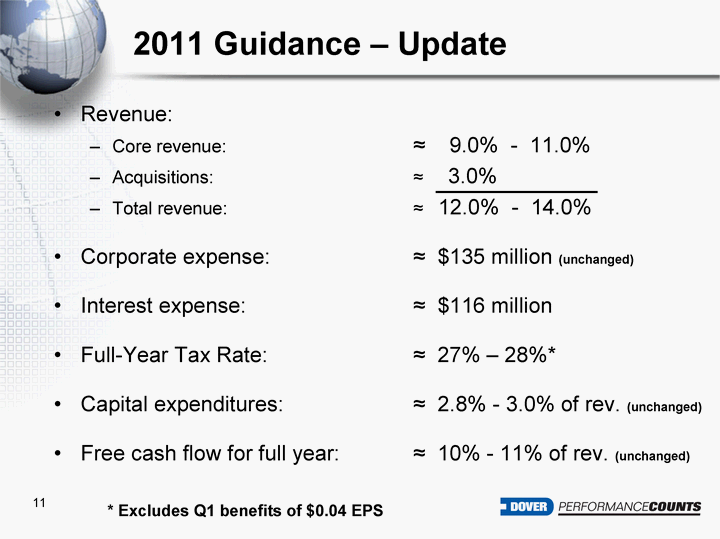
| 11 2011 Guidance - Update Revenue: Core revenue: ^ 9.0% - 11.0% Acquisitions: ^ 3.0% Total revenue: ^ 12.0% - 14.0% Corporate expense: ^ $135 million (unchanged) Interest expense: ^ $116 million Full-Year Tax Rate: ^ 27% - 28%* Capital expenditures: ^ 2.8% - 3.0% of rev. (unchanged) Free cash flow for full year: ^ 10% - 11% of rev. (unchanged) * Excludes Q1 benefits of $0.04 EPS |
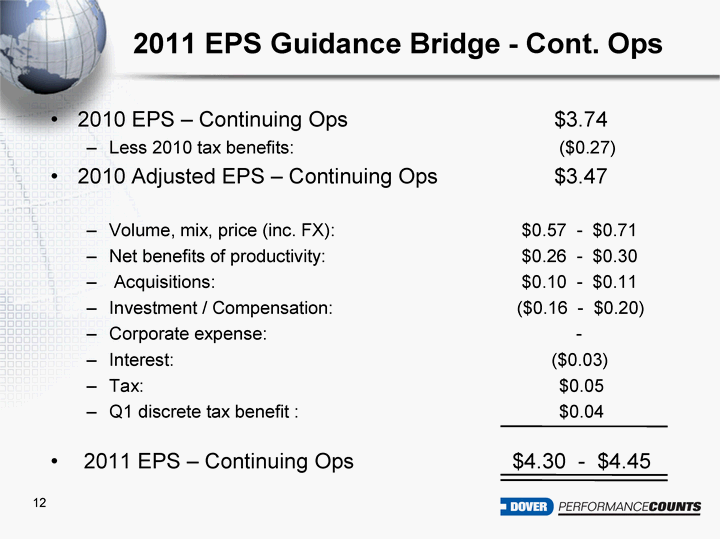
| 2010 EPS - Continuing Ops $3.74 Less 2010 tax benefits: ($0.27) 2010 Adjusted EPS - Continuing Ops $3.47 Volume, mix, price (inc. FX): $0.57 - $0.71 Net benefits of productivity: $0.26 - $0.30 Acquisitions: $0.10 - $0.11 Investment / Compensation: ($0.16 - $0.20) Corporate expense: - Interest: ($0.03) Tax: $0.05 Q1 discrete tax benefit : $0.04 2011 EPS - Continuing Ops $4.30 - $4.45 12 2011 EPS Guidance Bridge - Cont. Ops |
