Attached files
| file | filename |
|---|---|
| 8-K - CAPITAL ONE FINANCIAL CORPORATION 8-K 4-21-2011 - CAPITAL ONE FINANCIAL CORP | form8k.htm |
| EX-99.2 - EXHIBIT 99.2 - CAPITAL ONE FINANCIAL CORP | ex99_2.htm |
| EX-99.1 - EXHIBIT 99.1 - CAPITAL ONE FINANCIAL CORP | ex99_1.htm |

First Quarter 2011 Results
April 21, 2011
Exhibit 99.3

2
April 21, 2011
Forward-looking statements
Please note that the following materials containing information regarding Capital One’s financial performance speak only as of the particular date or dates
indicated in these materials. Capital One does not undertake any obligation to update or revise any of the information contained herein whether as a result
of new information, future events or otherwise.
indicated in these materials. Capital One does not undertake any obligation to update or revise any of the information contained herein whether as a result
of new information, future events or otherwise.
Certain statements in this presentation and other oral and written statements made by Capital One from time to time are forward-looking statements,
including those that discuss, among other things, strategies, goals, outlook or other non-historical matters; projections, revenues, income, returns,
accruals for claims in litigation and for other claims against Capital One, earnings per share or other financial measures for Capital One; future financial
and operating results; Capital One’s plans, objectives, expectations and intentions; and the assumptions that underlie these matters. To the extent that
any such information is forward-looking, it is intended to fit within the safe harbor for forward-looking information provided by the Private Securities
Litigation Reform Act of 1995. Numerous factors could cause Capital One’s actual results to differ materially from those described in such forward-looking
statements, including, among other things: general economic and business conditions in the U.S., the U.K., Canada, or Capital One’s local markets,
including conditions affecting employment levels, interest rates, consumer income and confidence, spending and savings that may affect consumer
bankruptcies, defaults, charge-offs and deposit activity; an increase or decrease in credit losses (including increases due to a worsening of general
economic conditions in the credit environment); financial, legal, regulatory, tax or accounting changes or actions, including the impact of the Dodd-Frank
Wall Street Reform and Consumer Protection Act and the regulations promulgated thereunder; developments, changes or actions relating to any litigation
matter involving Capital One; increases or decreases in interest rates; Capital One’s ability to access the capital markets at attractive rates and terms to
capitalize and fund its operations and future growth; the success of Capital One’s marketing efforts in attracting and retaining customers; increases or
decreases in Capital One’s aggregate loan balances or the number of customers and the growth rate and composition thereof, including increases or
decreases resulting from factors such as shifting product mix, amount of actual marketing expenses Capital One incurs and attrition of loan balances; the
level of future repurchase or indemnification requests Capital One may receive, the actual future performance of mortgage loans relating to such requests,
the success rates of claimants against Capital One, any developments in litigation and the actual recoveries Capital One may make on any collateral
relating to claims against Capital One; the amount and rate of deposit growth; changes in the reputation of or expectations regarding the financial
services industry or Capital One with respect to practices, products or financial condition; any significant disruption in Capital One’s operations or
technology platform; Capital One’s ability to maintain a compliance infrastructure suitable for its size and complexity; Capital One’s ability to control costs;
the amount of, and rate of growth in, Capital One’s expenses as its business develops or changes or as it expands into new market areas; Capital One’s
ability to execute on its strategic and operational plans; any significant disruption of, or loss of public confidence in, the United States Mail service affecting
Capital One’s response rates and consumer payments; Capital One’s ability to recruit and retain experienced personnel to assist in the management and
operations of new products and services; changes in the labor and employment markets; the risk that cost savings and any other synergies from Capital
One’s acquisitions may not be fully realized or may take longer to realize than expected; disruptions from Capital One’s acquisitions negatively impacting
Capital One’s ability to maintain relationships with customers, employees or suppliers; fraud or misconduct by Capital One’s customers, employees or
business partners; competition from providers of products and services that compete with Capital One’s businesses; and other risk factors listed from time
to time in reports that Capital One files with the Securities and Exchange Commission (the “SEC”), including, but not limited to, the Annual Report on
Form 10-K for the year ended December 31, 2010. You should carefully consider the factors discussed above in evaluating these forward-looking
statements. All information in these slides is based on the consolidated results of Capital One Financial Corporation, unless otherwise noted. A
reconciliation of any non-GAAP financial measures included in this presentation can be found in Capital One’s most recent Form 8-K filed April 21, 2011,
available on Capital One’s website at www.capitalone.com under “Investors.”

3
April 21, 2011
Net Interest Income
Non-Interest Income
Revenue
Marketing Expense
Operating Expense
Pre-Provision Earnings (before tax)
Net Charge-offs
Other
Allowance Build (Release)
Provision Expense
Discontinued Operations, net of tax
Total Company (after tax)
EPS
Tax Expense
Pretax Income
$MM
Operating Earnings (after tax)
First quarter 2011 earnings were $2.21 per share, up 45% from the prior
quarter
quarter
Non-Interest Expense
3,140
942
4,082
276
1,886
2,162
1,920
1,145
(50)
(561)
534
1,016
1,032
(16)
$2.21
1,386
354
Q111
3,023
939
3,962
308
1,783
2,091
1,871
1,394
(8)
(547)
839
697
701
(4)
$1.52
1,032
331
2
Q410
2
4%
0%
3%
10%
(6)%
(3)%
3%
18%
525%
3%
36%
46%
47%
(300)%
34%
(7)%
45%
% Change
Highlights
• Interest income increase driven by
margin expansion
margin expansion
• Non-interest expense increased
modestly as one-time operating
costs were partially offset by
seasonally lower marketing costs
modestly as one-time operating
costs were partially offset by
seasonally lower marketing costs
• Improvement in credit led to lower
charge-offs and continued
allowance release
charge-offs and continued
allowance release
• Tax rate decrease driven by IRS
settlements in the quarter
settlements in the quarter

4
April 21, 2011
Margins increased in the quarter
Q1 Margin Expansion
• Higher asset yields
• Improving credit trends and outlook
• Modest improvement in cost of funds
Drivers of Future Margin Trends
• Competitive dynamics
• Asset mix
• Credit trends
Margins as % of Managed Assets
Revenue Margin
Net Interest Margin
5
April 21, 2011
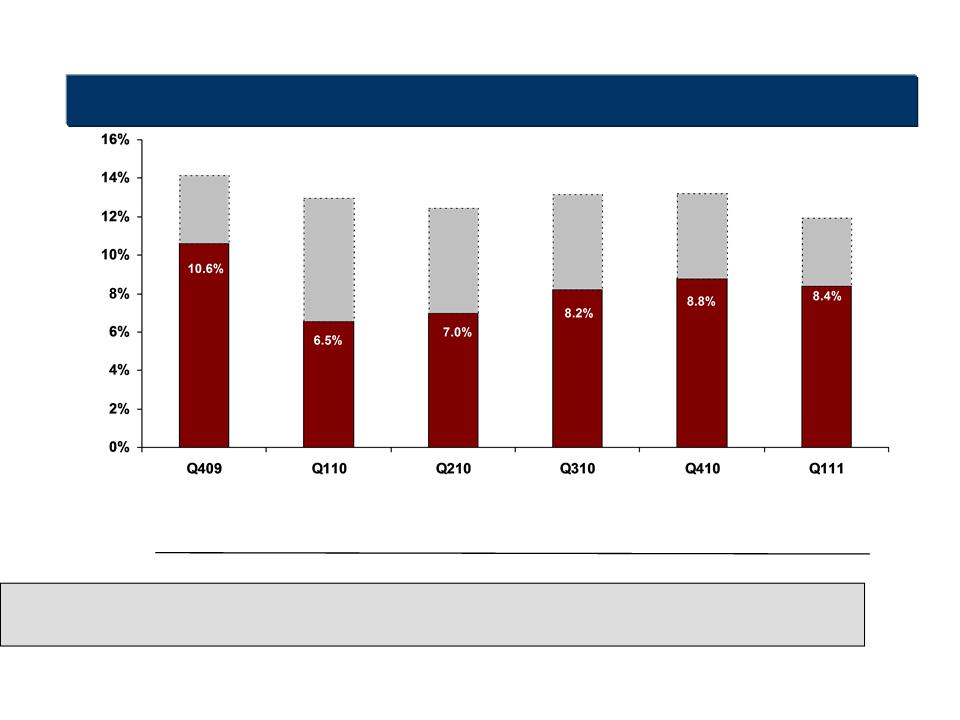
Our capacity to generate capital remains strong
Tier 1 Common Equity + Allowance Ratio to Risk-Weighted Assets
Allowance
Tier 1 Common
14.2%
13.0%
12.5%
13.2%
13.2%
1
1 Tier 1 common equity ratio is a non-GAAP measure calculated based on Tier 1 common equity divided by risk-
weighted assets. See "Exhibit 99.2—Table 12: Reconciliation of Non-GAAP Measures and Calculation of Regulatory
Capital Measures" for the calculation of this ratio.
weighted assets. See "Exhibit 99.2—Table 12: Reconciliation of Non-GAAP Measures and Calculation of Regulatory
Capital Measures" for the calculation of this ratio.
Disallowed DTA
RWA
EOP Loans
(0)
(2.2)
(2.0)
(1.3)
(1.1)
116
120
124
125
127
137
130
127
126
126
(1.4)
142
124
12.0%
Tier 1 Common excluding
disallowed DTA
disallowed DTA
($B)
12.3
10.1
10.7
11.5
12.3
13.4
Tier 1 Common
12.3
7.9
8.7
10.2
11.2
12.0

6
April 21, 2011
Loan balances declined modestly, reflecting expected seasonal trends
Liability Highlights
Asset Highlights
Total Cost
of Funds 1.76% 1.69% 1.64% 1.50% 1.41%
of Funds 1.76% 1.69% 1.64% 1.50% 1.41%
End of Period Assets
Domestic Card
Commercial
Int’l Card
Consumer
$B
Other
Cash & Cash
Equivalents
Securities
• End of period loans declined ~$1.9 billion
– Run-off portfolios down ~$1.0 billion
– Decline excluding run-off ~$800 million
• Average loans declined ~$400 million
• Cost of funds decreased to 1.41%
• Continued shift in funding to lower priced deposits
• Loan to deposit ratio of 0.99

7
April 21, 2011
Credit improvement in our consumer businesses continues to run
ahead of broader economic indicators
ahead of broader economic indicators
Domestic Credit Card ($51.9B*)
Net Charge-off Rate
Home Loan ($12.0B*)
International Credit Card ($8.7B*)
Net Charge-off Rate
30+ Day Delinquency Rate
Net Charge-off Rate
30+ Day Performing
Delinquency Rate
Delinquency Rate
Net Charge-off Rate
30+ Day Performing
Delinquency Rate
Delinquency Rate
* Average assets for Q1

8
April 21, 2011
Commercial Banking credit metrics have stabilized and improved
modestly over the last four quarters
modestly over the last four quarters
Total Commercial Banking ($29.8B*)
Nonperforming
Asset Rate
Asset Rate
Commercial & Multi-Family Real Estate ($13.3B*)
Nonperforming
Asset Rate
Asset Rate
Charge-off
Rate
Rate
Total Commercial Lending
Excluding Small Ticket CRE ($28.0B*)
Excluding Small Ticket CRE ($28.0B*)
Nonperforming
Asset Rate
Asset Rate
Charge-off
Rate
Rate
Nonperforming
Asset Rate
Asset Rate
Charge-off
Rate
Rate
* Average assets for Q1

9
April 21, 2011
Capital One is well positioned to deliver and sustain attractive returns and
generate capital
generate capital
Local Banking
Commercial
Banking
Banking
Strong and Resilient Balance Sheet
Retail
Banking
• Access to Assets
• Strong ROAs
• Leading Brand Scale
• Low Risk Commercial Assets
• Core Deposit Funding
• Banking Relationships
Card
Auto
National Scale
Brand
Moderate growth
Strong returns
Strong capital generation

10
April 21, 2011
Appendix

11
April 21, 2011
Strong credit continues to drive Domestic Card profits
• Revenue margin increased 56 bps from
Q4 driven by favorable credit trends and a
modest increase in fee revenue
Q4 driven by favorable credit trends and a
modest increase in fee revenue
• Non-interest expenses increased due to
higher legal expenses in Q1 partially offset
by seasonally lower marketing expenses
higher legal expenses in Q1 partially offset
by seasonally lower marketing expenses
• Credit improvement continued
–Lower provision from declining
charge-offs
charge-offs
– Delinquency rate improved 50 bps
from Q4
from Q4
• Ending loans declined by $3.3B driven by
seasonal decreases and closed end loan
run-off
seasonal decreases and closed end loan
run-off
• Purchase volume declined by $2.0B due to
seasonal patterns
seasonal patterns
• Purchase volume increased 14%
from Q1 2010
from Q1 2010
Net interest income
Non-interest income
Total revenue
Provision for loan and lease losses
Non-interest expenses
Income before taxes
Income taxes
Net income
Selected Metrics
Period end loans held for investment
Average loans held for investment
Loans held for investment yield
Revenue margin
Net charge-off rate
30+ day delinquency rate
Purchase volume
Earnings
(in millions)
Q1 2010
Q1 2011
Highlights
583
230
990
2,234
1,014
360
654
14.65%
17.22%
3.59%
1,651
6.20%
618
1,096
809
2,483
578
206
372
56,228
58,108
14.78%
17.09%
5.30%
21,988
1,865
10.48%
Q4 2010
594
505
935
2,215
775
276
499
53,849
53,189
13.57%
16.66%
4.09%
26,985
1,621
7.28%
50,570
51,889
25,024
Domestic Card

12
April 21, 2011
International Card performance was driven primarily by the inclusion of HBC
HBC Acquisition Drove the Following
• $1.2B higher loans and an associated
increase in revenue compared to Q4
increase in revenue compared to Q4
• Inclusion of the HBC business drove non-
interest expense higher by approximately
$30MM for the quarter
interest expense higher by approximately
$30MM for the quarter
• Higher provision expense was due
primarily to a one-time ALLL build for HBC
of $105MM
primarily to a one-time ALLL build for HBC
of $105MM
Net interest income
Non-interest income
Total revenue
Provision for loan and lease losses
Non-interest expenses
Income before taxes
Net income (loss)
Selected Metrics
Period end loans held for investment
Average loans held for investment
Loans held for investment yield
Revenue margin
Net charge-off rate
30+ day delinquency rate
Purchase volume
Earnings
(in million)
Income taxes (benefit)
Q1 2010
Q1 2011
International Card
91
220
188
381
(27)
(16)
(11)
16.65%
17.52%
5.55%
290
5.74%
100
79
105
348
164
47
117
7,578
7,814
15.66%
17.81%
6.39%
1,936
248
8.83%
Q4 2010
78
84
121
327
122
35
87
7,522
7,419
16.82%
17.63%
5.75%
2,394
249
6.68%
8,735
8,697
2,773
Highlights

13
April 21, 2011
Commercial Banking net income was higher in Q1 due to lower provision
expenses
expenses
• Revenue and average loans remained
relatively stable compared to Q4
relatively stable compared to Q4
• Non-interest expenses decreased due in
part to lower legal and foreclosure
expenses
part to lower legal and foreclosure
expenses
• Provision expenses decreased $49MM
from Q4 due to a decline in charge-offs
from lower loss severities
from Q4 due to a decline in charge-offs
from lower loss severities
• Deposits increased by $1.6B from Q4
mainly driven by growth in Money Market /
Savings accounts and DDA
mainly driven by growth in Money Market /
Savings accounts and DDA
Net interest income
Non-interest income
Total revenue
Provision for loan and lease losses
Non-interest expenses
Income (loss) before taxes
Net income (loss)
Selected Metrics
Period end loans held for investment
Average loans held for investment
Loans held for investment yield
Period end deposits
Average deposits
Deposit interest expense rate
Core deposit intangible amortization
Net charge-off rate
Earnings
Nonperforming loans as a % of
loans HFI
loans HFI
Nonperforming asset rate
(in millions)
Income taxes (benefit)
Q1 2010
Q1 2011
Highlights
Commercial Banking
71
(15)
177
392
230
82
148
4.80%
24,244
0.79%
321
0.55%
1.95%
1.84%
42
238
192
354
(76)
(27)
(49)
29,612
29,723
5.03%
21,605
21,859
14
1.37%
312
0.72%
2.64%
2.48%
Q4 2010
49
34
207
385
144
51
93
29,742
29,617
5.13%
22,630
22,808
13
1.43%
336
0.61%
1.80%
1.66%
11
24,138
29,793
30,017

14
April 21, 2011
Consumer Banking net income increased by $95MM in Q1 from Q4
• Revenue increased by $23MM from Q4
driven by higher margins in Auto
driven by higher margins in Auto
• Non-interest expenses decreased by
$30MM due primarily to lower marketing
costs
$30MM due primarily to lower marketing
costs
• Provision expenses decreased by nearly
50% from Q4 due to better credit
performance in auto, mortgage and retail
banking
50% from Q4 due to better credit
performance in auto, mortgage and retail
banking
• Ending loans decreased slightly from Q4
with an increase in auto loans offset by
continued home loan run-off
with an increase in auto loans offset by
continued home loan run-off
• Period end deposits were higher by $3.4B
in Q1 driven by increases in Money
Market/Savings accounts
in Q1 driven by increases in Money
Market/Savings accounts
Net interest income
Non-interest income
Total revenue
Provision for loan and lease losses
Non-interest expenses
Income before taxes
Net income
Selected Metrics
Period end loans held for investment
Average loans held for investment
Loans held for investment yield
Auto loan originations
Period end deposits
Average deposits
Deposit interest expense rate
Core deposit intangible amortization
Earnings
Nonperforming loans as a % of
loans HFI
loans HFI
Nonperforming asset rate
Net charge-off rate
30+ day performing delinquency rate
Period end loans serviced for others
(in millions)
Income taxes
3.42%
1,169
1,212
Q1 2010
Q1 2011
Highlights
Consumer Banking
186
95
740
334
119
215
9.60%
86,355
1.06%
983
83,884
2.00%
1.84%
1.57%
316
50
688
474
169
305
36,383
38,245
8.96%
1,343
76,883
896
75,115
1.62%
3.90%
26,778
1.27%
38
2.03%
1.76%
4.28%
1,146
Q4 2010
196
189
770
187
67
120
34,383
34,751
9.20%
2,217
82,959
1.13%
34
950
81,834
2.17%
1.97%
1.98%
20,689
34,306
34,236
2,571
35
19,956