Attached files
| file | filename |
|---|---|
| EX-23.1 - CONSENT OF MCGLADREY & PULLEN, LLP - LIGHTING SCIENCE GROUP CORP | dex231.htm |
Table of Contents
As filed with the Securities and Exchange Commission on April 20, 2011
Registration No. 333-172165
UNITED STATES
SECURITIES AND EXCHANGE COMMISSION
Washington, D.C. 20549
Amendment No. 1
to
Form S-1
REGISTRATION STATEMENT
UNDER
THE SECURITIES ACT OF 1933
LIGHTING SCIENCE GROUP CORPORATION
(Exact Name of Registrant as Specified in its Charter)
| Delaware | 3646 | 23-2596710 | ||
| (State or other jurisdiction of incorporation or organization) |
(Primary Standard Industrial Classification Code Number) |
(I.R.S. Employer Identification No.) |
1227 South Patrick Drive, Building 2A
Satellite Beach, Florida 32937
(321) 779-5520
(Address and telephone number of principal executive offices)
Lighting Science Group Corporation
Attention: Gregory T. Kaiser, Chief Financial Officer
1227 South Patrick Drive, Building 2A
Satellite Beach, Florida 32937
(321) 779-5520
(Name, address and telephone number of agent for service)
Copies of all communications, including communications sent to agent for service, should be sent to:
| Greg R. Samuel, Esq. Haynes and Boone, LLP 2323 Victory Avenue, Suite 700 Dallas, TX 75219 (214) 651-5000 Fax: (214) 200-0577 |
Marc D. Jaffe, Esq. Rachel W. Sheridan, Esq. Latham & Watkins LLP 885 Third Avenue New York, New York 10022 (212) 906-1200 Fax: (212) 751-4864 |
Approximate date of proposed sale to public: As soon as practicable on or after the effective date of this registration statement.
If any of the securities being registered on this Form are to be offered on a delayed or continuous basis pursuant to Rule 415 under the Securities Act of 1933 check the following box. ¨
If this Form is filed to register additional securities for an offering pursuant to Rule 462(b) under the Securities Act, please check the following box and list the Securities Act registration statement number of the earlier effective registration statement for the same offering. ¨
If this Form is a post-effective amendment filed pursuant to Rule 462(c) under the Securities Act, check the following box and list the Securities Act registration statement number of the earlier effective registration statement for the same offering. ¨
If this Form is a post-effective amendment filed pursuant to Rule 462(d) under the Securities Act, check the following box and list the Securities Act registration statement number of the earlier effective registration statement for the same offering. ¨
Indicate by check mark whether the registrant is a large accelerated filer, an accelerated filer, a non-accelerated filer, or a smaller reporting company. See definitions of “large accelerated filer,” “accelerated filer,” and “smaller reporting company” in Rule 12b-2 of the Exchange Act. (Check one):
| Large accelerated filer | ¨ | Accelerated filer | ¨ | |||||
| Non-accelerated filer | ¨ | (Do not check if a smaller reporting company) | Smaller reporting company | x |
The registrant hereby amends this registration statement on such date or dates as may be necessary to delay its effective date until the registrant shall file a further amendment which specifically states that this registration statement shall thereafter become effective in accordance with section 8(a) of the Securities Act of 1933 or until the registration statement shall become effective on such date as the Commission, acting pursuant to said section 8(a), may determine.
Table of Contents
The information in this preliminary prospectus is not complete and may be changed. We may not sell these securities until the registration statement filed with the Securities and Exchange Commission is declared effective. This preliminary prospectus is not an offer to sell these securities and it is not soliciting an offer to buy these securities in any state where the offer or sale is not permitted.
Subject to Completion, Dated , 2011
Shares

Common Stock
Lighting Science Group Corporation is offering shares of its common stock. We intend to apply to have our common stock listed on the NASDAQ stock market under the symbol “LSGC.” We anticipate that the public offering price will be between $ and $ per share.
Our common stock is currently traded on the Over-the-Counter Bulletin Board under the symbol “LSCG.OB.”
Investing in our common stock involves risks. See “Risk factors” beginning on page 10 of this prospectus.
| Per Share | Total | |||||||
| Public offering price |
$ | $ | ||||||
| Underwriting discounts and commissions(1) |
$ | $ | ||||||
| Proceeds, before expenses, to Lighting Science Group Corporation |
$ | $ | ||||||
| (1) | We entered into an agreement with Moelis & Company LLC pursuant to which we agreed to pay Moelis & Company LLC a fee of $200,000 for financial advisory services in connection with this offering, and which we have not included in the underwriting discounts and commissions. |
We have granted the underwriters the right to purchase up to an additional shares of our common stock to cover over-allotments.
Neither the Securities and Exchange Commission nor any state securities commission has approved or disapproved of these securities or passed upon the adequacy or accuracy of this prospectus. Any representation to the contrary is a criminal offense.
The underwriters expect to deliver the shares to purchasers on , 2011.
Joint Book-Running Managers
| Credit Suisse | J.P.Morgan |
Co-Managers
| Stifel Nicolaus Weisel | Moelis & Company | Piper Jaffray |
, 2011
Table of Contents

Table of Contents
| 1 | ||||
| 7 | ||||
| 8 | ||||
| 10 | ||||
| 24 | ||||
| 25 | ||||
| 26 | ||||
| 26 | ||||
| 27 | ||||
| 28 | ||||
| 30 | ||||
| Management’s discussion and analysis of financial condition and results of operations |
33 | |||
| 55 | ||||
| 73 | ||||
| 80 | ||||
| 97 | ||||
| 99 | ||||
| 105 | ||||
| 108 | ||||
| Material U.S. federal income and estate tax considerations for non-U.S. holders |
110 | |||
| 113 | ||||
| 121 | ||||
| 121 | ||||
| 121 | ||||
| F-1 | ||||
You should rely only on the information contained in this prospectus. We have not authorized anyone to provide you with information different from that contained in this prospectus. If you receive any information not authorized by us, then you should not rely on it.
We are offering to sell, and seeking offers to buy, shares of our common stock only in jurisdictions where offers and sales are permitted. The information contained in this prospectus is accurate only as of the date of this prospectus, regardless of the time of delivery of this prospectus or of any sale of our common stock.
i
Table of Contents
This summary highlights certain information included elsewhere in this prospectus. This summary is not complete and does not contain all of the information that you should consider before investing in our common stock. You should read this entire prospectus carefully, including the risks discussed in “Risk factors” and our consolidated financial statements and related notes included elsewhere in this prospectus. Some of the statements in this summary constitute forward-looking statements. See “Forward-looking statements” for additional information.
As used in this prospectus, unless the context otherwise indicates, the references to “we,” “us,” “our,” “our company” or “Lighting Science Group” refer to Lighting Science Group Corporation, a Delaware corporation, or, as applicable, its predecessor entities and, where appropriate, its wholly-owned subsidiaries.
Overview
We design, develop, manufacture and market general illumination products that exclusively use LEDs as their light source. Our broad product portfolio includes LED-based retrofit lamps (replacement bulbs) that can be used in existing light fixtures and sockets as well as purpose-built LED-based luminaires (light fixtures), for many common indoor and outdoor residential, commercial, industrial and public infrastructure lighting applications. Our proprietary technology, differentiated design approach and key relationships throughout the LED lighting supply chain position us well as general illumination continues its transition to the use of LEDs as a replacement for existing lighting technologies.
We are a technology integrator with intricate knowledge of each of the main component technologies used in our products. Our in-house design and development of power supplies, thermal management solutions and optical systems used in our products along with our detailed specification of the packaged LEDs we incorporate into our products, provides us with a distinctive ability to manage the interrelationships between these components and subsystems. This system-based approach, combined with our thorough understanding of the requirements of each lighting application our products are designed to address, enables us to provide a broader and more relevant range of products that we believe deliver industry-leading performance and offer shorter payback periods relative to the products of our competitors. The performance advantage of our products can be measured by the combination of higher efficacy, as calculated by lumens of light delivered per watt of power consumed, or lm/W, light quality and reliability. As we continue to improve all of these product attributes, we believe we will help drive, and benefit from, the accelerating use of LEDs in general illumination.
As a pioneer in our industry, we have been producing and selling LED-based lighting products for nearly a decade. We manufacture and assemble our products both internally and through our contract manufacturer in Asia. Our internal manufacturing operations are currently based in our Monterrey, Mexico site, which commenced production in November 2010, and our Satellite Beach, Florida headquarters. Our revenue for the year ended December 31, 2010 was $53.2 million, representing an increase of 69.5% as compared to the year ended December 31, 2009. In order to meet the recent and expected growth in demand for our products, we have increased our headcount, including contractors, to approximately 600 as of December 31, 2010 from 210 as of December 31, 2009.
Products and applications
Our extensive product portfolio includes three distinct product families (lamps; infrastructure luminaires; and commercial, architectural and residential luminaires), as well as custom lighting solutions. We tailor our product offerings to specific applications in our target markets which include: (i) government-owned and private infrastructure, (ii) schools and universities, (iii) retail and hospitality and (iv) residential and office.
1
Table of Contents
The LED retrofit lamps we produce are economically compelling replacements for traditional reflector and globe incandescent and incandescent halogen lamps and are available in a range of form factors and performance specifications to meet particular lighting needs. Our retrofit lamps have been adopted by leading retailers and original equipment manufacturers, or OEMs, of lighting products such as The Home Depot, Inc. and Osram Sylvania Inc. that sell our products on a co-branded or private label basis, as well as by large end-users to whom we sell directly and through distributors, such as Harrah’s Operating Company, Inc., Hilton Hotels Corporation, Simon Property Group, Inc. and Starbucks Corporation. Notably, we are The Home Depot’s preferred provider and product development partner for LED retrofit lamps and luminaires, which are currently sold under its EcoSmart® line on a co-branded basis. With sales of more than one million units during the second half of 2010 alone, we believe we are one of the largest worldwide suppliers of LED retrofit lamps. We also produced the first LED retrofit lamp to be successfully qualified for ENERGY STAR® designation and, as of March 25, 2011, we designed and produced 58 ENERGY STAR-qualified LED retrofit lamps.
The infrastructure luminaires we produce combine energy efficiency, long life, high lumen output and excellent light distribution, making them ideal for street lighting as well as for use in parking garages, outdoor areas, warehouses and manufacturing areas. These luminaires, which in many cases provide payback periods of less than two years, are sold for use in large-scale infrastructure projects including, among others, those in Dallas, Mexico City, Salt Lake City and Washington, D.C. We also offer a range of LED luminaires for the commercial, architectural and residential markets, including our line for retail display applications and our soon to be released line of residential luminaires. We sell these luminaires through OEMs, distributors, independent sales representatives and our direct sales force. In addition, we offer customized LED lighting solutions to create highly tailored lighting effects for architects, lighting designers and research projects.
Industry background
According to the U.S. Department of Energy, or the DOE, LEDs are the most promising technology for reducing the enormous amount of energy consumed by lighting, which it estimated to account for 25% of all U.S. electricity consumption in 2009. Currently available cool white LED lighting products boast an efficacy of as much as 92 lm/W and last as long as 50,000 hours while currently available warm white LED lighting products have an efficacy of as much as 66 lm/W. This compares to an efficacy of 13 lm/W and lifetime of 1,200 hours for a typical incandescent bulb and 55 lm/W and 10,000 hours for a typical compact fluorescent bulb. Importantly, as the relevant technology continues to improve, the efficiency advantage of LED lighting products will further increase. For example, a March 2010 study from the DOE projects that cool white LED luminaire efficacies will reach 121 lm/W in 2012 and 219 lm/W in 2020. We believe a significant portion of this improvement will be due to efficiencies gained in the areas core to our expertise rather than at the packaged LED level.
LEDs have a demonstrated history of rapid adoption in various applications when their total cost of ownership, including both purchase price and ongoing energy and maintenance costs, declines to a point that warrants their use. Reductions in total cost of ownership improve users’ return on investment in LED technology and shorten the payback period for LEDs relative to other lighting technologies. We expect that continuing improvements in LED product efficacy and light quality as well as reductions in their purchase price will further reduce the total cost of ownership for LED lighting products, accelerating their adoption for general illumination. The adoption of LED lighting in general illumination will also benefit from other attributes of LED lighting and evolving market factors. These include an increasing end-user focus on energy efficiency and environmental sustainability; greater demand for enhanced lighting functionality and design differentiation enabled by the smaller size, lower heat output, longer lifetime, dimmability, directionality and digital controllability of LED lighting products; greater government and utility financial incentives for energy efficient technologies; government regulations effectively eliminating incandescent bulb sales after certain deadlines in the United States and the European Union; and government support for energy efficient lighting.
2
Table of Contents
In light of these attributes and factors, the market for LED lighting is expected to grow rapidly. A March 2010 report by Strategies Unlimited estimated that the market for packaged LEDs used in general illumination was expected to be approximately $874.0 million in 2010, growing to over $4.3 billion by 2014, representing a compound annual growth rate of approximately 49%. For our retrofit lamps and luminaires, the cost of the packaged LEDs represent on average approximately 35% of their sales prices. Therefore, the estimated market for LED lighting products will be necessarily larger.
Our competitive strengths
We are a leading provider of LED retrofit lamps and luminaires for general illumination and believe the following competitive strengths have enabled us to achieve this position:
In-depth understanding of the lighting markets we serve. We have a deep understanding of how multiple components and subsystems function when integrated into LED lighting products under actual operating conditions, as well as knowledge of what attributes end-users truly value for each application our products address. This knowledge is derived from the experience of our management, sales and product development professionals, many of whom have spent the vast majority of their careers at traditional lighting companies and is solidified by our close collaboration with customers from product development through after-market support.
Extensive proprietary technology and know-how. We are a technology integrator with expertise in each of the key technologies used in our products including power supplies and controls, thermal management solutions, optical systems and LED technology. This expertise is complemented by a portfolio of 124 issued and pending U.S. patents that have been developed over the course of nearly a decade of operations.
Comprehensive system-based approach. We are focused on the profound impact the interrelationships between key components and subsystems have on the performance and cost of our products. Accordingly, we design and develop power supplies, thermal management solutions and optical systems used in our products and specify key attributes of the packaged LEDs we incorporate into our products enabling us to finely tune them to improve their interoperability. We do not believe our competitors have the combination of capabilities and organizational structure to duplicate our design approach.
Broad product portfolio sustained by rapid speed to market. Our modular approach to product development enables us to design and develop optimized components and subsystems that we use in multiple products while maintaining the flexibility to modify key attributes of these components and subsystems for the specific needs of individual applications. As a result, we believe we are able to cost-effectively design and commercialize a broader range of retrofit lamps and luminaires at a faster rate than many of our competitors. In addition, our ability to rapidly design key components and subsystems around newly introduced packaged LEDs is a key contributor to our speed to market with performance leading products. Given the rapid pace of LED technology improvement and inherent short product cycles, speed to market is a critical competitive advantage.
Broad market reach through established channels. Our retrofit lamp business benefits from key retailer and lighting OEM relationships, including with The Home Depot, the largest worldwide seller of light bulbs, and with Osram Sylvania, among others, for the sale of our products on a co-branded or private label basis. In addition, our direct sales force has the knowledge of lighting applications required to sell our retrofit lamps and luminaires directly to large end-users and is not impeded by conflict from legacy lighting businesses. We also maintain an established network of independent sales agents and distributors that expand our geographic coverage and offer support for large projects in the infrastructure and commercial and industrial end markets.
Flexible approach to component sourcing. The flexibility of our product designs and our ability to facilitate rapid design adjustments limit our dependence on any single technology or vendor in our supply chain. This latitude in our component sourcing, particularly for packaged LEDs, enables us to mitigate supply risk
3
Table of Contents
through a multi-sourcing strategy and enhances our pricing leverage. It also helps insulate us from potential technology changes that represent significant risk to less adaptable competitors.
Experienced personnel with proven ability to drive our strategies. Our long-standing focus on research and commercialization of LED lighting has been a guiding force in building our roster of talent. As a result, our senior management team consists of long-tenured lighting industry professionals as well as LED technology veterans. Our research and development team includes approximately 50 research scientists and engineers with Ph.D.s or Masters degrees in a range of disciplines relevant to the development of LED lighting products. Similarly, our sales and marketing team has prior experience in our markets and channels at traditional lighting companies.
Our strategies
Our objective is to leverage our leadership position in LED lighting products to become the leader in the overall lighting industry as LED adoption accelerates through the following strategies:
Improve our products while lowering their cost to sustain our market position. We will continue to enhance our products by accumulating improvements across all of our component and subsystem technologies and by availing ourselves of further efficiencies by way of their interoperation. These improvements will include innovations relating to new materials, designs and methods, which we believe will provide revolutionary, rather than evolutionary, gains in product performance and manufacturing cost. In addition, we will continue to rapidly optimize our technologies for the most recently introduced and typically higher efficacy packaged LEDs to which we often have early access. We also intend to develop products that incorporate the intelligent control enabled by solid state lighting to offer further reductions in cost of ownership and novel functionality to our customers.
Drive improvements in our manufacturing and supply chain operations. We are increasing production at our recently opened site in Monterrey, Mexico, as well as at our contract manufacturing partner in Asia to ensure that we have adequate capacity to meet future demand as well as to capture efficiencies that we expect will allow us to materially improve our profitability as we transfer high-volume manufacturing to these lower cost sites from our Satellite Beach, Florida facility. In addition, we are increasingly sourcing critical components and subsystems from suppliers closer to our points of manufacture, working with our customers to develop more robust demand forecasts and implementing new information technology systems to reduce lead times, expediting costs for inbound supplies and other operational inefficiencies.
Expand our market coverage. We will continue to invest in our sales channels to drive further adoption of LED general illumination as well as to improve our share of the market. This investment includes adding experienced lighting professionals to our direct sales force and enlarging the sales team that manages our retail and OEM partners to both help us develop new relationships and increase business with existing ones. We also plan to expand the professional sales team that manages our growing roster of independent sales agents and distributors for the infrastructure and commercial and industrial markets in order to provide them with better sales support. We are also focused on expanding our efforts in Europe and Asia as we introduce new products designed specifically for the requirements of those regions. In addition, we plan to take a leadership role in the establishment of rebate programs applicable to LED lighting which, while not necessary for the adoption of our products, has the potential to meaningfully accelerate the shift to LED lighting.
Expand our product offering to target further conventional lighting applications. We follow a disciplined approach to the expansion of our business, prioritizing only those applications for which we believe there are currently clear and compelling reasons from a return on investment and total cost of ownership perspective for a potential customer to adopt LED lighting. As the value proposition of LED lighting continues to improve, we will increase the range of applications that we target accordingly.
4
Table of Contents
Extend our technology to non-traditional markets. We plan to continue to develop products for novel applications beyond traditional lighting that can benefit from the unique properties of LED lighting. We believe these potential non-traditional markets help drive our culture of innovation as well as our understanding of LED technology. They may also represent material market opportunities in addition to their promising social benefits.
Risks that we face
Our business is subject to numerous risks, which are highlighted in the section entitled “Risk factors.” These risks represent challenges to the successful implementation of our strategy and to the growth and future profitability of our business. These risks include:
| • | We have a limited amount of revenues and a history of losses and negative cash flow. We may be unable to continue operations unless we can generate sufficient cash flow in the future. |
| • | If we are unable to manage any future growth effectively, our profitability and liquidity could be adversely affected. Further, if we are unable to adequately increase our production capacity, delays could harm our revenues and reputation. |
| • | If our developed technology or technology under development does not achieve market acceptance, prospects for our growth and profitability would be limited. Further, if we fail to anticipate and adapt to the rapid technological changes in the LED lighting industry, the products we sell could become obsolete. |
| • | We rely on our relationships with The Home Depot and Osram Sylvania and the loss of either of these relationships could have a material adverse effect on our financial results. |
| • | Our financial results may vary significantly from period-to-period, which may lead to volatility in our stock price. |
| • | Our industry is highly competitive and if we are not able to compete effectively, our prospects for future success will be jeopardized. |
| • | Failure to achieve or maintain effective internal controls could have a material adverse effect on our operations and our stock price. |
| • | We rely upon key members of our management team and other key personnel and a loss of key personnel could prevent or significantly delay the achievement of our goals. |
| • | Our international operations are subject to legal, political and economic risks. |
Pegasus Capital
We are controlled by affiliates of Pegasus Capital Advisors, L.P., or Pegasus Capital, a U.S.-based private equity fund manager that provides capital and strategic solutions to middle market companies across a variety of industries. Established in 1995, Pegasus Capital currently manages approximately $2.0 billion in assets through several private equity funds and has made more than 80 investments since its inception. Historically, Pegasus Capital has invested in our capital stock through LSGC Holdings LLC, Pegasus Partners IV, L.P., or Pegasus IV, and LED Holdings, LLC.
Corporate information
We were incorporated in the state of Delaware in 1988 and our business today is the result of the combination of the products, intellectual property and businesses of four LED lighting companies, namely: (i) Lighting Science Group Corporation, an early entrant and leader in the application of LEDs for general illumination; (ii) LED Effects, Inc., a California-based LED company specializing in the design, development
5
Table of Contents
and manufacturing of custom and architectural lighting systems, which was acquired in October 2007; (iii) Lighting Science Group, B.V., or LSGBV, formerly known as Lighting Partner B.V., a Netherlands-based manufacturer and marketer of LED retail shop lighting and other specialty LED lighting products, which was acquired in April 2008; and (iv) Lamina Lighting, Inc., or Lamina, a supplier of LED light engines and modules, which was acquired in July 2008. Our principal executive offices are located at 1227 South Patrick Drive, Building 2A, Satellite Beach, Florida 32937, and our telephone number is (321) 779-5520. Our website address is www.lsgc.com. This reference to our website is an inactive textual reference only and is not a hyperlink. The contents of our website are not part of this prospectus, and you should not consider the contents of our website in making an investment decision with respect to our common stock.
6
Table of Contents
| Common stock offered by us |
shares. |
| Common stock to be outstanding after this offering |
shares. |
| Use of proceeds |
We estimate that the net proceeds to us from this offering will be approximately $ million, based on an assumed public offering price of $ per share, which is the midpoint of the price range set forth on the cover page of this prospectus and after deducting underwriting discounts and commissions and estimated offering expenses payable by us. We intend to use the net proceeds from this offering to repay any existing indebtedness on our Wells Fargo line of credit and for general corporate purposes, including capital expenditures to expand our production capacity, investments in research and development, expansion of our sales force and working capital needs in support of our planned business activities. See “Use of proceeds” for additional information. |
| Over-allotment option |
We have granted the underwriters a 30-day option to purchase up to additional shares of our common stock from us at the public offering price. |
| Dividend policy |
We do not currently intend to pay any cash dividends on our common stock. See “Dividend policy.” |
| Risk factors |
You should carefully read and consider the information set forth in “Risk factors” beginning on page 9 of this prospectus and all other information included in this prospectus before investing in our common stock. |
| Proposed NASDAQ symbol |
LSGC |
The number of shares of our common stock outstanding after this offering is based on 185,549,963 shares outstanding as of December 31, 2010 after giving effect to the Subsequent Issuances described under “Capitalization” and excludes:
| • | 12,753,756 shares of common stock issuable upon the exercise of outstanding options under our Amended and Restated Equity-Based Compensation Plan, or the Equity Plan, as of December 31, 2010, at a weighted average exercise price of $1.38 per share; |
| • | 176,668 shares of common stock issuable upon the vesting of shares of restricted stock previously awarded under the Equity Plan as of December 31, 2010; |
| • | 14,523,744 shares of common stock reserved and available for future issuance under the Equity Plan as of December 31, 2010 (which gives effect to an 8,000,000 share increase on February 10, 2011); and |
| • | 14,789,424 shares of common stock issuable upon the exercise of outstanding warrants as of December 31, 2010, at a weighted average exercise price of $5.83 per share. |
7
Table of Contents
Summary consolidated financial data
The following table presents our summary consolidated financial data as of the dates and for the periods indicated. The summary consolidated financial data for the years ended December 31, 2010, 2009 and 2008 and as of December 31, 2010 are derived from our audited consolidated financial statements included elsewhere in this prospectus. Our historical results are not necessarily indicative of the results to be expected in any future period. You should read this summary consolidated financial data in conjunction with “Management’s discussion and analysis of financial condition and results of operations” and our consolidated financial statements and related notes included elsewhere in this prospectus.
| For the Years Ended December 31, | ||||||||||||
| 2010 | 2009 | 2008 | ||||||||||
| Consolidated Statements of Operations Data: |
||||||||||||
| Revenue |
$ | 53,169,013 | $ | 31,376,816 | $ | 20,758,593 | ||||||
| Cost of goods sold |
59,021,851 | 24,754,819 | 16,688,600 | |||||||||
| Gross margin (deficit) |
(5,852,838 | ) | 6,621,997 | 4,069,993 | ||||||||
| Operating expenses: |
||||||||||||
| Sales and marketing |
11,107,379 | 7,200,323 | 5,847,833 | |||||||||
| Operations |
4,834,592 | 8,165,066 | 6,453,867 | |||||||||
| Research and development (1) |
10,246,511 | 6,600,352 | 7,332,296 | |||||||||
| General and administrative |
17,753,656 | 20,753,513 | 23,224,561 | |||||||||
| Restructuring expenses (1) |
1,101,992 | 1,111,189 | — | |||||||||
| Impairment of goodwill and other long-lived assets |
11,548,650 | — | 53,110,133 | |||||||||
| Depreciation and amortization |
2,867,866 | 5,327,033 | 4,354,028 | |||||||||
| Total operating expenses |
59,460,646 | 49,157,476 | 100,322,718 | |||||||||
| Loss from operations |
(65,313,484 | ) | (42,535,479 | ) | (96,252,725 | ) | ||||||
| Total other expense |
(230,948,562 | ) | (6,014,450 | ) | (918,238 | ) | ||||||
| Loss before income tax benefit |
(296,262,046 | ) | (48,549,929 | ) | (97,170,963 | ) | ||||||
| Income tax benefit |
(1,123,107 | ) | (413,002 | ) | (2,207,507 | ) | ||||||
| Net loss |
(295,138,939 | ) | (48,136,927 | ) | (94,963,456 | ) | ||||||
| Dividend requirements |
||||||||||||
| 6% return on Series B Preferred Stock |
784,142 | 1,217,642 | — | |||||||||
| 8% return on Series C Preferred Stock |
213,610 | 266,400 | — | |||||||||
| Net loss attributable to common stock |
$ | (296,136,691 | ) | $ | (49,620,969 | ) | $ | (94,963,456 | ) | |||
| Net loss per weighted average common share: |
||||||||||||
| Basic and diluted |
$ | (6.69 | ) | $ | (1.69 | ) | $ | (3.55 | ) | |||
| Pro forma basic and diluted (2) |
$ | (2.85 | ) | $ | — | $ | — | |||||
| Pro forma basic and diluted as adjusted (3) |
||||||||||||
| Weighted average number of shares used to compute net loss per common share |
||||||||||||
| Basic and diluted |
44,274,077 | 29,352,585 | 26,781,431 | |||||||||
| Pro forma basic and diluted (2) |
104,064,363 | — | — | |||||||||
| Pro forma basic and diluted as adjusted (3) |
||||||||||||
| Net loss |
$ | (295,138,939 | ) | $ | (48,136,927 | ) | $ | (94,963,456 | ) | |||
| Foreign currency translation gain (loss) |
(912,296 | ) | (849,695 | ) | (1,886,544 | ) | ||||||
| Comprehensive loss |
$ | (296,051,235 | ) | $ | (48,986,622 | ) | $ | (96,850,000 | ) | |||
8
Table of Contents
| As of December 31, 2010 | ||||||||||||
| Actual | Pro Forma (2) |
As Adjusted (3) |
||||||||||
| Consolidated Balance Sheet Data: |
||||||||||||
| Cash |
14,489,700 | 32,489,700 | ||||||||||
| Working capital (4) |
11,178,922 | 23,939,259 | ||||||||||
| Total assets |
72,493,363 | 90,493,363 | ||||||||||
| Total liabilities |
47,811,852 | 47,811,852 | ||||||||||
| Total shareholders’ equity |
24,681,511 | 42,681,511 | ||||||||||
| (1) | During 2010, we modified the presentation of our operating expenses to separately convey research and development and restructuring expenses in our consolidated statement of operations and comprehensive loss. This table reflects management’s modified presentation for all periods presented. |
| (2) | Gives pro forma effect to the Subsequent Issuances described under “Capitalization.” |
| (3) | The pro forma as adjusted data gives effect to the Subsequent Issuances and our issuance and sale of shares of our common stock in this offering at an assumed public offering price of $ per share, which is the midpoint of the price range set forth on the cover page of this prospectus and after deducting underwriting discounts and commissions and estimated offering expenses payable by us. If the underwriters’ over-allotment option to purchase additional shares of common stock from us in this offering is exercised in full, we estimate that we will receive additional net proceeds of approximately $ million. Each $1.00 increase (decrease) in the assumed public offering price of $ per share would increase (decrease) each of cash, working capital, total assets and total stockholders’ equity by $ million after deducting underwriting discounts and commissions and estimated offering expenses payable by us and assuming that the number of shares offered by us in this offering, as set forth on the cover page of this prospectus, remains the same. Each increase (decrease) of 1.0 million in the number of shares offered by us in this offering would increase (decrease) each of cash, working capital, total assets and total stockholders’ equity by $ million, after deducting underwriting discounts and commissions and estimated offering expenses payable by us and assuming a public offering price of $ per share, which is the midpoint of the price range set forth on the cover page of this prospectus. |
| (4) | Working capital is defined as our current assets minus current liabilities. |
9
Table of Contents
This offering and an investment in our common stock involve a high degree of risk. You should carefully consider the risks described below, together with the financial and other information contained in this prospectus, before you decide to purchase shares of our common stock. If any of the following risks actually occurs, our business, financial condition, results of operations, cash flows and prospects could be materially and adversely affected. As a result, the trading price of our common stock could decline and you could lose all or part of your investment in our common stock.
Risks related to our business and industry
We have a limited amount of revenues and a history of losses and may be unable to continue operations unless we can generate sufficient operating income from the sale of our products.
We have sustained operating losses since our inception. For the years ended December 31, 2010 and 2009, we had revenues of $53.2 million and $31.4 million, respectively, and net losses of $295.1 million and $48.1 million, respectively. As of December 31, 2010 and 2009, we had accumulated deficits of $443.1 million and $148.0 million, respectively. As evidenced by these financial results, we may not be able to achieve or maintain profitability on a consistent basis. Continuing losses may exhaust our capital resources and force us to discontinue our operations.
We have yet to achieve positive cash flow, and our ability to generate positive cash flow is uncertain. If we are unable to obtain sufficient capital when needed, our business and future prospects will be adversely affected and we could be forced to suspend or discontinue operations.
Our operations have not generated positive cash flow for any reporting period since our inception, and we have funded our operations primarily through the issuance of common and preferred stock and short-term debt. Our limited operating history makes an evaluation of our future prospects difficult. The actual amount of funds that we will need to meet our operating needs will be determined by a number of factors, many of which are beyond our control. These factors include the timing and volume of sales transactions, the success of our marketing strategy, market acceptance of our products, the success of our manufacturing and research and development efforts (including any unanticipated delays), the costs associated with obtaining and enforcing our intellectual property rights, regulatory changes, competition, technological developments in the market, evolving industry standards and the amount of working capital investments we are required to make.
Our ability to continue to operate until our cash flow from operations turns positive will depend on our ability to continue to raise funds through public or private sales of shares of our capital stock or through debt. We currently have an asset-based lending facility with Wells Fargo Bank, N.A., which we refer to as the Wells Fargo line of credit, which provides us with borrowing capacity of up to a maximum of $15.0 million calculated as up to 85% of our applicable and eligible inventory and accounts receivable plus qualified cash. The Wells Fargo line of credit has an initial term that expires on November 22, 2013. As of December 31, 2010, the balance outstanding on the Wells Fargo line of credit was approximately $4.7 million and we had approximately $9.5 million of additional borrowing capacity. In addition, we have a working capital facility with IFN Finance B.V., or IFN Finance, and a revolving line of credit with ABN AMRO Bank N.V., or ABN AMRO, that provide up to $2.0 million and $265,000, respectively, to our Netherlands based operations. As of December 31, 2010, the outstanding balances on the IFN Finance and ABN AMRO facilities were $1.2 million and $226,000, respectively. Other than these facilities, we do not have any committed sources of outside capital at this time.
During the recent economic downturn, we experienced limited access to the capital and credit markets, and it remains uncertain whether we will be able to obtain outside capital when we need it or on terms that would be acceptable to us. In the past we have primarily relied on, and currently rely on, financing or guaranties from affiliates of Pegasus Capital. There are no assurances that such related parties will continue to provide financing
10
Table of Contents
on terms that are acceptable to us or at all. If we raise funds by selling additional shares of our common stock or securities convertible or exercisable into our common stock, the ownership interest of our existing stockholders will be diluted. If we are unable to obtain sufficient outside capital when needed, our business and future prospects will be adversely affected and we could be forced to suspend or discontinue operations.
If we are unable to manage any future growth effectively, our profitability and liquidity could be adversely affected.
Our growth is expected to place significant strain on our limited research and development, sales and marketing, operational and administrative resources. To manage any future growth, we must continue to improve our operational and financial systems and expand, train and manage our employee base. We also need to improve our supply chain management and quality control operations and hire and train new employees, including sales and customer service representatives and operations managers. If we are unable to manage our growth effectively, our profitability and liquidity could be adversely affected.
If the transition we are currently making to Enterprise Resource Planning systems encounters delays or difficulties similar to those encountered by other companies, the resulting problems could negatively affect our business.
We are increasingly dependent on information technology, including an ongoing transition to Enterprise Resource Planning, or ERP, systems, to enable us to improve the effectiveness of our operations and to maintain financial accuracy and efficiency. A number of other companies have experienced delays and difficulties with the implementation of ERP systems that have had a negative effect on their business. If we do not allocate and effectively manage the resources necessary to build, implement and sustain the proper technology infrastructure, or if our ERP transition encounters delays or difficulties, we could be subject to transaction errors, processing inefficiencies, loss of customers, business disruptions or loss of or unauthorized access to our intellectual property through security breaches.
If our developed technology or technology under development does not achieve market acceptance, prospects for our growth and profitability would be limited.
Our future success depends on market acceptance of our LED technology and the technology currently under development. Although adoption of LED lighting has grown in recent years, adoption of LED lighting products for general illumination has only recently begun, is still limited and faces significant challenges. Potential customers may be reluctant to adopt LED lighting products as an alternative to traditional lighting technology because of its higher initial cost or perceived risks relating to its novelty, reliability, usefulness, light quality and cost-effectiveness when compared to other established lighting sources available in the market. Changes in economic and market conditions may also affect the marketability of some traditional lighting technologies such as declining energy prices that favor existing lighting technologies that are less energy efficient. Moreover, if existing sources of light other than LED lighting products achieve or maintain greater market adoption, or if new sources of light are developed, our current products and technologies could become less competitive or obsolete. Even if LED lighting products continue to achieve performance improvements and cost reductions, limited customer awareness of the benefits of LED lighting products, lack of widely accepted standards governing LED lighting products and customer unwillingness to adopt LED lighting products in favor of entrenched solutions could significantly limit the demand for LED lighting products and adversely impact our results of operations.
Lighting products, particularly emerging LED lighting products, are subject to rapid technological changes. If we fail to accurately anticipate and adapt to these changes, the products we sell will become obsolete, causing a decline in our sales and profitability.
LED lighting products are subject to rapid technological changes that often cause product obsolescence. Companies within the LED lighting industry are continuously developing new products with heightened performance and functionality. This puts pricing pressure on existing products and constantly threatens to make
11
Table of Contents
them, or causes them to be, obsolete. Our typical product’s life cycle is extremely short, generating lower average selling prices as the cycle matures. If we fail to accurately anticipate the introduction of new technologies, we may possess significant amounts of obsolete inventory that can only be sold at substantially lower prices and profit margins than we anticipated. In addition, if we fail to accurately anticipate the introduction of new technologies or are unable to develop the planned new technologies, we may be unable to compete effectively due to our failure to offer products most demanded by the marketplace. If any of these failures occur, our sales, profit margins and profitability will be adversely affected.
If we are unable to increase production capacity for our products in a cost effective and timely manner, we may incur delays in shipment and our revenues and reputation in the marketplace could be harmed.
An important part of our business plan is the expansion of production capacity for our products. In order to fulfill anticipated demand for our products, we invest in capacity in advance of actual customer orders, typically based on preliminary, non-binding indications of future demand. As customer demand for our products changes, we must be able to adjust our production capacity to meet demand while keeping costs down. We intend to expand our operations by increasing production at our recently opened manufacturing facility in Monterrey, Mexico, which may subject us to additional risks as we first scale these operations. We also expect to rely more heavily on international contract manufacturing. Uncertainty is inherent within our facility and capacity expansion, and unforeseen circumstances could offset the anticipated benefits, disrupt our ability to provide products to our customers and impact product quality.
Our ability to successfully increase production capacity in a cost effective and timely manner will depend on a number of factors, including the following:
| • | our ability to successfully scale our recently opened manufacturing facility in Monterrey, Mexico; |
| • | our ability to transition production between manufacturing facilities; |
| • | the ability of contract manufacturers to allocate more of their existing capacity to us or their ability to add new capacity quickly; |
| • | the ability of any future contract manufacturers to successfully implement our manufacturing processes; |
| • | the availability of critical components and subsystems used in the manufacture of our products; |
| • | our ability to effectively establish adequate management information systems, financial controls and supply chain management and quality control procedures; and |
| • | the occurrence of equipment failures, power outages, environmental risks or variations in the manufacturing process. |
If we are unable to increase production capacity for our products in a cost effective and timely manner while maintaining adequate quality, we may incur delays in shipment or be unable to meet increased demand for our products which could harm our revenues and operating margins and damage our reputation and our relationships with current and prospective customers. Conversely, due to the proportionately high fixed cost nature of our business (such as facility expansion costs), if demand does not increase at the rate forecasted, we may not be able to reduce manufacturing expenses or overhead costs at the same rate as demand decreases, which could also result in lower margins and adversely impact our business and results of operations.
We rely on our relationships with The Home Depot and Osram Sylvania, and the loss of a material relationship with either of them would have a material adverse effect on our results of operations, our future growth prospects and our ability to distribute our products.
We form business relationships and strategic alliances with retailers and other lighting companies to market our products under private or co-branded labels. In certain cases, such relationships are important to the introduction of new products and services, and we may not be able to successfully collaborate or achieve expected synergies with these retailers or lighting companies. We do not control these retailers or lighting
12
Table of Contents
companies and they may make decisions regarding their business undertakings with us that may be contrary to our interests, or may terminate their relationships with us altogether. In addition, if these retailers or lighting companies change their business strategies, we may fail to maintain these relationships.
For the year ended December 31, 2010, Osram Sylvania and The Home Depot accounted for 44% and 12% of our net sales, respectively. Our Master Supply Agreement with Osram Sylvania has an initial term that expires in April 2013 but may be terminated earlier by Osram Sylvania in certain instances, including upon a change of control or in the event of a default by us. Our contractual commitment with The Home Depot is also not long term in nature. Specifically, our Strategic Purchasing Agreement with The Home Depot has an initial term that expires in July 2013 but may be terminated by The Home Depot for any reason upon 180 days written notice to us. The Home Depot has required, and we expect will continue to require, increased service and order accommodations as well as incremental promotional investments. We may face increased expenses to meet these demands, which would reduce our margins. In addition, we generally have little or no influence on The Home Depot’s promotional or pricing policies, which may impact our sales volume to them. In addition, neither our Master Supply Agreement with Osram Sylvania nor our Strategic Purchasing Agreement with The Home Depot requires either party to purchase a minimum quantity of products from us, although we issued a Warrant to The Home Depot that included incentive-based vesting conditions through 2015 based on annual 20% increases in product purchases made under the Strategic Purchasing Agreement. Our sales are materially affected by fluctuations in the buying patterns of these customers and such fluctuations may result from general economic conditions or other factors. A loss of Osram Sylvania or The Home Depot as a customer or a significant decline in their purchases would have a material adverse effect on our results of operations, our future growth prospects and our ability to distribute our products.
We manufacture and assemble certain of our products and our sales, results of operations and reputation could be materially adversely affected if there is a disruption at our assembly and manufacturing facilities.
Our assembly and manufacturing operations for our products are based in Satellite Beach, Florida and Monterrey, Mexico. The operation of these facilities involves many risks, including equipment failures, natural disasters, industrial accidents, power outages and other business interruptions. We could incur significant costs to maintain compliance with, or due to liabilities under, environmental laws and regulations, the violation of which could lead to significant fines and penalties. Although we carry business interruption insurance and third-party liability insurance to cover certain claims in respect of personal injury or property or environmental damage arising from accidents on our properties or relating to our operations, our existing insurance coverage may not be sufficient to cover all risks associated with our business. As a result, we may be required to pay for financial and other losses, damages and liabilities, including those caused by natural disasters and other events beyond our control, out of our own funds, which could have a material adverse effect on our business, financial condition and results of operations. Additionally, any interruption in our ability to assemble, manufacture or distribute our products could result in lost sales, limited revenue growth and damage to our reputation in the market, all of which would adversely affect our business.
Additionally, we rely on arrangements with independent shipping companies, such as United Parcel Service, Inc. and Federal Express Corp., for the delivery of certain components and subsystems from vendors and products to our customers in both the United States and abroad. The failure or inability of these shipping companies to deliver components, subsystems or products timely, or the unavailability of their shipping services, even temporarily, could have a material adverse effect on our business. We may also be adversely affected by an increase in freight surcharges due to rising fuel costs or added security.
We utilize a contract manufacturer to manufacture certain of our products and any disruption in this relationship may cause us to fail to meet our customers’ demands and may damage our customer relationships.
Although we manufacture and assemble certain of our products, we currently depend on Citizen Electronics Co., Ltd., or Citizen Electronics, as a contract manufacturer to manufacture a portion of our products in Asia.
13
Table of Contents
This manufacturer provides the necessary facilities and labor to manufacture these products, which are primarily high volume products and components that we intend to distribute to customers in regions outside of North America. Our reliance on a contract manufacturer involves certain risks, including the following:
| • | lack of direct control over production capacity and delivery schedules; |
| • | risk of equipment failures, natural disasters, industrial accidents, power outages and other business interruptions; |
| • | lack of direct control over quality assurance and manufacturing yield; and |
| • | risk of loss of inventory while in transit. |
If our contract manufacturer were to terminate its arrangements with us or fail to provide the required capacity and quality on a timely basis, we would experience delays in the manufacture and shipment of our products until alternative manufacturing services could be contracted or offsetting internal manufacturing processes could be implemented. For example, our contract manufacturer produces certain of our products in Japan, which recently experienced a significant earthquake and tsunami. As a result, one of the manufacturing facilities used to manufacture our products was shut down temporarily, and our contract manufacturer was forced to make alternative arrangements to manufacture such products. Any significant shortages or interruption may cause us to be unable to timely deliver sufficient quantities of our products to satisfy our contractual obligations and particular revenue expectations. Moreover, even if we timely locate substitute products and their price materially exceeds the original expected cost of such products, then our margins and results of operations would be adversely affected.
To qualify a new contract manufacturer, familiarize it with our products, quality standards and other requirements, and commence volume production may be a costly and time-consuming process. If we are required or choose to change contract manufacturers for any reason, our revenue, gross margins and customer relationships could be adversely affected.
Our industry is highly competitive and if we are not able to compete effectively, including against larger lighting manufacturers with greater resources, our prospects for future success will be jeopardized.
Our industry is highly competitive. We face competition from both traditional lighting technologies provided by numerous vendors as well as from LED-based lighting products provided by a growing roster of industry participants. The LED lighting industry is characterized by rapid technological change, short product lifecycles and frequent new product introductions, and a competitive pricing environment. These characteristics increase the need for continual innovation and provide entry points for new competitors as well as opportunities for rapid share shifts.
Currently, we view our primary competition to be from large, established companies in the traditional general lighting industry. Certain of these companies also provide, or have undertaken initiatives to develop, LED lighting products as well as other energy efficient lighting products. Additionally, we face competition from a fragmented universe of smaller niche or low-cost offshore providers of LED lighting products. We also anticipate that larger LED chip manufacturers, including some of those that currently supply us, may seek to compete with us by introducing more complete retrofit lamps or luminaires. We also expect other large technology players with packaged LED chip technology that are currently focused on other end markets for LEDs, such as backlighting for LCD displays, to increasingly focus on the general illumination market as their existing markets saturate and LED use in general illumination grows. In addition, we may compete in the future with vendors of new technological solutions for energy efficient lighting.
Some of our current and future competitors are larger companies with greater resources to devote to research and development, manufacturing and marketing, as well as greater brand name recognition. Some of our more diversified competitors could also compete more aggressively with us by subsidizing losses in their LED lighting businesses with profits from other lines of business. Moreover, if one or more of our competitors or
14
Table of Contents
suppliers were to merge with one another, the change in the competitive landscape could adversely affect our customer, channel or supplier relationships, or our competitive position. Additionally, any loss of a key channel partner, whether to a competitor or otherwise, could severely and rapidly damage our competitive position. To the extent that competition in our markets intensifies, we may be required to reduce our prices in order to remain competitive. If we do not compete effectively, or if we reduce our prices without making commensurate reductions in our costs, our net sales and profitability, and our future prospects for success, may be harmed.
If we do not properly anticipate the need for critical raw materials, components and subsystems, we may be unable to meet the demands of our customers and end-users, which could reduce our competitiveness, cause a decline in our market share and have a material adverse effect on our results of operations.
The lighting industry is subject to significant fluctuations in the availability of raw materials, components and subsystems. We depend on our suppliers for certain standard electronic components as well as custom components critical to the manufacture of our lighting devices. The principal raw materials and components used in the manufacture of our products are packaged LEDs and printed circuit boards, MOSFETS, magnetic and standard electrical components such as capacitors, resistors and diodes, wire, plastics for optical systems and aluminum for housings and heat sinks. We currently rely on a select number of suppliers for packaged LEDs used in the production of our products. From time to time, packaged LEDs and electronic components have been in short supply due to demand and production constraints. We depend on our vendors to supply in a timely manner critical components and subsystems in adequate quantities and consistent quality and at reasonable costs. Certain of these vendors operate out of Japan, and as a result of the effects of the earthquake and tsunami that recently occurred in Japan, these vendors may be unable to deliver sufficient quantities of components or subsystems or may be unable to deliver components or subsystems in a timely manner, which could have a material adverse affect on our results of operations. Finding a suitable alternate supply of required components and subsystems that meet our strict specifications and obtaining them in needed quantities may be a time-consuming process, and we may not be able to find an adequate alternative source of supply at an acceptable cost. Any significant interruption in the supply of these raw materials, components and subsystems could have a material adverse effect on our results of operations.
Our financial results may vary significantly from period-to-period due to unpredictable sales cycles in certain of the markets into which we sell our products, and changes in the mix of products we sell during a period, which may lead to volatility in our stock price.
The size and timing of our revenue from sales to our customers is difficult to predict and is market dependent. Our sales efforts often require us to educate our customers about the use and benefits of our products, including their technical and performance characteristics. We spend substantial amounts of time and money on our sales efforts and there is no assurance that these investments will produce any sales within expected time frames or at all. Given the potentially large size of purchase orders for our products, particularly in the infrastructure market, the loss of or delay in the signing of a customer order could significantly reduce our revenue in any period. Our revenues in each period may also vary significantly as a result of purchases, or lack thereof, by The Home Depot, Osram Sylvania or other significant customers. Because most of our operating and capital expenses are incurred based on the estimated number of product purchases and their timing, they are difficult to adjust in the short term. As a result, if our revenue falls below our expectations or is delayed in any period, we may not be able to proportionately reduce our operating expenses or manufacturing costs for that period, and any reduction of manufacturing capacity could have long-term implications on our ability to accommodate future demand.
Our profitability from period-to-period may also vary significantly due to the mix of products that we sell in different periods. As we expand our business we expect to sell more retrofit lamps and luminaires into additional target markets. These products are likely to have different cost profiles and will be sold into markets governed by different business dynamics. Consequently, sales of individual products may not necessarily be consistent across periods, which could affect product mix and cause gross and operating profits to vary significantly. As a result of
15
Table of Contents
these factors, we believe that quarter-to-quarter comparisons of our operating results are not necessarily meaningful and that these comparisons cannot be relied upon as indicators of future performance.
Our products may contain defects that could reduce sales, result in costs associated with the recall of those items and result in claims against us.
The manufacture of our products involves highly complex processes. Despite testing by us and our customers, defects have been and could be found in our existing or future products. These defects may cause us to incur significant warranty, support and repair costs, and costs associated with recall may divert the attention of our engineering personnel from our product development efforts and harm our relationships with customers and our reputation in the marketplace. We generally provide a five year warranty on our products, and such warranty may require us to repair, replace or reimburse the purchaser for the purchase price of the product, at the customer’s discretion. Moreover, even if our products meet standard specifications, our customers may attempt to use our products in applications they were not designed for or in products that were not designed or manufactured properly, resulting in product failures and creating customer dissatisfaction. These problems could result in, among other things, a delay in the recognition or loss of revenues, loss of market share or failure to achieve market acceptance. Defects, integration issues or other performance problems in our products could also result in personal injury or financial or other damages to our customers for which they might seek legal recourse against us. We may be the target of product liability lawsuits and could suffer losses from a significant product liability judgment against us if the use of our products at issue is determined to have caused injury. A significant product recall or product liability case could also result in adverse publicity, damage to our reputation and a loss of customer confidence in our products and adversely affect our results of operations.
If we are unable to obtain and protect our intellectual property rights, our ability to commercialize our products could be substantially limited.
As of February 7, 2011, we had filed 143 U.S. patent applications covering various inventions related to the design and manufacture of LED lighting technology. From these applications, 89 U.S. patents had been issued, 35 were pending approval and 19 were no longer active. When we believe it is appropriate and cost effective, we make corresponding international, regional or national filings to pursue patent protection in other parts of the world. Our patent applications may not be granted. Because patents involve complex legal, technical and factual questions, the issuance, scope, validity and enforceability of patents cannot be predicted with certainty. Competitors may develop products similar to our products that do not conflict with our patent rights. Others may challenge our patents and, as a result, our patents could be narrowed or invalidated. In some cases, we may rely on confidentiality agreements or trade secret protections to protect our proprietary technology. Such agreements, however, may not be honored and particular elements of our proprietary technology may not qualify as protectable trade secrets under applicable law. In addition, others may independently develop similar or superior technology, and in the absence of applicable prior patents, we would have no recourse against them.
Our business may be impaired by claims that we, or our customers, infringe intellectual property rights of others.
Our industry is characterized by vigorous protection and pursuit of intellectual property rights. These traits have resulted in significant and often protracted and expensive litigation. In addition, we may inadvertently infringe on patents or rights owned by others and licenses might not be available to us on reasonable or acceptable terms or at all. Litigation to determine the validity of patents or claims by third parties of infringement of patents or other intellectual property rights could result in significant legal expense and divert the efforts of our technical personnel and management, even if the litigation results in a determination favorable to us. Third parties have and may in the future attempt to assert infringement claims against us, or our customers, with respect to our products. In the event of an adverse result in such litigation, we could be required to pay substantial damages; stop the manufacture, use and sale of products found to be infringing; incur asset impairment charges;
16
Table of Contents
discontinue the use of processes found to be infringing; expend significant resources to develop non-infringing products or processes; or obtain a license to use third party technology and whether or not the result is adverse to us, we may have to indemnify our customers if they were brought into the litigation.
Failure to achieve and maintain effective internal controls could have a material adverse effect on our operations and our stock price.
We are subject to Section 404 of the Sarbanes-Oxley Act of 2002, which requires an annual management assessment of the effectiveness of our internal control over financial reporting. Effective internal controls are necessary for us to produce reliable financial reports, and failure to achieve and maintain effective internal controls over financial reporting could cause investors to lose confidence in our operating results, and could have a material adverse effect on our business and on the price of our common stock. Because of our status as a smaller reporting company registrant as defined in Rule 12b-2 of the Securities Exchange Act of 1934, as amended, or the Exchange Act, the independent registered public accounting firm auditing our financial statements has not been required to attest to, and report on, the effectiveness of our internal control over financial reporting. After the consummation of this offering, our filing status may change so that our independent registered public accounting firm may be required to attest to, and report on, the effectiveness of our internal control over financial reporting in our Form 10-K for the year ending December 31, 2011.
During the evaluation of disclosure controls and procedures for the years ended December 31, 2010, 2009 and 2008, we concluded that our disclosure controls and procedures were not effective in reaching a reasonable level of assurance of achieving management’s desired controls and procedures objectives in our internal control over financial reporting. We believe that many of the observed material weaknesses result from our transition from a small company with immature processes and inadequate staffing in our financial accounting and reporting functions to one that is growing rapidly and must now enhance our reporting and control standards to accommodate this growth.
Although we have not yet remediated all of the identified weaknesses, the following are among the key actions taken:
| • | the hiring of a corporate controller with Securities and Exchange Commission, or SEC, reporting experience in August 2009 and a Chief Financial Officer with SEC reporting experience in August 2010; |
| • | the initiation of an ongoing process to develop policies and procedures over all critical financial reporting and accounting cycles; |
| • | the completion of the first phase of implementation of new ERP system including the financials and order-to-cash modules designed to automate and systemize certain internal controls over financial reporting; |
| • | the standardization of the U.S. chart of accounts of our general ledger across different locations; and |
| • | the implementation of a management system designed to automate and systemize internal control over inventory. |
Additional measures will be necessary to complete the remediation of our internal controls. We plan to continue to assess our internal controls and procedures and intend to take further action as necessary or appropriate to address any other matters we identify. The process of designing and implementing effective internal controls and procedures is a continuous effort, however, that requires us to anticipate and react to changes in our business and economic and regulatory environments. Additionally, we or our independent registered public accounting firm may identify additional weaknesses. The steps we have taken, or may subsequently take, may not have been or be sufficient to fully remediate the material weakness identified or ensure that our internal controls are effective. Complying with these requirements may place a strain on our personnel, information technology systems and resources and divert management’s attention from other business
17
Table of Contents
concerns. We may need to hire, at a material expense to us, additional accounting and financial staff with appropriate public company experience and technical accounting knowledge as part of the remediation of our material weakness or otherwise.
Certification and compliance are important to adoption of our lighting products, and failure to obtain such certification or compliance would harm our business.
We are required to comply with certain legal requirements governing the materials used in our products. Although we are not aware of any efforts to amend existing legal requirements or implement new legal requirements in a manner with which we cannot comply, our revenue might be materially harmed if such changes were to occur. Moreover, although not legally required to do so, we strive to obtain certification for substantially all of our products. In the United States, we seek, and to date have obtained, certification for substantially all of our products from Underwriters’ Laboratories, Inc., or UL®. We design our products to be UL/cUL and Federal Communications Commission, or FCC, compliant. We had also obtained ENERGY STAR qualification for 58 of our products as of March 25, 2011. Although we believe that our broad knowledge and experience with electrical codes and safety standards have facilitated certification approvals, we cannot be certain that we will be able to obtain any such certifications for our new products or that, if certification standards are amended, we will be able to maintain any such certifications for our existing products, especially since virtually all existing codes and standards were not created with LED lighting products in mind. The failure to obtain such certifications or compliance would harm our business.
The reduction or elimination of investments in, or incentives to adopt, LED lighting or the elimination of, or changes in, policies, incentives or rebates in certain states or countries that encourage the use of LEDs over some traditional lighting technologies could cause the growth in demand for our products to slow, which could materially and adversely affect our revenues, profits and margins.
We believe the near-term growth of the LED market will be accelerated by government policies in certain countries that either directly promote the use of LEDs or discourage the use of some traditional lighting technologies. Today, the upfront cost of LED lighting exceeds the upfront cost for some traditional lighting technologies that provide similar lumen output in many applications. However, some governments around the world have used policy initiatives to accelerate the development and adoption of LED lighting and other non-traditional lighting technologies that are seen as more environmentally friendly compared to some traditional lighting technologies. Reductions in (including as a result of any budgetary constraints), or the elimination of, government investment and favorable energy policies could result in decreased demand for our products and decrease our revenues, profits and margins. Further, if our products fail to qualify for any financial incentives or rebates provided by governmental agencies or utilities for which our competitors’ products qualify, such programs may diminish or eliminate our ability to compete by offering products at lower prices than our competitors.
We rely upon key members of our management team and other key personnel and a loss of key personnel could prevent or significantly delay the achievement of our goals.
Our success will depend to a large extent on the abilities and continued services of key members of our management team including Richard Weinberg, John Stanley, Frederic Maxik and Greg Kaiser, as well as other key personnel. The loss of these key members of our management team or other key personnel could prevent or significantly delay the implementation of our business plan, research and development and marketing efforts. In particular, Frederic Maxik is critical to our research and development efforts. If we continue to grow, we will need to add additional management and other personnel. Zachary Gibler, our former Chairman and Chief Executive Officer, passed away on January 2, 2011, and this loss heightened the significance of our remaining executive team. Mr. Weinberg agreed to serve as Chief Executive Officer on an interim basis, and we are currently searching for a permanent Chief Executive Officer. Competition for experienced executives and employees in our industry can be intense. Our success will depend on our ability to attract and retain highly skilled personnel, including a permanent Chief Executive Officer, and our efforts to obtain or retain such personnel may not be successful.
18
Table of Contents
Our international operations are subject to legal, political and economic risks.
Our financial condition, operating results and future growth could be significantly affected by risks associated with our international activities, including economic and labor conditions, political instability, laws (including U.S. taxes on foreign subsidiaries), changes in the value of the U.S. dollar versus foreign currencies, differing business cultures, foreign regulations that may conflict with domestic regulations, intellectual property protection and trade secret risks, differing contracting process including the ability to enforce agreements, increased dependence on foreign manufacturers, shippers and distributors and import and export restrictions and tariffs.
Compliance with U.S. and foreign laws and regulations that apply to our international operations, including import and export requirements, anti-corruption laws, including the Foreign Corrupt Practices Act, tax laws (including U.S. taxes on foreign subsidiaries), foreign exchange controls, anti-money laundering and cash repatriation restrictions, data privacy requirements, labor laws and anti-competition regulations, increases the costs of doing business in foreign jurisdictions, and any such costs, which may rise in the future as a result of changes in these laws and regulations or in their interpretation. We have not implemented formal policies and procedures designed to ensure compliance with these laws and regulations. Any such violations could individually or in the aggregate materially adversely affect our reputation, financial condition or operating results.
Our debt obligations contain restrictions that impact our business and expose us to risks that could adversely affect our liquidity and financial condition.
On November 22, 2010, we entered into the Wells Fargo line of credit. The Wells Fargo line of credit has a term of three years and provides us with borrowing capacity of up to a maximum of $15.0 million, calculated as up to 85% of our applicable and eligible inventory and accounts receivable plus qualified cash. As of December 31, 2010, the balance outstanding on the Wells Fargo line of credit was approximately $4.7 million and we had approximately $9.5 million of additional borrowing capacity. Under the line of credit, we are required to pay certain fees to Wells Fargo, including an unused line fee ranging from 0.375% to 1.0% of the unused portion of the line of credit. Outstanding loans may be prepaid without penalty or premium, except that we are required to pay a termination fee ranging from $75,000 to $300,000 (depending on the date of termination) if the line of credit is terminated by us prior to the scheduled maturity date or by Wells Fargo during a default period.
Borrowings under the Wells Fargo line of credit are secured by substantially all of our assets other than equipment and real property.
All of our existing and future domestic subsidiaries are required to guaranty our obligations and pledge their assets to secure the repayment of our obligations under the Wells Fargo line of credit. The Wells Fargo line of credit contains customary covenants, which limit our and certain of our subsidiaries’ ability to, among other things:
| • | incur additional indebtedness or guarantee indebtedness of others; |
| • | create liens on our assets; |
| • | enter into mergers or consolidations; |
| • | dispose of assets; |
| • | prepay indebtedness or make changes to our governing documents and certain of our agreements; |
| • | pay dividends or make other distributions on our capital stock, redeem or repurchase our capital stock; |
| • | make investments, including acquisitions; and |
| • | enter into transactions with affiliates. |
19
Table of Contents
We are also required to maintain minimum excess borrowing availability of $4.0 million and would be required to comply with certain specified EBITDA requirements in the event that we have less than $6.0 million available for borrowing on the Wells Fargo line of credit. The Wells Fargo line of credit also contains customary events of default and affirmative covenants.
If we are unable to generate sufficient cash flow or otherwise obtain the funds necessary to make required payments under the Wells Fargo line of credit, or if we fail to comply with the requirements of our indebtedness, we could default under the Wells Fargo line of credit. Any default that is not cured or waived could result in the acceleration of the obligations under the Wells Fargo line of credit, an increase in the applicable interest rate under the Wells Fargo line of credit and a requirement that our subsidiaries that have guaranteed the Wells Fargo line of credit pay the obligations in full, and would permit our lender to exercise remedies with respect to all of the collateral securing the Wells Fargo line of credit, including substantially all of our and our subsidiary guarantors’ assets. Any such default could have a material adverse effect on our liquidity and financial condition. Additionally, the covenants in such agreement or future debt agreements may restrict the conduct of our business, which could adversely affect our business by, among other things, limiting our ability to take advantage of financings, mergers, acquisitions and other corporate opportunities that may be beneficial to the business.
The process of integrating businesses we acquire or our inability to successfully integrate businesses we acquire could have adverse consequences on our business.
Acquisitions may result in greater administrative burdens and operating costs and, to the extent financed with debt, additional interest costs. We may not be able to manage or integrate any acquired companies or businesses successfully. The process of integrating acquired businesses may be disruptive to our business and may cause an interruption of, or a loss of momentum in, our business as a result of the following factors, among others:
| • | the loss of key employees or customers; |
| • | the possible inconsistencies in standards, controls, procedures and policies among the combined companies and the need to implement company-wide financial, accounting, information and other systems; |
| • | the failure to coordinate sales, distribution and marketing functions and geographically diverse organizations; and |
| • | the diversion of management’s attention from our day-to-day business as a result of the need to address any disruptions and difficulties. |
These disruptions and difficulties, if they occur, may cause us to fail to realize the cost savings, revenue enhancements and other benefits that we may expect from such acquisitions and may cause material adverse short- and long-term effects on our operating results and financial condition.
Risks related to this offering and ownership of our common stock
Prior to this offering, our common stock has been thinly traded and an active trading market may not develop.
The trading volume of our common stock has historically been low, partially because we are not listed on an exchange and our common stock is only traded on the over-the-counter bulletin board, or the OTC Bulletin Board. In addition, our public float has been further limited due to the fact that approximately 88.7% of our outstanding common stock was beneficially owned by affiliates of Pegasus Capital as of April 12, 2011. A more active trading market for our common stock may not develop as a result of this offering or as a result of our proposed listing on the NASDAQ stock market, or if developed, may not continue, and a holder of any of our securities may find it difficult to dispose of, or to obtain accurate quotations as to the market value of, our common stock.
20
Table of Contents
We intend to elect to be a “controlled company” under the NASDAQ Marketplace Rules, controlled by Pegasus Capital, whose interests in our business may be different from yours.
Affiliates of Pegasus Capital beneficially owned approximately 88.7% of our common stock as of April 12, 2011, and upon completion of this offering, Pegasus Capital will beneficially own approximately % of our common stock, or % of our common stock if the underwriters exercise their over-allotment option in full. As a result of this ownership, Pegasus Capital has a controlling influence on our affairs and its voting power constitutes a quorum of our stockholders voting on any matter requiring the approval of our stockholders. Such matters include the nomination and election of directors, the issuance of additional shares of our capital stock or payment of dividends, the adoption of amendments to our certificate of incorporation and bylaws and approval of mergers or sales of substantially all of our assets. This concentration of ownership may also have the effect of delaying or preventing a change in control of our company or discouraging others from making tender offers for our shares, which could prevent stockholders from receiving a premium for their shares. In addition, Richard Weinberg, our Chairman and Chief Executive Officer, is the Co-Managing Director of Pegasus Capital. Pegasus Capital may cause corporate actions to be taken even if the interests of Pegasus Capital conflict with the interests of our other stockholders.
Because of the equity ownership of Pegasus Capital, we intend to elect to be considered a “controlled company” for purposes of the NASDAQ Marketplace Rules. As such, we will be exempt from the NASDAQ corporate governance requirement that a majority of our board of directors meet the specified standards of independence and exempt from the requirement that we have a compensation and governance committee made up entirely of directors who meet such independence standards. The NASDAQ independence standards are intended to ensure that directors who meet the independence standard are free of any conflicting interest that could influence their actions as directors. It is possible that the interests of Pegasus Capital may in some circumstances conflict with our interests and the interests of our other stockholders, including you.
We expect that the price of our common stock will fluctuate substantially and you may not be able to sell your shares at or above the public offering price.
The public offering price for the shares of our common stock sold in this offering was determined by negotiation between the representatives of the underwriters and us. This price may not reflect the market price of our common stock following this offering. In addition, the market price of our common stock is likely to be highly volatile and may fluctuate substantially due to many factors, including:
| • | changes in expectations as to our future financial performance; |
| • | announcements of technological innovations or new products by us or our competitors; |
| • | announcements by us or our competitors of significant contracts, acquisitions, strategic partnerships, joint ventures or capital commitments; |
| • | changes in laws and government regulations; |
| • | developments concerning our proprietary rights; |
| • | public perception relating to the commercial value or reliability of any of our lighting products; |
| • | future sales of our common stock or issues of other equity securities convertible into or exercisable for the purchase of common stock; |
| • | our involvement in litigation; |
| • | the acquisition or divestiture by Pegasus Capital or its affiliates of part or all of its holdings; and |
| • | general stock market conditions. |
In addition, in recent years, the U.S. securities markets have experienced significant price and volume fluctuations. This volatility has had a significant impact on the market price of securities issued by many
21
Table of Contents
companies, including companies in our industry. The changes frequently appear to occur without regard to the operating performance of the affected companies. Therefore, the price of our common stock could fluctuate based upon factors that have little or nothing to do with our company, and these fluctuations could materially reduce our share price.
Investors in this offering will experience immediate dilution in net tangible book value per share.
The public offering price per share will significantly exceed the net tangible book value per share of our common stock. As a result, investors in this offering will experience immediate dilution of $ in net tangible book value per share as of December 31, 2010 based on an public offering price of $ , which is the midpoint of the price range set forth on the cover page of this prospectus. This dilution occurs in large part because our earlier investors paid substantially less than the public offering price when they purchased their shares. Investors in this offering may also experience additional dilution as a result of the exercise of outstanding stock options and warrants. Accordingly, in the event that we are liquidated, investors may not receive the full amount or any of their investment.
Our management will have broad discretion over the use of the proceeds we receive in this offering and might not apply the proceeds in ways that increase the value of your investment.
After the repayment of any existing indebtedness on our Wells Fargo line of credit, our management will have broad discretion to use our net proceeds from this offering, and you will be relying on the judgment of our management regarding the application of these proceeds. Our management might not apply our net proceeds of this offering in ways that increase the value of your investment. After repayment of the Wells Fargo line of credit, we expect to use the net proceeds to us from this offering for general corporate purposes, including capital expenditures to expand our production capacity, investments in our research and development activities, expansion of our sales force and working capital needs in support of our planned business activities. Our management might not be able to yield a significant return, if any, on any investment of these net proceeds. You will not have the opportunity to influence our decisions on how to use our net proceeds from this offering.
Securities analysts may not provide coverage of our common stock or may issue negative reports, which may have a negative impact on the market price of our common stock.
Securities analysts have not historically provided research coverage of our common stock and may elect not to do so after the completion of this offering. If securities analysts do not cover our common stock after the completion of this offering, the lack of research coverage may cause the market price of our common stock to decline. The trading market for our common stock may be affected in part by the research and reports that industry or financial analysts publish about our business. If one or more of the analysts who elects to cover us downgrades our stock, our stock price would likely decline substantially. If one or more of these analysts ceases coverage of us, we could lose visibility in the market, which in turn could cause our stock price to decline. In addition, rules mandated by the Sarbanes-Oxley Act of 2002 and a global settlement reached in 2003 between the SEC, other regulatory agencies and a number of investment banks have led to a number of fundamental changes in how analysts are reviewed and compensated. In particular, many investment banking firms are required to contract with independent financial analysts for their stock research. It may be difficult for companies such as ours, with smaller market capitalizations, to attract independent financial analysts that will cover our common stock. This could have a negative effect on the market price of our stock.
We do not intend to pay cash dividends and, consequently, your ability to achieve a return on your investment will depend on appreciation in the price of our common stock.
We have never declared or paid cash dividends on our common stock and we do not anticipate paying any cash dividends in the foreseeable future. We have a history of losses and currently intend to retain all available funds and any future earnings for use in the operation and expansion of our business. In addition, the terms of the
22
Table of Contents
Wells Fargo line of credit restrict our ability to pay dividends and any future credit facilities and loan agreements may further restrict our ability to pay dividends. As a result, capital appreciation, if any, of our common stock will be your sole source of potential gain for the foreseeable future.
Anti-takeover provisions in our amended and restated certificate of incorporation and amended and restated bylaws, and Delaware law, contain provisions that could discourage a takeover.
Anti-takeover provisions of our amended and restated certificate of incorporation and amended and restated bylaws and Delaware law may have the effect of deterring or delaying attempts by our stockholders to remove or replace management, engage in proxy contests and effect changes in control. The provisions of our charter documents include:
| • | procedures for advance notification of stockholder nominations and proposals; |
| • | the inability of less than a majority of our stockholders to call a special meeting of the stockholders; |
| • | the ability of our board of directors to create new directorships and to fill any vacancies on the board of directors; |
| • | the ability of our board of directors to amend our bylaws without stockholder approval; and |
| • | the ability of our board of directors to issue shares of preferred stock without stockholder approval upon the terms and conditions and with the rights, privileges and preferences as our board of directors may determine. |
In addition, as a Delaware corporation, we are subject to Delaware law, including Section 203 of the Delaware General Corporation Law. In general, Section 203 prohibits a Delaware corporation from engaging in any business combination with any interested stockholder for a period of three years following the date that the stockholder became an interested stockholder unless certain specific requirements are met as set forth in Section 203. These provisions, alone or together, could have the effect of deterring or delaying changes in incumbent management, proxy contests or changes in control.
Future sales or the possibility of future sales of a substantial amount of our common stock may depress the price of shares of our common stock.
Future sales or the availability for sale of substantial amounts of our common stock in the public market could adversely affect the prevailing market price of our common stock and could impair our ability to raise capital through future sales of equity securities. Upon consummation of this offering, based on the midpoint of the price range set forth on the cover page of this prospectus, there will be shares of our common stock outstanding. All shares of our common stock sold in this offering will be freely transferable without restriction or further registration under the Securities Act of 1933, as amended, or the Securities Act.
We may issue shares of our common stock or other securities from time to time pursuant to the exercise of outstanding stock options or warrants or as consideration for future acquisitions and investments. If any such acquisition or investment is significant, the number of shares of our common stock, or the number or aggregate principal amount, as the case may be, of other securities that we may issue may in turn be substantial. We may also grant registration rights covering those shares of our common stock or other securities in connection with any such acquisitions and investments.
We cannot predict the size of future issuances of our common stock or the effect, if any, that future issuances and sales of our common stock will have on the market price of our common stock. Sales of substantial amounts of our common stock (including shares of our common stock issued in connection with an acquisition or by Pegasus Capital or its affiliates), or the perception that such sales could occur, may adversely affect prevailing market prices for our common stock.
23
Table of Contents
This prospectus contains forward-looking statements within the meaning of Section 27A of the Securities Act and Section 21E of the Exchange Act that are based on current expectations, estimates, forecasts and projections about us, our future performance, our liquidity, the LED and lighting industries, our beliefs and management’s assumptions. Words such as “anticipate,” “assume,” “believe,” “estimate,” “expect,” “intend,” “plan,” “seek,” “project,” “target,” “goal” and variations of such words and similar expressions are intended to identify such forward-looking statements. All statements in this prospectus regarding our business strategy, future operations, future financial position, anticipated cost savings and margin improvement, planned revenue growth, prospects, plans and objectives, as well as information concerning industry trends and developments and expected actions of third parties, are forward-looking statements. All forward-looking statements speak only as of the date on which they are made. These statements are not guarantees of future performance and involve certain risks, uncertainties and assumptions concerning future events that are difficult to predict. We believe that the factors that could cause our actual results to differ materially include the factors that we describe in “Risk factors.” These factors, risks and uncertainties include, but are not limited to, the following:
| • | our ability to introduce new products with better performance and lower manufacturing costs; |
| • | market acceptance of LED lighting for general illumination and of our products in particular; |
| • | evolving industry trends and standards; |
| • | improvements in our forward planning and supply chain management and our success in transitioning our manufacturing activities to Mexico and Asia; |
| • | our ability to efficiently increase production capacity to meet demand and manage any future growth; |
| • | the timing and volume of sales of our products; |
| • | our relationships with customers and suppliers, particularly The Home Depot and Osram Sylvania; |
| • | continued strength of our relationships with key suppliers including those of packaged LEDs; |
| • | our ability to develop new proprietary technology and the costs and timing of obtaining new patent rights; |
| • | our ability to enforce our patents; |
| • | any litigation involving us; |
| • | regulatory changes affecting us; |
| • | competition in our industry; |
| • | our ability to achieve and maintain effective internal controls; |
| • | our ability to attract and retain key personnel, including a new CEO; and |
| • | the amount of working capital investments we are required to make and our ability to generate positive cash flow. |
These factors should not be construed as exhaustive and should be read in conjunction with the other cautionary statements included in this prospectus. These risks and uncertainties, as well as other risks of which we are not aware or which we currently do not believe to be material, may cause our actual future results to differ materially from those expressed in our forward-looking statements. We caution you not to place undue reliance on these forward-looking statements. We do not undertake any obligation to make any revisions to these forward-looking statements to reflect events or circumstances after the date of this prospectus or to reflect the occurrence of unanticipated events, except as required by law, including the securities laws of the United States and rules and regulations of the SEC.
24
Table of Contents
We estimate that the net proceeds to us from this offering will be approximately $ million, based on an assumed public offering price of $ per share, which is the midpoint of the price range set forth on the cover page of this prospectus and after deducting underwriting discounts and commissions and estimated offering expenses payable by us. If the underwriters’ over-allotment option is exercised in full, we estimate that we will receive additional net proceeds of approximately $ million.
We intend to use the net proceeds from this offering to repay any existing indebtedness on our Wells Fargo line of credit, including accrued and unpaid interest thereon. We expect to use the remaining net proceeds from this offering for general corporate purposes, including capital expenditures to expand our production capacity, investments in research and development, expansion of our sales force and working capital needs in support of our planned business activities. Upon repayment of the existing indebtedness on our Wells Fargo line of credit, we will have significant discretion as to the use of any remaining net proceeds. Investors will be relying on the judgment of our management regarding the application of the net proceeds of any sale of our common stock.
As of , 2011, the outstanding balance on our Wells Fargo line of credit was $ million, consisting of $ million of principal and $ million in accrued and unpaid interest. The Wells Fargo line of credit has a maturity date of November 22, 2013. Borrowings under the Wells Fargo line of credit bear interest at one of the following two rates (at our election): (a) the sum of (1) the greater of: (x) the federal funds rate plus 0.50%, (y) the daily three month LIBOR rate plus 1.0% and (z) Wells Fargo’s prime rate; and (2) 0.75%, 1.25% or 1.75%, as applicable, depending on the amount available for borrowing under the line of credit and subject to any reserves established by Wells Fargo in accordance with the terms of the line of credit; or (b) the sum of (1) the daily three month LIBOR rate; plus 3.0%, 3.5% or 4.0%, as applicable, depending on the amount available for borrowing under the line of credit and subject to any reserves established by Wells Fargo in accordance with the terms of the line of credit. The annual interest rate was equal to % as of , 2011.
Each $1.00 increase (decrease) in the assumed public offering price of $ per share would increase (decrease) the net proceeds to us by $ million, after deducting underwriting discounts and commissions and estimated offering expenses payable by us and assuming that the number of shares offered by us in this offering, as set forth on the cover page of this prospectus, remains the same. Each increase (decrease) of 1.0 million in the number of shares offered by us in this offering would increase (decrease) the net proceeds to us by $ million, after deducting underwriting discounts and commissions and estimated offering expenses payable by us and assuming a public offering price of $ per share, which is the midpoint of the price range set forth on the cover page of this prospectus.
25
Table of Contents
Market price of our common stock
Our common stock is currently quoted on the OTC Bulletin Board under the symbol “LSCG.OB.” We intend to apply to have our stock listed on the NASDAQ stock market under the symbol “LSGC.”
Our common stock last traded at $2.94 on April 12, 2011, and there were approximately 365 stockholders of record of our common stock on that date. We believe the number of beneficial owners is greater than the number of record holders because beneficial owners of our outstanding common stock hold shares of record in broker “street names” for the benefit of individual investors. As of April 12, 2011, there were 186,452,442 shares of our common stock outstanding.
The following table provides the high and low closing bid price information for our common stock for each quarterly period within the two most recent fiscal years as reported by OTC Markets Group Inc. The quotations reflect inter-dealer prices, without retail mark-up, mark-down or commissions and may not represent actual transactions.
| HIGH | LOW | |||||||
| 2011 |
||||||||
| First Quarter |
$ | 5.20 | $ | 3.25 | ||||
| Second Quarter (through April 12, 2011) |
$ | 3.85 | $ | 2.91 | ||||
| 2010 |
||||||||
| First Quarter |
$ | 0.94 | $ | 0.60 | ||||
| Second Quarter |
$ | 2.46 | $ | 0.81 | ||||
| Third Quarter |
$ | 2.25 | $ | 1.33 | ||||
| Fourth Quarter |
$ | 3.42 | $ | 1.78 | ||||
| 2009 |
||||||||
| First Quarter |
$ | 0.87 | $ | 0.40 | ||||
| Second Quarter |
$ | 0.86 | $ | 0.30 | ||||
| Third Quarter |
$ | 0.76 | $ | 0.40 | ||||
| Fourth Quarter |
$ | 1.55 | $ | 0.77 | ||||
We have not paid any dividends on our common stock since our inception and do not intend to pay any cash dividends on our common stock in the foreseeable future. We currently anticipate that we will retain all of our available cash, if any, for use as working capital and for other general corporate purposes, including to service our debt and to fund the operation of our business. Payment of future dividends, if any, will be at the discretion of our board of directors and will depend on many factors, including general economic and business conditions, our strategic plans, our financial results and condition, legal requirements and other factors our board of directors deems relevant. Certain of our financing agreements also impose restrictions on our ability to pay dividends.
26
Table of Contents
The following table presents a summary of our cash and capitalization as of December 31, 2010:
| • | on an actual basis; |
| • | on a pro forma basis giving effect to the: (i) sale of 5,454,545 shares of our common stock on January 26, 2011 for $18.0 million pursuant to a private placement and (ii) issuance of 54,500,000 shares of our common stock to LSGC Holdings, as of February 9, 2011, in exchange for the Series D Warrant to purchase 60,758,777 shares of our common stock and the warrant to purchase 942,857 shares of our common stock held by LSGC Holdings (collectively, the “Subsequent Issuances”); and |
| • | on a pro forma as adjusted basis giving effect to the Subsequent Issuances and our issuance and sale of shares of our common stock in this offering at an assumed public offering price of $ per share, which is the midpoint of the price range set forth on the cover page of this prospectus and after deducting underwriting discounts and commissions and estimated offering expenses payable by us, and the application of the net proceeds to us from this offering to repay existing indebtedness on the Wells Fargo line of credit as described in “Use of proceeds.” |
You should read this table in conjunction with “Use of proceeds,” “Selected historical consolidated financial data,” “Management’s discussion and analysis of financial condition and results of operations” and our consolidated financial statements and related notes, all included elsewhere in this prospectus.
| (Amounts in thousands, except per share data) | As of December 31, 2010 | |||||||||||
| Actual | Pro forma | Pro
forma as adjusted (1) |
||||||||||
| Cash and cash equivalents |
$ | 14,490 | $ | 32,490 | ||||||||
| Total indebtedness (including short-term indebtedness) |
6,175 | 6,175 | ||||||||||
| Stockholders’ equity: |
||||||||||||
| Common stock: $0.001 par value; 400,000,000 shares authorized, 125,595,418, 185,549,561 and issued and outstanding shares, actual, pro forma and pro forma as adjusted |
126 | 186 | ||||||||||
| Additional paid-in capital |
471,256 | 489,196 | ||||||||||
| Accumulated deficit |
(443,142 | ) | (443,142 | ) | ||||||||
| Accumulated other comprehensive loss |
(3,558 | ) | (3,558 | ) | ||||||||
| Total stockholders’ equity |
24,682 | 42,682 | ||||||||||
| Total capitalization |
$ | 30,857 | $ | 48,857 | ||||||||
| (1) | The pro forma as adjusted data gives effect to the Subsequent Issuances and our issuance and sale of shares of our common stock in this offering at an assumed public offering price of $ per share, which is the midpoint of the price range set forth on the cover page of this prospectus and after deducting underwriting discounts and commissions and estimated offering expenses payable by us. If the underwriters’ over-allotment option to purchase additional shares from us in this offering is exercised in full, we estimate that we will receive additional net proceeds of approximately $ million. Each $1.00 increase (decrease) in the assumed public offering price of $ per share would increase (decrease) each of cash additional paid-in capital, stockholders’ equity and total capitalization by $ million, after deducting underwriting discounts and commissions and estimated offering expenses payable by us and assuming that the number of shares offered by us in this offering, as set forth on the cover page of this prospectus, remains the same. Each increase (decrease) of 1.0 million in the number of shares offered by us in this offering would increase (decrease) each of cash, additional paid-in capital, stockholders’ equity and total capitalization by $ million, after deducting underwriting discounts and commissions and estimated offering expenses payable by us and assuming a public offering price of $ per share, which is the midpoint of the price range set forth on the cover page of this prospectus. |
27
Table of Contents
If you invest in our common stock in this offering, your ownership interest in us will be diluted to the extent of the difference between the public offering price per share of our common stock and the pro forma as adjusted net tangible book value per share of our common stock upon consummation of this offering. Our historical net tangible book value as of December 31, 2010 was approximately $19.0 million, or $0.15 per share of our common stock, based on 125,595,418 shares issued and outstanding as of such date. Net tangible book value per share represents the book value of our total tangible assets less the book value of our total liabilities divided by the number of shares of our common stock then issued and outstanding.
After giving effect to the Subsequent Issuances described under “Capitalization,” our pro forma net tangible book value as of December 31, 2010 would have been $37.0 million, or $0.20 per share of our common stock, based on 185,549,963 pro forma shares outstanding as of December 31, 2010.
After giving effect to the Subsequent Issuances and our issuance and sale of shares of our common stock in this offering at an assumed public offering price of $ per share, which is the midpoint of the price range set forth on the cover page of this prospectus, and after deducting underwriting discounts and commissions and estimated offering expenses payable by us, our pro forma as adjusted net tangible book value as of December 31, 2010 would have been $ million, or $ per share of our common stock based on pro forma as adjusted shares outstanding as of December 31, 2010. This amount represents an immediate increase in net tangible book value to our existing stockholders of $ per share and an immediate dilution of $ per share to investors in this offering.
The following table illustrates this per share dilution:
| Assumed public offering price per share |
$ | |||||||
| Net tangible book value per share as of December 31, 2010 |
$ | 0.15 | ||||||
| Increase in net tangible book value per share as a result of the Subsequent Issuances |
0.05 | |||||||
| Increase in net tangible book value per share attributable to this offering |
||||||||
| Pro forma as adjusted net tangible book value per share after this offering |
||||||||
| Net tangible book value dilution per share to investors in this offering |
||||||||
| $ | ||||||||
Each $1.00 increase (decrease) in the assumed public offering price of $ per share would increase (decrease) our pro forma as adjusted net tangible book value by approximately $ million, or approximately $ per share of our common stock, and the dilution to investors in this offering by approximately $ per share, after deducting underwriting discounts and commissions and estimated offering expenses payable by us and assuming that the number of shares offered by us in this offering, as set forth on the cover page of this prospectus, remains the same. Each increase (decrease) of 1.0 million in the number of shares offered by us would increase (decrease) our pro forma as adjusted net tangible book value by approximately $ million, or approximately $ per share of our common stock, and the dilution to investors in this offering by approximately $ per share after deducting underwriting discounts and commissions and estimated offering expenses payable by us and assuming a public offering price of $ per share, which is the midpoint of the price range set forth on the cover page of this prospectus. The pro forma as adjusted information discussed above is illustrative only and will adjust based on the actual public offering price and other terms of this offering determined at pricing.
If the underwriters’ over-allotment option to purchase additional shares from us in this offering is exercised in full, our pro forma as adjusted net tangible book value as of December 31, 2010 would have been $ million, or $ per share, representing an immediate increase in net tangible book value to our existing stockholders of $ per share and an immediate dilution of $ per share to investors in this offering.
28
Table of Contents
After giving effect to the Subsequent Issuances, the following table summarizes as of December 31, 2010 the average price per share paid by our existing stockholders and by investors in this offering at an assumed public offering price of $ per share, which is the midpoint of the price range set forth on the cover page of this prospectus, before deducting underwriting discounts and commissions and estimated offering expenses payable by us.
| Shares Purchased | Total Consideration | Average Price Per Share |
||||||||||||||||||
| Number | Percent | Amount | Percent | Amount | ||||||||||||||||
| Existing stockholders |
185,549,963 | % | $ | 489,381,513 | % | $ | 2.64 | |||||||||||||
| Investors in this offering |
||||||||||||||||||||
| Total |
100 | % | $ | 100 | % | |||||||||||||||
Each $1.00 increase (decrease) in the assumed public offering price of $ per share would increase (decrease) total consideration paid by investors in this offering by $ million after deducting underwriting discounts and commissions and estimated offering expenses payable by us and assuming that the number of shares offered by us in this offering, as set forth on the cover page of this prospectus, remains the same.
If the underwriters’ over-allotment option to purchase additional shares from us in this offering is exercised in full, the following will occur:
| • | the number of shares of our common stock held by existing stockholders after the completion of this offering will be , or approximately % of the total number of shares of our common stock outstanding after this offering; and |
| • | the number of shares of our common stock held by investors in this offering after the completion of this offering will be , or approximately % of the total number of shares of our common stock outstanding after this offering. |
The foregoing information as to the number of shares of our common stock outstanding immediately after this offering is based on 185,549,963 shares outstanding as of December 31, 2010 after giving effect to the Subsequent Issuances described under “Capitalization” and excludes:
| • | 12,753,756 shares of common stock issuable upon the exercise of outstanding options under the Equity Plan as of December 31, 2010, at a weighted average exercise price of $1.38 per share; |
| • | 176,668 shares of common stock issuable upon the vesting of shares of restricted stock previously awarded under the Equity Plan as of December 31, 2010; |
| • | 14,523,744 shares of common stock reserved and available for future issuance under the Equity Plan as of December 31, 2010 (which gives effect to an 8,000,000 share increase on February 10, 2011); and |
| • | 14,789,424 shares of common stock issuable upon the exercise of outstanding warrants as of December 31, 2010, at a weighted average exercise price of $5.83 per share. |
If all of our outstanding options and warrants to purchase common stock as of December 31, 2010 were exercised in full, our pro forma net tangible book value as of December 31, 2010 before this offering would have been $0.17 per share of our common stock and, after our issuance and sale of shares of our common stock in this offering at an assumed public offering price of $ per share, which is the midpoint of the price range set forth on the cover page of this prospectus and after deducting underwriting discounts and commissions and estimated offering expenses payable by us, our pro forma as adjusted net tangible book value as of December 31, 2010 would have been $ per share representing an immediate dilution of $ per share to investors in this offering.
29
Table of Contents
Selected historical consolidated financial data
The following table presents our selected historical consolidated financial data as of the dates and for the periods indicated. The consolidated statements of operations data for the years ended December 31, 2010, 2009 and 2008 and the consolidated balance sheet data as of December 31, 2010 and 2009 are derived from our audited consolidated financial statements included elsewhere in this prospectus. The consolidated statements of operations data for the years ended December 31, 2007 and 2006 and the consolidated balance sheet data as of December 31, 2008, 2007 and 2006 are derived from our audited consolidated financial statements that are not included in this prospectus. Our historical results are not necessarily indicative of the results to be expected in any future period.
Our business today is the result of the combination of the products, intellectual property and businesses of four LED lighting companies, namely: (i) Lighting Science Group; (ii) LED Effects, which was acquired in October 2007; (iii) LSGBV, formerly known as Lighting Partner B.V., which was acquired in April 2008; and (iv) Lamina, which was acquired in July 2008. On October 4, 2007, we entered into an Exchange and Contribution Agreement (the “Contribution Agreement”) with LED Holdings, a private holding company that was formed in June 2007 for the purpose of acquiring 100% of the assets of LED Effects on June 14, 2007. Pursuant to the Contribution Agreement, we: (i) acquired substantially all of the assets of LED Holdings and (ii) issued in exchange for these assets 2,000,000 shares of our Series B Preferred Stock and 15,928,734 shares of our common stock to LED Holdings (collectively, the “Acquisition”). As a result of the Acquisition and, specifically, LED Holdings’ acquisition of approximately a 70% participating interest and an 80% voting interest in the company, we became a majority-owned subsidiary of LED Holdings as of October 4, 2007.
We accounted for the Acquisition as a reverse merger. Accordingly, for accounting and financial reporting purposes, Lighting Science Group was treated as the acquired company, and LED Holdings was treated as the acquiring company. Therefore, the historical financial data presented below for the period beginning on June 14, 2007 and ending on December 31, 2007 include the operations of LED Holdings from June 14, 2007 through October 4, 2007 and the consolidated operations of LED Holdings and Lighting Science Group from October 4, 2007 through December 31, 2007. Because LED Holdings had no operations prior to its acquisition of the assets of LED Effects, the historical financial data included below for periods prior to June 14, 2007 are those of LED Effects, which has been identified as the predecessor entity to LED Holdings.
You should read this selected historical consolidated financial data in conjunction with “Management’s discussion and analysis of financial condition and results of operations” and our consolidated financial statements and related notes included elsewhere in this prospectus.
30
Table of Contents
| Lighting Science Group Corp and Subsidiaries | ||||||||||||||||||||||||
| For the Years Ended December 31, | from June 14, 2007 thru December 31, 2007 |
LED Effects Inc. and Subsidiary from January 1, 2007 thru June 13, 2007 |
LED Effects Inc. for the Year Ended December 31, 2006 |
|||||||||||||||||||||
| 2010 | 2009 | 2008 | ||||||||||||||||||||||
| Consolidated Statements of Operations Data: |
||||||||||||||||||||||||
| Revenue |
$ | 53,169,013 | $ | 31,376,816 | $ | 20,758,593 | $ | 4,616,111 | $ | 3,675,132 | $ | 8,858,068 | ||||||||||||
| Cost of goods sold |
59,021,851 | 24,754,819 | 16,688,600 | 3,526,750 | 2,606,445 | 6,061,922 | ||||||||||||||||||
| Gross margin (deficit) |
(5,852,838 | ) | 6,621,997 | 4,069,993 | 1,089,361 | 1,068,687 | 2,796,146 | |||||||||||||||||
| Operating expenses: |
||||||||||||||||||||||||
| Sales and marketing |
11,107,379 | 7,200,323 | 5,847,833 | 962,597 | 107,708 | — | ||||||||||||||||||
| Operations |
4,834,592 | 8,165,066 | 6,453,867 | 2,396,355 | 127,574 | — | ||||||||||||||||||
| Research and development (1) |
10,246,511 | 6,600,352 | 7,332,296 | — | — | — | ||||||||||||||||||
| General and administrative |
17,753,656 | 20,753,513 | 23,224,561 | 2,875,076 | 330,269 | 997,494 | ||||||||||||||||||
| Restructuring expenses (1) |
1,101,992 | 1,111,189 | — | — | — | — | ||||||||||||||||||
| Impairment of goodwill and other long-lived assets |
11,548,650 | — | 53,110,133 | — | — | — | ||||||||||||||||||
| Depreciation and amortization |
2,867,866 | 5,327,033 | 4,354,028 | 669,861 | 6,691 | 25,969 | ||||||||||||||||||
| Total operating expenses |
59,460,646 | 49,157,476 | 100,322,718 | 6,903,889 | 572,242 | 1,023,463 | ||||||||||||||||||
| Loss from operations |
(65,313,484 | ) | (42,535,479 | ) | (96,252,725 | ) | (5,814,528 | ) | 496,445 | 1,772,683 | ||||||||||||||
| Total other income (expense) |
(230,948,562 | ) | (6,014,450 | ) | (918,238 | ) | 915,461 | (34,406 | ) | (1,167 | ) | |||||||||||||
| Loss before income tax expense (benefit) |
(296,262,046 | ) | (48,549,929 | ) | (97,170,963 | ) | (4,899,067 | ) | 462,039 | 1,771,516 | ||||||||||||||
| Income tax expense (benefit) |
(1,123,107 | ) | (413,002 | ) | (2,207,507 | ) | — | 172,244 | 666,665 | |||||||||||||||
| Loss before minority interest in subsidiary |
(295,138,939 | ) | (48,136,927 | ) | (94,963,456 | ) | (4,899,067 | ) | 289,795 | 1,104,851 | ||||||||||||||
| Minority interest in subsidiary |
— | — | — | (3,902 | ) | (2,583 | ) | (84,523 | ) | |||||||||||||||
| Net loss |
(295,138,939 | ) | (48,136,927 | ) | (94,963,456 | ) | (4,902,969 | ) | 287,212 | 1,020,328 | ||||||||||||||
| Dividend requirements |
||||||||||||||||||||||||
| 6% return on Series B Preferred Stock |
784,142 | 1,217,642 | — | — | — | — | ||||||||||||||||||
| 8% return on Series C Preferred Stock |
213,610 | 266,400 | — | — | — | — | ||||||||||||||||||
| Net loss attributable to common stock |
$ | (296,136,691 | ) | $ | (49,620,969 | ) | $ | (94,963,456 | ) | $ | (4,902,969 | ) | $ | 287,212 | $ | 1,020,328 | ||||||||
| Basic and diluted net loss per weighted average common share |
$ | (6.69 | ) | $ | (1.69 | ) | $ | (3.55 | ) | $ | (0.28 | ) | ||||||||||||
| Basic and diluted weighted average number of common shares outstanding |
44,274,077 | 29,352,585 | 26,781,431 | 17,419,959 | ||||||||||||||||||||
| Net loss |
$ | (295,138,939 | ) | $ | (48,136,927 | ) | $ | (94,963,456 | ) | $ | (4,902,969 | ) | $ | 287,212 | $ | 1,020,328 | ||||||||
| Foreign currency translation gain (loss) |
(912,296 | ) | (849,695 | ) | (1,886,544 | ) | 10,281 | (82,135 | ) | (8,977 | ) | |||||||||||||
| Comprehensive loss |
$ | (296,051,235 | ) | $ | (48,986,622 | ) | $ | (96,850,000 | ) | $ | (4,892,688 | ) | $ | 205,077 | $ | 1,011,351 | ||||||||
31
Table of Contents
| As of December 31, | ||||||||||||||||||||
| Consolidated Balance Sheet Data: | 2010 | 2009 | 2008 | 2007 | 2006 | |||||||||||||||
| Cash and cash equivalents |
14,489,700 | 267,048 | 254,538 | 11,399,429 | 1,828,776 | |||||||||||||||
| Working capital |
11,178,922 | (54,703,745 | ) | (14,869,035 | ) | 11,732,984 | 3,254,997 | |||||||||||||
| Total assets |
72,493,363 | 38,468,814 | 49,553,267 | 73,586,251 | 3,953,678 | |||||||||||||||
| Total liabilities |
47,811,852 | 72,132,669 | 38,298,878 | 7,033,103 | 908,911 | |||||||||||||||
| 6% convertible preferred stock |
— | 585,549 | 459,532 | 364,895 | — | |||||||||||||||
| Total shareholders’ equity (deficit) |
24,681,511 | (34,249,404 | ) | 10,794,857 | 66,188,253 | 3,044,767 | ||||||||||||||
| (1) | During 2010, we modified the presentation of our operating expenses to separately convey research and development and restructuring expenses in our consolidated statement of operations and comprehensive loss. This table reflects management’s modified presentation for all periods presented. |
32
Table of Contents
Management’s discussion and analysis of
financial condition and results of operations
The following discussion and analysis summarizes the significant factors affecting the consolidated operating results, financial condition, liquidity and cash flows of our company as of and for the periods presented below. The following discussion and analysis should be read in conjunction with our consolidated financial statements and related notes included elsewhere in this prospectus. This discussion contains forward-looking statements that are based on the beliefs of our management, as well as assumptions made by, and information currently available to, our management. Actual results may differ materially from those discussed in or implied by forward-looking statements as a result of various factors, including those discussed below and elsewhere in this prospectus, particularly in the section entitled “Risk factors.”
Overview
We design, develop, manufacture and market general illumination products that exclusively use LEDs as their light source. Our product portfolio includes LED-based retrofit lamps (replacement bulbs) that can be used in existing light fixtures and sockets as well as purpose built LED-based luminaires (fixtures), for many common indoor and outdoor residential, commercial, industrial and public infrastructure lighting applications.
Our revenues are primarily derived from sales of our LED-based retrofit lamps and luminaires. Retrofit lamp sales have grown significantly over the past year and currently represent the majority of our revenues. Our financial results are dependent upon the mix and quantity of products sold, the operating costs associated with our supply chain, including materials, labor and freight, and the level of sales and marketing, general and administrative, research and development and other operating expenses.
We experienced substantial sales growth during the year ended December 31, 2010 as a result of our launch of multiple new products and the addition or expansion of relationships with several key customers. These developments occurred as the acceptance of LED lighting for general illumination generally became more widespread, though we believe it still remains in its early stages.
Our gross margin for the year ended December 31, 2010 reflects the impact of higher than normal costs for the initial launch of new products and our efforts to meet accelerated production schedules associated with faster than anticipated growth in demand for our products. These increased costs were driven primarily by our need to expedite materials delivery by means of premium freight and to make spot purchases of long lead-time materials at higher than our normal contracted prices. In addition, we had higher than expected wages as a result of inefficiencies in our newly developed supply chain, including the rapid expansion and training of our labor force and delays in establishing lower cost internal and third-party contract manufacturing and assembly capacity. We are addressing our operational and supply chain challenges and are experiencing gradual improvement.
| For the Years Ended December 31, | ||||||||||||
| 2010 | 2009 | 2008 | ||||||||||
| Revenue |
$ | 53,169,013 | $ | 31,376,816 | $ | 20,758,593 | ||||||
| Cost of goods sold |
59,021,851 | 24,754,819 | 16,688,600 | |||||||||
| Gross margin |
$ | (5,852,838 | ) | $ | 6,621,997 | $ | 4,069,993 | |||||
| Gross margin percentage |
(11.0 | %) | 21.1 | % | 19.6 | % | ||||||
Our efforts to consolidate and restructure our operations following several acquisitions in 2007 and 2008 have been significant and we continued with these efforts to effectively manage our operating expenses in 2010. Excluding restructuring expenses, expenses paid by issuance of common stock and warrants, non-cash stock option and restricted stock compensation expense, impairment of goodwill and other long-lived assets and depreciation and amortization, total operating expenses increased by 1.0% for the year ended December 31, 2010, despite a 69.5% increase in revenues and represented 73.7% of revenues as compared to 123.6% of
33
Table of Contents
revenues for the year ended December 31, 2009. These expenses for the year ended December 31, 2010 were 12.5% higher than for the year ended December 31, 2008 despite a 156.1% increase in revenues over this period.
| For the Years Ended December 31, | ||||||||||||
| 2010 | 2009 | 2008 | ||||||||||
| Revenue |
$ | 53,169,013 | $ | 31,376,816 | 20,758,593 | |||||||
| Total operating expenses |
59,460,646 | 49,157,476 | 100,322,718 | |||||||||
| Less: |
||||||||||||
| Restructuring expenses |
(1,101,992 | ) | (1,111,189 | ) | — | |||||||
| Expenses paid by issuance of common stock and warrants |
(930,202 | ) | (560,000 | ) | (5,326,130 | ) | ||||||
| Non-cash stock option and restricted stock compensation expense |
(3,837,757 | ) | (3,376,382 | ) | (2,712,687 | ) | ||||||
| Impairment of goodwill and other long-lived assets |
(11,548,650 | ) | — | (53,110,133 | ) | |||||||
| Depreciation and amortization |
(2,867,866 | ) | (5,327,033 | ) | (4,354,028 | ) | ||||||
| Total operating expenses, excluding restructuring expenses, stock based compensation, impairment of goodwill and other long-lived assets and depreciation and amortization |
39,174,179 | 38,782,872 | 34,819,740 | |||||||||
| Percentage of revenue |
73.7 | % | 123.6 | % | 167.7 | % | ||||||
We believe the foregoing non-GAAP financial measures provide additional information that is useful to the assessment of our operating performance and trends. These non-GAAP financial measures are not in accordance with, nor are they a substitute for, the comparable GAAP financial measures. These non-GAAP financial measures are intended to supplement our financial results that are prepared in accordance with GAAP.
Our performance for 2010 reflects the results of, and has shaped many of the key aspects of, the strategic plan upon which we executed during the year. This plan includes initiatives related to (i) improving operating expense efficiency, (ii) developing and commercializing ground breaking products and technologies, (iii) capturing significant sales and distribution channel access, and (iv) expanding and optimizing global supply chain operations as we meet growing demand for our products.
The initial phase of our strategic plan included restructuring our operations to better align our fixed operating expenses with our business needs while increasing investment in our research and engineering resources. During the year ended December 31, 2010, we executed upon this plan by exiting our Japanese operations, consolidating our California-based operations to our headquarters in Satellite Beach, Florida and restructuring our European operations. These activities followed similar initiatives during the year ended December 31, 2009 including the closing of our New Jersey facility and our former headquarters office in Texas, which significantly reduced our headcount as well as our overhead costs. Additionally, we substantially reduced the number of employees at our Netherlands location in 2009 in order to reduce duplication in engineering efforts and to focus more on sales and distribution across Europe. We also restructured our California operations during the year ended December 31, 2009. As of December 31, 2010, our U.S. operations were consolidated into our Satellite Beach, Florida headquarters.
Another aspect of our strategic plan includes developing and bringing to market ground breaking products and technologies. We are successfully executing on this initiative as evidenced by the launch of approximately 50 new products during 2010, including a new generation of LED retrofit lamps and luminaires. Additionally, we significantly increased our investment in new platform technologies related to power supplies, optics, thermal
34
Table of Contents
management and intelligent controls as well as our activities in emerging uses for LED lighting including in biological applications. Our new product pipeline remains robust and we believe our track record of introducing new, higher performance and more economically compelling products is a critical factor in our customers’ decisions to partner with us.
A third aspect of our strategic plan entails capturing greater sales and distribution channel access including by securing agreements with large, strategic customers. In the retail channel during 2010, we successfully entered into a Strategic Purchasing Agreement with The Home Depot, which positions us as their preferred provider and product development partner for LED lamps and luminaires. We were also successful in establishing supply agreements with several leading lighting original equipment manufacturers, or OEMs, for private label sales of our products through their distribution channels including additional retail stores. In addition, we significantly increased the roster of distributors and independent sales agents that sell our products and added experienced professionals to our direct sales force to increase the frequency and impact of our activities with key national accounts that are large targets for potential adoption of LED lighting.
The fourth aspect of our strategic plan includes expanding and optimizing our global supply chain to meet growing demand for our products while addressing the inefficiencies that negatively impacted our gross margin performance during 2010. We expect continued improvement as we gain efficiencies with volume and supply chain optimization through the qualification of additional suppliers closer to our production sites, implementation of our new ERP system and other initiatives led by our operations team that has recently been enhanced through the addition of experienced personnel. We also increased the scale of our North American manufacturing and assembly operations with the expansion of our production capacity at our Satellite Beach facility and the addition of significant low-cost capacity at our facility in Monterrey, Mexico, which opened in November 2010. We also successfully established low-cost production capacity in Asia through our contract manufacturing partner. We anticipate these actions will result in improved forecasting and planning of procurement and manufacturing as well as a more optimized production and supplier footprint.
LED lighting industry trends
There are a number of industry factors that affect our business and results of operations including, among others:
| • | Rate and extent of adoption of LED lighting products. Our potential for growth will be driven by the rate and extent of adoption of LED lighting within the general illumination market and our ability to affect this rate of adoption. Although LED lighting is relatively new and faces significant challenges before achieving widespread adoption, it has grown in recent years. Innovations and advancements in LED lighting technology that improve product performance and reduce product cost continue to enhance the value proposition of LED lighting for general illumination and expand its potential commercial applications. |
| • | External legislation and subsidy programs concerning energy efficiency. Many countries in the European Union and the United States, among others, have already instituted, or have announced plans to institute, government regulations and programs designed to encourage or mandate increased energy efficiency in lighting. These actions include in certain cases banning the sale after specified dates of certain forms of incandescent lighting, which is advancing the adoption of more energy efficient lighting solutions such as LEDs. In addition, the growing demand for electricity is increasingly driving utilities and governmental agencies to provide financial incentives such as rebates for energy efficient lighting technologies in an effort to mitigate the need for investments in new electrical generation capacity. |
| • | Intellectual property. LED market participants rely on patented and non-patented proprietary information relating to product development, manufacturing capabilities and other core competencies of their business. Protection and licensing of intellectual property is critical. Therefore, LED lighting |
35
Table of Contents
| industry participants often take steps such as additional patent applications, confidentiality and non-disclosure agreements as well as other security measures. To enforce or protect intellectual property rights, market participants commonly commence or threaten litigation. |
Recapitalization
On September 30, 2010, we entered into a Stock Purchase, Exchange and Recapitalization Agreement (the “Recapitalization Agreement”) with Pegasus IV, LSGC Holdings and LED Holdings. Pursuant to the Recapitalization Agreement, LSGC Holdings purchased $25.0 million of our common stock and Pegasus IV and LED Holdings agreed to participate in a recapitalization of the company (the “Recapitalization”). Specifically, LSGC Holdings purchased 15,625,000 shares of our common stock at a price of $1.60 per share. In conjunction with the Recapitalization, we exchanged all of our outstanding shares of Series B Preferred Stock (the “Series B Preferred Stock”), Series C Preferred Stock (the “Series C Preferred Stock”), Series E Non-Convertible Preferred Stock (the “Series E Preferred Stock”) and the warrant issued in conjunction with the Series E Preferred Stock (the “Series E Warrant” and together, the “Series E Units”) for a total of 32,612,249 shares of our common stock. In addition, the holders of our outstanding shares of Series C Preferred Stock elected to exercise all of their related warrants (“Series C Warrants”) on a cashless basis for 1,937,420 shares of our common stock.
On December 21, 2010 and in conjunction with the Recapitalization Agreement, we amended our Certificate of Incorporation to provide for the automatic conversion of all of our outstanding shares of Series D Non-Convertible Preferred Stock (the “Series D Preferred Stock”) into a total of 44,072,123 shares of our common stock. Additionally, on December 30, 2010, we entered into a Warrant Agreement (the “Warrant Agreement”) with American Stock Transfer & Trust Company, LLC, as warrant agent (the “Warrant Agent”), effective as of December 22, 2010. The Warrant Agreement governs the terms of the warrants (the “Series D Warrants”) issued in conjunction with the units (the “Series D Units”), which were separated pursuant to the automatic conversion of our Series D Preferred Stock. Each Series D Unit had been composed of one share of Series D Preferred Stock and one Series D Warrant.
The Warrant Agreement provides each holder of a Series D Warrant with an exercise price reduction ranging from $0.08 to $0.10 (depending on the date of issuance) per share of common stock issuable upon exercise of such Series D Warrant. The Warrant Agreement also provides each Series D Warrant holder with a credit, registered with the Warrant Agent in the name of the holder, which ranges from approximately $4.85 to $4.88 (depending on the date of issuance) per share of common stock issuable upon exercise of such Series D Warrant (the “Accrual Credit”). The Accrual Credit may only be used to fund the payment of the exercise price of all or a portion of such holder’s Series D Warrants and cannot be used until the earlier of: (i) the passage of eight years from the date of issuance of the relevant Series D Warrant or (ii) a Liquidation Event (as defined in the Warrant Agreement) of the company. After application of the Accrual Credit, the remaining exercise price of each Series D Warrant, following a Liquidation Event or the eighth anniversary of its issuance, would be between $1.04 to $1.05 per share of common stock (depending on the date of issuance), except in the case of the Series D Warrant held by Koninklijke Philips Electronics N.V. (“Philips”), whose remaining exercise price would be approximately $7.05 per share of common stock.
Recent events
On January 13, 2011, we issued a warrant to The Home Depot pursuant to which The Home Depot may purchase up to 5.0 million shares of our common stock at an exercise price of $2.00 per share, subject to certain vesting conditions. The Warrant was issued in connection with our Strategic Purchasing Agreement with The Home Depot, which we entered into on July 23, 2010 and pursuant to which we supply The Home Depot with LED retrofit lamps and luminaires. The Warrant provides that 1.0 million shares of common stock will be eligible for vesting following each fiscal year ending December 31, 2011 through December 31, 2015, if The Home Depot’s gross product orders from us, in dollar terms, are at least 20% more than the gross product orders in the immediately preceding fiscal year. For the shares underlying the Warrant to be eligible for vesting
36
Table of Contents
following the fiscal years ending December 31, 2014 and 2015, The Home Depot would be required to extend the Strategic Purchasing Agreement for additional one-year periods beyond its initial term of three years. Each vested portion of the Warrant will expire on the third anniversary following the vesting of such portion. The $2.00 exercise price was established based upon the market price of our common stock during negotiations with The Home Depot in July 2010 when we entered into the Strategic Purchasing Agreement. The fair value of these warrants will be adjusted at each reporting date until they have been earned for each year and these adjustments will be recorded as a reduction in the related revenues from The Home Depot. For a discussion of the factors used in estimating fair value, see Note 13, “Equity Based Compensation Plans” to our consolidated financial statements for the year ended December 31, 2010 included elsewhere in this prospectus.
On January 26, 2011, we raised $18.0 million in a private placement pursuant to which we issued 5,454,545 shares of our common stock to an affiliate of Pegasus Capital, Michael Kempner, Leon Wagner, certain other operating advisors of Pegasus Capital, and certain trusts affiliated with, and business associates of, Mr. Wagner. Mr. Kempner and Mr. Wagner serve on our board of directors.
On February 9, 2011, we entered into an Exchange Agreement with LSGC Holdings pursuant to which we agreed to issue 54,500,000 shares of our common stock in exchange for: (i) LSGC Holdings’ Series D Warrant to purchase 60,758,777 shares of our common stock and (ii) the warrant to purchase 942,857 shares of our common stock, which was issued to Pegasus IV in connection with its guaranty of our former line of credit with the Bank of Montreal (“BMO”).
Critical accounting policies and estimates
Our discussion and analysis of our financial condition and consolidated results of operations is based upon our consolidated financial statements, which have been prepared in accordance with generally accepted accounting principles in the United States of America, or GAAP. The preparation of our consolidated financial statements requires us to make estimates and assumptions that affect the reported amounts of assets, liabilities, revenue and expenses and related disclosure of contingent assets and liabilities. Our actual results may differ from these estimates. On an on-going basis, we evaluate our estimates based upon historical experience and various other assumptions that we believe to be reasonable under the circumstances, the results of which form the basis for making judgments about the carrying values of assets and liabilities that are not readily apparent from other sources. These estimates may change as new events occur, additional information is obtained and our operating environment changes. We believe the following critical accounting policies reflect our more significant estimates and assumptions used in the preparation of our financial statements.
Accounts receivable
We record accounts receivable at the invoiced amount when our products are shipped to customers or, in the case of certain custom lighting projects, upon the completion of specific milestone billing requirements. Our accounts receivable balance is recorded net of allowances for amounts not expected to be collected from our customers. This allowance for doubtful accounts is our best estimate of probable credit losses in our existing accounts receivable. Estimates used in determining the allowance for doubtful accounts are based on historical collection experience, aging of receivables and known collectability issues. We write off accounts receivable when it becomes apparent, based upon age or customer circumstances that such amounts will not be collected. We review our allowance for doubtful accounts on a quarterly basis. Recovery of bad debt amounts previously written off are recorded as a reduction of bad debt expense in the period the payment is collected. Generally, we do not require collateral for our accounts receivable and we do not regularly charge interest on past due amounts.
Inventories
Inventories, which consist of raw materials and purchased components and subsystems, work-in-process and finished lighting products, are stated at the lower of cost or market. Cost of raw materials and purchased components and subsystems is primarily determined using a weighted average method. Slow product adoption,
37
Table of Contents
rapid technological changes and new product introductions and enhancements could result in excess or obsolete inventory. We evaluate inventory levels and expected usage on a periodic basis, to specifically identify obsolete, slow-moving or non-salable inventory.
Revenue recognition
Product sales are recorded when our products are shipped and title passes to customers. Where sales of product are subject to certain customer acceptance terms, revenue from the sale is recognized once these terms have been met. We recognize revenue on certain long-term, fixed price, custom lighting projects using the percentage of completion method measured by the ratio of costs incurred in a period to the estimated total costs to be incurred for each contract. Contract costs include all direct material, direct labor and other indirect costs related to contract performance. Provisions for estimated losses on uncompleted contracts are made in the period in which such losses are determined. Changes in job performance, job conditions, estimated profitability and final contract settlements may result in revisions to costs and income and are recognized in the period in which such revisions are determined.
For smaller or shorter term custom lighting projects or projects where estimated total costs cannot be determined, revenue is recognized using the completed contract method and revenue is recognized upon substantial completion and acceptance by the customer of each project. Amounts received as deposits against future completion of projects are recorded as unearned revenue until such projects are completed and title passes to the customer.
Product warranties
We provide a limited warranty covering defective materials and workmanship. We generally provide a five year warranty on our products, and such warranty may require us to repair, replace or reimburse the purchaser for the purchase price of the product. The estimated costs related to warranties are accrued at the time products are sold based on various factors, including our stated warranty policies and practices, the historical frequency of claims and the cost to repair or replace the products under warranty.
Income taxes
We employ the asset and liability method in accounting for income taxes. Under this method, deferred tax assets and liabilities are determined based on temporary differences between the financial reporting and tax bases of assets and liabilities and net operating loss carryforwards, and are measured using enacted tax rates and laws that are expected to be in effect when the differences are reversed.
We record a valuation allowance to reduce our deferred tax assets to the amount which we estimate is more likely than not to be realized. Our ability to realize our deferred tax assets is generally dependent on the generation of taxable income during the future periods in which the temporary differences are deductible and the net operating losses can be offset against taxable income. If we were to determine that we would be able to realize deferred tax assets in the future in excess of the net recorded amount, the resulting adjustment to deferred tax assets would increase net earnings in the period such a determination was made.
Impairment of long-lived assets
Long-lived assets such as property, equipment and definite lived intangible assets are reviewed for impairment when events and circumstances indicate that the carrying amount of an asset may not be recoverable. In making these determinations, we use certain assumptions, including, but not limited to: (i) estimations of the fair market value of the assets and (ii) estimations of the future cash flows expected to be generated by these assets, which are based on additional assumptions such as asset utilization, length of service the asset will be used in our operations and estimated salvage values. Recoverability of assets to be held and used is measured by
38
Table of Contents
a comparison of the carrying value of the assets to the estimated undiscounted future cash flows expected to be generated by the assets. If the carrying value of the assets exceeds the estimated future cash flows, an impairment charge is recognized in the amount by which the carrying amount of the assets exceeds fair value.
Intangible assets and goodwill
We record the assets acquired and liabilities assumed in business combinations at their respective fair values at the date of acquisition, with any excess purchase price recorded as goodwill. Valuation of intangible assets entails significant estimates and assumptions including, but not limited to, estimating future cash flows from product sales, developing appropriate discount rates, continuation of customer relationships and renewal of customer contracts and approximating the useful lives of the intangible assets acquired.
Intangible assets with estimable useful lives are amortized over their respective useful lives. We are currently amortizing our acquired intangible assets with definite lives over periods ranging from three to twenty years. Goodwill is not amortized, but instead we perform an annual goodwill impairment analysis, using the two-step method, at the end of our third quarter or whenever events or changes in circumstances indicate that the carrying value of goodwill may not be recoverable.
The recoverability of goodwill is measured at the reporting unit level. The fair value of each reporting unit is estimated using a discounted cash flow methodology. This analysis requires significant judgments, including estimation of future cash flows, which is dependent on internal forecasts, estimation of the long-term growth rate for the business, the useful life over which cash flows will occur and the determination of the weighted average cost of capital.
The internal forecasts used in our 2010 analysis were based on the expected impact of our continued sales channel expansion, roll-out of our new LED lighting product lines for which increasing demand is expected based on relevant third-party industry studies and the anticipated improvement in our gross and operating margins as we gain efficiencies with volume and supply chain optimization including the impact of our low-cost manufacturing of strategy. Should the global demand for LED lighting products be slower to develop, or if we are unable to successfully execute our strategic initiatives with respect to our target markets and profitability improvements, our actual operating results could be materially different than our internal forecasts.
If the fair value of a reporting unit is less than the carrying amount, goodwill of the reporting unit is considered impaired and the second step is performed. The second step of the impairment test, when required, compares the implied fair value of the reporting unit goodwill with the carrying amount of that goodwill. If the carrying amount of the reporting unit goodwill exceeds the implied fair value of that goodwill, an impairment charge is recognized for the amount equal to that excess.
Financial operations overview
Revenue
We derive revenue from the sale of our products and custom lighting solutions.
Product Revenue. Product revenue is derived primarily from the sale of an extensive and growing range of LED-based retrofit lamps and luminaires for specific indoor and outdoor general illumination applications in the residential, commercial, industrial and public infrastructure markets. We also sell LED light engines for integration into finished lighting products, but this business, which we entered through our acquisition of Lamina, was substantially scaled back following the closure of our New Jersey facility in the third quarter of 2009 and comprised a small portion of our revenues for the year ended December 31, 2010. In addition, our California facility, which comprised the operations of LED Effects, sold white and colored LED-based lamps and subsystems such as controllers and power supplies, that were integrated by OEMs and end-users into products for the gaming industry. The California facility also sold finished lighting products that were used in architainment,
39
Table of Contents
which involves the use of white- or color-lighting on building exteriors and interior spaces to create unique architectural elements. We discontinued the sale of products for the gaming industry upon the closure of our California facility in the fourth quarter of 2010.
Our product revenue is dependent on the continuing adoption of LED lighting in our target markets which in turn, relies on ongoing improvements in LED lighting performance as well as reductions in LED lighting cost. Accordingly, our ability to consistently introduce market leading products, in terms of both performance and cost per lumen, will impact our revenue growth through accelerating the use of LEDs as a replacement for existing lighting technologies as well as by increasing our share of the market. One factor that impacts the cost per lumen of our products is their selling prices. We expect our selling prices to generally decline over time and anticipate that these declines will be offset by increasing sales volume of our products. Our product revenue is also impacted by our ability to access end users of LED lighting products. Therefore, the success of our direct sales efforts and our ability to grow and effectively manage the roster of distributors and independent sales agents that sell our products is critical to our business. As we continue to hire more sales and marketing professionals, we expect to increase the frequency and impact of our activities with potential customers. We also depend heavily on the strength of our relationships with certain OEM and retail customers such as Osram Sylvania and The Home Depot which provide us with access to residential and commercial end users. We may experience significant inflections in growth as we enter into relationships with partners such as these and we will seek to develop similar relationships with new customers. Osram Sylvania and The Home Depot, accounted for 44% and 12% of our total revenue for the year ended December 31, 2010, respectively, and we expect revenues from each of these customers to increase as we further expand the number of our products that we sell through them. For the year ended December 31, 2010, product revenue represented approximately 95% of our total revenue, as compared to approximately 83% for the year ended December 31, 2009.
Custom Lighting Solutions Revenue. Custom lighting solutions revenue is derived from contracted lighting projects for the production of tailored lighting effects for architects, lighting designers and research. Our custom lighting solutions business was previously conducted primarily at our recently closed California facility and has been relocated to our Satellite Beach headquarters. Revenue from custom lighting projects varies from period-to-period depending on the number of active projects and the timing of the progress made on each project. Custom lighting solutions revenue has decreased as a percentage of revenues as we have increased our focus on our retrofit lamps and luminaires and we expect this trend to continue.
Cost of goods sold and gross profit
Cost of goods sold includes the cost of raw materials such as purchased components, subsystems and packaged LEDs used in the manufacture and assembly of our products as well as the cost of related inbound freight, manufacturing labor, production overhead and warranty costs. We also include provisions for excess and obsolete inventory in our cost of goods sold. In addition, the cost of the services provided by our contract manufacturing partner is included in cost of goods sold.
Raw materials, including purchased components, such as packaged LEDs, and subsystems represent the largest portion of our cost of goods sold and increase in conjunction with revenue growth. On a per unit basis, these costs generally decrease as we gain purchasing scale with increases in our revenues. In periods of rapidly increasing demand, however, we may incur higher costs to ensure adequate supply and to expedite shipping by means of premium inbound freight. These costs are typically higher the more dependent we are on a limited number of suppliers for specific parts as well as the greater the distance is between our production sites and such suppliers. We also may incur higher costs to the extent our supply chain management and production processes result in larger physical inventory variances or lower yields. Our manufacturing labor costs similarly increase in conjunction with revenue growth. Our manufacturing labor cost is impacted by significantly lower hourly wages at our Mexico site and the sites of our contract manufacturer in Asia, as compared to our Satellite Beach site. Our ability to accurately forecast product demand and manage our raw materials inventory also impacts our manufacturing labor cost by: (i) reducing idle time for workers awaiting missing materials and (ii) mitigating the
40
Table of Contents
need for costly overtime labor to make up for lost worker time, especially at our higher-cost Satellite Beach facility. Our raw materials and manufacturing labor costs are also dependent on our ability to reduce the component count and cost as well as manufacturing complexity of our products through innovative designs. The cost of production overhead generally declines on a per unit basis with an increase in throughput at our facilities through better execution and higher volumes of production. Accordingly newly introduced products typically have higher per unit costs until we gain supply chain and manufacturing process efficiencies. Our warranty costs depend both on the quality of our manufacturing processes as well as our ability to design products for greater reliability.
While we expect our cost of goods sold to increase in absolute terms as our revenues increase and we expand the scale of our operations, we anticipate it to decline as a percentage of revenues leading to higher gross margin. Key factors driving this planned gross margin improvement include the continued impact of greater purchasing scale, the migration of production to lower cost sites, the qualification of additional suppliers closer to our production sites and improvements in our forecasting and supply chain management. We expect to achieve these improvements in our forecasting and supply chain management through closer collaboration with our customers, implementation of our new ERP system and other initiatives led by our operations team that has recently been enhanced through the addition of experienced personnel.
Our gross margin is also affected by a number of other factors, including the average selling price of our products and our ability to offset declining prices with lower production costs. Our mix of products sold and the customers to whom they are sold also impact our gross margin as certain of our products have higher levels of profitability and we may contractually price our products at lower levels to certain customers based on volume expectations, contract duration and our own cost reduction roadmap. To the extent we have temporary manufacturing or supply chain inefficiencies, implementation of our cost reduction roadmap may be delayed resulting in unplanned declines in gross margin for certain products until these inefficiencies are addressed. Our gross margin is also impacted by foreign exchange rates when we sell our products in currencies that differ from those in which we incur our manufacturing costs. Gross margin for custom lighting solutions is also impacted by our ability to accurately forecast project costs and avoid delays or cost overruns due to technological or manufacturing issues. As we expand our manufacturing capacity, new or re-engineered products move into production and we add new customers, among other factors, our gross margin will continue to fluctuate from period-to-period.
Operating expenses
Operating expenses consist of sales and marketing, operations, research and development and general and administrative expenses. Personnel-related expenses comprise the most significant component of these expenses. We expect to hire a significant number of new employees in order to support our anticipated growth. In any particular period, the timing of additional hires could materially affect our operating expenses, both in absolute dollars and as a percentage of revenue.
Sales and Marketing Expenses. Sales and marketing expenses consist primarily of personnel-related expenses, sales commissions, samples and other marketing costs for new products and customers demonstrations, travel and other out-of-pocket expenses for marketing programs such as trade shows and industry conferences, cost of marketing materials and other corporate communications, customer service expenses, and direct and allocated facilities and other related overhead costs. Unbillable freight costs that are incurred to deliver products to our customers but for which they are not separately billed are also included in sales and marketing expenses. We intend to hire additional sales personnel, aggressively market our expanding product portfolio and build additional and deepen existing relationships with strategic partners, distributors and independent sales agents on a global basis. Accordingly, we expect that our sales and marketing expenses will continue to increase in absolute dollars though we believe they will decrease as a percentage of revenue as these initiatives achieve their anticipated result.
41
Table of Contents
Operations Expenses. Operations expenses consist primarily of personnel-related expenses for employees engaged in procurement, supply chain management and quality assurance activities as well as allocated facilities and other related overhead costs. We expect to hire additional procurement, supply chain management and quality assurance personnel to support the anticipated growth of our business during 2011. Accordingly, we expect that our operations expenses will continue to increase in absolute dollars though we believe they will decrease as a percentage of revenue over time.
Research and Development Expenses. Research and development expenses consist primarily of personnel-related expenses for employees engaged in the development of new products, the enhancement of existing products and research into new platform technologies related to power supplies, optics, thermal management and intelligent controls as well as into emerging uses for LED lighting including biological applications. Research and development expenses also include costs of lab materials and prototypes related to these activities and allocated facilities and other related overhead costs. We expense all of our research and development costs as they are incurred. Research and development expense is reported net of any funding received under contracts with governmental agencies and commercial customers that are considered to be cost sharing arrangements with no contractually committed deliverable. We expect research and development expenses to continue to increase as we invest further in the development of our product portfolio and technology, including by expanding our research and development headcount. We expect that our research and development expenses will continue to increase in absolute dollars though we believe they will decrease as a percentage of revenue over time.
General and Administrative Expenses. General and administrative expenses consist primarily of personnel-related expenses for employees involved in executive, finance, human resource and information technology functions, as well as fees for professional services, public company costs and allocated facilities and other related overhead costs. Professional services consist principally of external legal, accounting, tax and other consulting services. Public company costs include director fees, directors and officers insurance premiums, costs of compliance with securities, corporate governance and other regulations and investor relations expenses. Certain of these expenses, and in particular legal expenses due to patent litigation, are inherently hard to predict and may vary materially from period to period. We expect to incur higher general and administrative expenses as we hire additional personnel, including a new Chief Executive Officer, and enhance our infrastructure to support the anticipated growth of our business though we believe they will decrease as a percentage of revenue over time.
Restructuring Expenses. We record restructuring expenses associated with management approved restructuring plans to reorganize one or more of our business functions or to remove duplicative headcount and infrastructure associated with one or more locations. These items primarily include estimates of employee separation costs and the full amounts payable pursuant to lease obligations (net of sub-lease income), which we refer to as accrued rent costs. The timing of associated cash payments is dependent upon the type of restructuring expense and can extend over a multi-year period. Restructuring expenses are recorded based upon planned employee termination dates, site closures and consolidation plans and are not anticipated to be recurring.
42
Table of Contents
Results of operations
The following table sets forth statement of operations data expressed as a percentage of total revenue for the periods indicated (some items may not add due to rounding):
Year ended December 31, 2010 compared to year ended December 31, 2009
| For the Years
Ended December 31, |
Variance | Percentage
of Revenue |
||||||||||||||||||||||
| 2010 | 2009 | $ | % | 2010 | 2009 | |||||||||||||||||||
| Revenue |
$ | 53,169,013 | $ | 31,376,816 | 21,792,197 | 69.5 | % | 100.0 | % | 100.0 | % | |||||||||||||
| Cost of goods sold |
59,021,851 | 24,754,819 | 34,267,032 | 138.4 | % | 111.0 | % | 78.9 | % | |||||||||||||||
| Sales and marketing |
11,107,379 | 7,200,323 | 3,907,056 | 54.3 | % | 20.9 | % | 22.9 | % | |||||||||||||||
| Operations |
4,834,592 | 8,165,066 | (3,330,474 | ) | -40.8 | % | 9.1 | % | 26.0 | % | ||||||||||||||
| Research and development (1) |
10,246,511 | 6,600,352 | 3,646,159 | 55.2 | % | 19.3 | % | 21.0 | % | |||||||||||||||
| General and administrative |
17,753,656 | 20,753,513 | (2,999,857 | ) | -14.5 | % | 33.4 | % | 66.1 | % | ||||||||||||||
| Restructuring expenses (1) |
1,101,992 | 1,111,189 | (9,197 | ) | -0.8 | % | 2.1 | % | 3.5 | % | ||||||||||||||
| Impairment of goodwill and other long-lived assets |
11,548,650 | — | 11,548,650 | * | 21.7 | % | 0.0 | % | ||||||||||||||||
| Depreciation and amortization |
2,867,866 | 5,327,033 | (2,459,167 | ) | -46.2 | % | 5.4 | % | 17.0 | % | ||||||||||||||
| Interest income |
3,450 | 1,104 | 2,346 | 212.5 | % | 0.0 | % | 0.0 | % | |||||||||||||||
| Interest expense, including related party |
(3,501,056 | ) | (6,058,693 | ) | 2,557,637 | -42.2 | % | -6.6 | % | -19.3 | % | |||||||||||||
| (Increase) decrease in fair value of liabilities under derivative contracts |
(150,557,529 | ) | 2,731 | (150,560,260 | ) | * | -283.2 | % | 0.0 | % | ||||||||||||||
| Dividends on preferred stock |
(3,534,795 | ) | (37,356 | ) | (3,497,439 | ) | * | -6.6 | % | -0.1 | % | |||||||||||||
| Accretion of preferred stock |
(73,077,280 | ) | (126,017 | ) | (72,951,263 | ) | * | -137.4 | % | -0.4 | % | |||||||||||||
| Other income (expense), net |
(281,352 | ) | 203,731 | (485,133 | ) | -238.1 | % | -0.5 | % | 0.6 | % | |||||||||||||
| Income tax benefit |
(1,123,107 | ) | (413,002 | ) | (710,105 | ) | 171.9 | % | -2.1 | % | -1.3 | % | ||||||||||||
| Net loss |
$ | (295,138,939 | ) | $ | (48,136,927 | ) | (247,002,012 | ) | 513.1 | % | -555.1 | % | -153.4 | % | ||||||||||
| * | Variance is not meaningful. |
| (1) | During 2010, we modified the presentation of our operating expenses to separately convey research and development and restructuring expenses in our consolidated statement of operations and comprehensive loss. This table reflects management’s modified presentation for all periods presented. |
Revenues
Revenues increased $21.8 million, or 69.5%, to $53.2 million for the year ended December 31, 2010 from $31.4 million for the year ended December 31, 2009. The increase in revenues was primarily a result of our introduction of approximately 50 new LED retrofit lamps and luminaires for general illumination during the year ended December 31, 2010, the addition or expansion of relationships with key customers for retrofit lamps including The Home Depot and several branded lighting OEMs and the continued increase in market adoption of LED lighting for general illumination. The increase in sales of retrofit lamps and luminaires was partially offset by reductions in sales of our other products that we continued to deemphasize or phase out as we restructured and closed our operations in New Jersey and California during the years ended December 31, 2010 and 2009. Revenues from custom lighting solutions also declined during the year ended December 31, 2010, contributing to the decision to close the California office.
Cost of goods sold
Cost of goods sold increased $34.3 million, or 138.4%, to $59.0 million for the year ended December 31, 2010 from $24.8 million for the year ended December 31, 2009. The increase in cost of goods sold was primarily due to the corresponding increase in sales during the year ended December 31, 2010.
43
Table of Contents
Cost of goods sold as a percentage of revenues increased for the year ended December 31, 2010 to 111.0% (or a negative gross margin of 11.0%) as compared to 78.9% (or a gross margin of 21.1%) for the year ended December 31, 2009. The increase in cost of goods sold as a percentage of revenue was primarily the result of higher than normal costs for the initial launch of new products and inefficiencies related to our efforts to meet accelerated production schedules associated with faster than anticipated growth in demand for our products and included:
| • | expedited materials delivery by means of premium freight; |
| • | spot purchases of long lead-time materials at higher than our normal contracted prices; |
| • | higher than expected wages as a result of our newly developed supply chain, the rapid expansion and training of our labor force and delays in establishing lower cost internal and third-party contract manufacturing and assembly capacity. |
Because these inefficiencies primarily related to our rapidly growing retrofit lamps business rather than our currently higher margin luminaire and custom solutions business, mix of products negatively impacted gross margin during the year ended December 31, 2010. We also experienced an increase in the provision for excess and obsolete inventory for the year ended December 31, 2010 related to the phasing out of certain products by our Netherlands and California operations as part of our restructuring efforts.
Sales and marketing
Sales and marketing expenses increased $3.9 million, or 54.3%, to $11.1 million for the year ended December 31, 2010 from $7.2 million for the year ended December 31, 2009. The increase in sales and marketing expenses was primarily due to an increase in variable costs in conjunction with the increase in sales for the year ended December 31, 2010. Specifically, freight not billed to customers and commissions increased $2.1 million and $533,000, respectively. In addition, samples and marketing costs increased with the historically high number of new products launched during the year and increased customer demonstrations as we increased our sales and marketing activity, and personnel expenses also increased due to the expansion of our sales and marketing group in support of our increased direct sales initiatives and in an effort to better manage our growing roster of strategic account customers and distribution and independent sales partners.
Operations
Operations expenses decreased $3.3 million, or 40.8%, to $4.8 million for the year ended December 31, 2010 from $8.2 million for the year ended December 31, 2009. The decrease in operations expenses was primarily due to a decrease in both personnel and overhead costs as a result of the closing of our Texas and New Jersey facilities in the second and third quarters of 2009, respectively.
Research and development
Research and development expenses increased $3.6 million, or 55.2%, to $10.2 million for the year ended December 31, 2010 from $6.6 million for the year ended December 31, 2009. The increase in research and development expenses was primarily due to costs related to our historically high number of new product introductions during the year ended December 31, 2010 and in support of the development of numerous new products to be launched in 2011. Additionally, we significantly increased our investment in new platform technologies related to power supplies, optics, thermal management and intelligent controls as well as into emerging uses for LED lighting including biological applications. The increase in research and development expenses was partially offset by the decrease in research and development expenses resulting from the closing of our New Jersey facility during the year ended December 31, 2009.
General and administrative
General and administrative expenses decreased $3.0 million, or 14.5%, to $17.8 million for the year ended December 31, 2010 from $20.8 million for the year ended December 31, 2009. The decrease in general and administrative expenses was primarily due to: (i) a decrease in legal fees of $1.7 million as a result of the
44
Table of Contents
resolution of our litigation with Philips and its affiliates in August 2009, (ii) a $1.1 million reversal of non-vested restricted stock expense during the year ended December 31, 2010 due to the forfeiture of awards upon the termination or resignation of certain employees, and (iii) reductions in personnel and overhead costs of $1.1 million as a result of the closing of our Texas and New Jersey facilities in the second and third quarters of 2009, respectively. The decreases in general and administrative expenses were partially offset by an increase in professional and legal fees of $162,000 related to the Recapitalization, as well as an increase in consulting fees of $431,000 associated with our efforts to improve our internal controls and procedures framework.
Restructuring expenses
Restructuring expenses decreased $9,000, or 0.1%, to $1.1 million for the year ended December 31, 2010 from $1.1 million for the year ended December 31, 2009. Restructuring expenses for the year ended December 31, 2010 consisted of $1.7 million in severance and termination benefits and accrued rent costs related to the closing of our California office and restructuring of our Netherlands office in the fourth quarter of 2010. These expenses were partially offset by a $601,000 gain on the exit of our Japanese operations in July 2010. Restructuring expenses for the year ended December 31, 2009 consisted of severance and termination benefits and accrued rent costs related to the closing of our Texas and New Jersey facilities and the initial restructuring of our California operations.
Impairment of goodwill and other long-lived assets
Due to on-going negative cash flows and other factors at our Netherlands operations, we performed an impairment analysis of the assets of LSGBV to determine whether any goodwill or other intangible assets were impaired as of June 30, 2010. This review included an assessment of industry factors, contract retentions, cash flow projections and other factors we deemed relevant. As a result of this analysis, we determined that the LSGBV assets were materially impaired. These impairments resulted in new fair values for the associated goodwill and other intangible assets.
We also performed an impairment analysis of the intangible assets related to LED Effects as of December 31, 2010 due to the greater than anticipated headcount reductions associated with the closing of our California based operations and the relocation of certain of its personnel and operations to our Satellite Beach headquarters. As a result of this analysis, we determined that the LED Effects intangible assets were materially impaired.
The following table summarizes the total impairment charges recorded in 2010:
| Goodwill arising on the acquisition of LSGBV |
$ | 3,529,609 | ||
| Trademarks acquired on the acquisition of LSGBV |
191,500 | |||
| Customer relationships acquired on the acquisition of LSGBV |
1,967,400 | |||
| License agreements acquired on the acquisition of LSGBV |
4,766,500 | |||
| Trademarks acquired on the acquisition of LED Effects |
533,975 | |||
| Customer relationships acquired on the acquisition of LED Effects |
559,666 | |||
| Total impairment of goodwill and other long-lived assets |
$ | 11,548,650 | ||
Depreciation and amortization
Depreciation and amortization expense decreased $2.5 million, or 46.2%, to $2.9 million for the year ended December 31, 2010 from $5.3 million for the year ended December 31, 2009. The decrease in depreciation and amortization expense was due to changes in the estimated useful lives of certain intangible assets that occurred during the year ended December 31, 2009. In addition, the closing of the New Jersey facility in the third quarter of 2009 resulted in the disposal of certain leasehold improvements and production equipment, which reduced depreciation expense for the year ended December 31, 2010 as compared to the year ended December 31, 2009.
45
Table of Contents
Interest income
Interest income increased $2,000 for the year ended December 31, 2010 to $3,000 from $1,000 for the year ended December 31, 2009. For both periods, interest income was primarily due to interest earned by our interest bearing bank account in Australia.
Interest expense, including related party
Interest expense, including related party decreased $2.6 million, or 42.2%, to $3.5 million for the year ended December 31, 2010 from $6.1 million for the year ended December 31, 2009. The decrease in interest expense was primarily due to the conversion of the principal and accrued interest underlying the convertible notes issued to Pegasus IV and Philips in 2009 into Series D Units in March 2010, and the payment in full of the outstanding principal balance on our BMO line of credit in April 2010 and again in June 2010, which resulted in smaller outstanding debt balances during the year ended December 31, 2010 as compared to the year ended December 31, 2009. Interest expense for the year ended December 31, 2010 consisted primarily of: (i) $1.0 million for the acceleration of prepaid fees related to the issuance of the Series D and Series E Units in the first half of 2010; (ii) $955,000 of interest expense related to the convertible notes issued to Pegasus IV and Philips; (iii) $906,000 of guaranty fees payable to Pegasus IV related to the BMO line of credit, which we terminated in October 2010; (iv) $367,000 of interest expense related to the BMO line of credit; (v) $133,000 of interest expense related to LSGBV’s debt facilities; and (vi) $53,000 of interest expense and fees related to our Wells Fargo line of credit, which we entered into in November 2010. The prepaid fees related to the Series D and Series E Units were being amortized over the life of the Series D and Series E Preferred Stock underlying the Series D and Series E Units and were fully expensed as of September 30, 2010 upon the conversion of the shares of Series D and Series E Preferred Stock underlying the Series D and Series E Units into common stock in conjunction with the Recapitalization. Interest expense for the year ended December 31, 2009 consisted primarily of: (i) $3.2 million of interest expense related to the convertible note initially issued to Pegasus IV in May 2009 and the convertible note issued to Philips in August 2009; (ii) $1.9 million of guaranty and transaction fees related to the BMO line of credit, which we entered into in July 2008; (iii) $848,000 of interest expense related to the BMO line of credit; and (iv) $259,000 of interest expense related to LSGBV’s debt facilities.
(Increase) decrease in fair value of liabilities under derivative contracts
Prior to the Recapitalization, the Series D Warrants and Series E Warrant underlying the Series D and Series E Units were accounted for as liabilities and their fair values were determined using the Monte Carlo valuation method. The fair value of the Series D Warrants increased by $155.5 million from March 3, 2010, the initial issuance date of the Series D Units that included the Series D Warrants, through December 21, 2010, the date on which the shares of Series D Preferred Stock underlying the Series D Units were converted into shares of our common stock, primarily due to an increase in the price of our common stock during this period. The fair value of the Series E Warrant decreased by $5.0 million from June 23, 2010, the issuance date of the Series E Units that included the Series E Warrant, through September 30, 2010, the date on which the Series E Warrant underlying the Series E Units was exchanged for shares of our common stock, primarily due to a decrease in the price of our common stock during this period. For the year ended December 31, 2009, the decrease in fair value of liabilities under derivative contracts of $3,000 related to changes in the fair value of warrants issued to certain directors and officers and was primarily due to a decrease in the price of our common stock during this period.
Dividends on preferred stock
Dividends on preferred stock increased $3.5 million for the year ended December 31, 2010 to $3.5 million from $37,000 for the year ended December 31, 2009. For the year ended December 31, 2010, $3.5 million of
46
Table of Contents
dividends were incurred on the Series D and Series E Preferred Stock underlying the Series D and Series E Units. The Series D Units were initially issued in March 2010 and the Series E Units were issued in June 2010. For the year ended December 31, 2009, we paid dividends on our 6% Convertible Preferred Stock. All outstanding shares of 6% Convertible Preferred Stock were redeemable on May 10, 2010. As of December 31, 2010, 186,528 shares of the 6% Convertible Preferred Stock had been redeemed for $597,000. Upon presentment by the holders thereof, an additional 10,374 shares of 6% Convertible Preferred Stock will be redeemed for $33,000. For the year ended December 31, 2010, we paid $20,000 of dividends on our 6% Convertible Preferred Stock.
Accretion of preferred stock
Accretion of preferred stock increased $73.0 million for the year ended December 31, 2010 to $73.1 million from $126,000 for the year ended December 31, 2009. For the year ended December 31, 2010, $73.0 million of accretion expense was incurred on the Series D and Series E Preferred Stock underlying the Series D and Series E Units. The Series D Units were initially issued in March 2010 and the Series E Units were issued in June 2010. The preferred stock was being accreted over the life of the Series D and Series E Preferred Stock, but was fully expensed as of September 30, 2010 upon the conversion of the Series D Preferred Stock underlying the Series D Units and the exchange of the Series E Preferred Stock underlying the Series E Units into shares of our common stock in December and September 2010, respectively, pursuant to the Recapitalization Agreement. For the year ended December 31, 2010, $44,000 of accretion expense was also incurred on our outstanding shares of 6% Convertible Preferred Stock. For the year ended December 31, 2009, $126,000 in accretion expense was incurred on our outstanding shares of 6% Convertible Preferred Stock.
Other income (expense), net
Other income (expense), net decreased $484,000 for the year ended December 31, 2010 to other expense of $281,000 from other income of $204,000 for the year ended December 31, 2009. Other income (expense) for the years ended December 31, 2010 and 2009 was primarily due to the effect of foreign exchange translations at LSGBV.
Income tax benefit
Income tax benefit increased $710,000 for the year ended December 31, 2010 to $1.1 million from $413,000 for the year ended December 31, 2009. The income tax benefit recognized during the year ended December 31, 2010 was mainly due to the establishment of an additional valuation allowance of $1.1 million for deferred tax liabilities recorded by LSGBV. For the year ended December 31, 2010, the effective tax rate of 0.4% differed from the federal statutory rate of 34% due to an anticipated loss for fiscal 2010. Pursuant to the requirements of FASB ASC Topic 740, tax benefits are not recognized on anticipated losses.
Because of our history of operating losses, management deemed that it was more-likely-than-not that we would not recognize a significant portion of these deferred tax assets and the tax benefits relating to our losses were fully offset by a valuation allowance as of December 31, 2010.
47
Table of Contents
Year Ended December 31, 2009 Compared to Year Ended December 31, 2008
| For the Years Ended December 31, | Variance | Percentage
of Revenue |
||||||||||||||||||||||
| 2009 | 2008 | $ | % | 2009 | 2008 | |||||||||||||||||||
| Revenue |
$ | 31,376,816 | $ | 20,758,593 | 10,618,223 | 51.2 | % | 100.0 | % | 100.0 | % | |||||||||||||
| Cost of goods sold |
24,754,819 | 16,688,600 | 8,066,219 | 48.3 | % | 78.9 | % | 80.4 | % | |||||||||||||||
| Sales and marketing |
7,200,323 | 5,847,833 | 1,352,490 | 23.1 | % | 22.9 | % | 28.2 | % | |||||||||||||||
| Operations |
8,165,066 | 6,453,867 | 1,711,199 | 26.5 | % | 26.0 | % | 31.1 | % | |||||||||||||||
| Research and development (1) |
6,600,352 | 7,332,296 | (731,944 | ) | -10.0 | % | 21.0 | % | 35.3 | % | ||||||||||||||
| General and administrative |
20,753,513 | 23,224,561 | (2,471,048 | ) | -10.6 | % | 66.1 | % | 111.9 | % | ||||||||||||||
| Restructuring expenses (1) |
1,111,189 | — | 1,111,189 | * | 3.5 | % | 0.0 | % | ||||||||||||||||
| Impairment of goodwill and other long-lived assets |
— | 53,110,133 | (53,110,133 | ) | * | 0.0 | % | 255.8 | % | |||||||||||||||
| Depreciation and amortization |
5,327,033 | 4,354,028 | 973,005 | 22.3 | % | 17.0 | % | 21.0 | % | |||||||||||||||
| Interest income |
1,104 | 188,460 | (187,356 | ) | -99.4 | % | 0.0 | % | 0.9 | % | ||||||||||||||
| Interest expense, including related party |
(6,058,693 | ) | (1,425,446 | ) | (4,633,247 | ) | 325.0 | % | -19.3 | % | -6.9 | % | ||||||||||||
| Decrease in fair value of liabilities under derivative contracts |
2,731 | 415,628 | (412,897 | ) | -99.3 | % | 0.0 | % | 2.0 | % | ||||||||||||||
| Dividends on preferred stock |
(37,356 | ) | (533 | ) | (36,823 | ) | * | -0.1 | % | 0.0 | % | |||||||||||||
| Accretion of preferred stock |
(126,017 | ) | (94,607 | ) | (31,410 | ) | 33.2 | % | -0.4 | % | -0.5 | % | ||||||||||||
| Other income (expense), net |
203,781 | (1,740 | ) | 205,521 | * | 0.6 | % | 0.0 | % | |||||||||||||||
| Income tax benefit |
(413,002 | ) | (2,207,507 | ) | 1,794,505 | -81.3 | % | -1.3 | % | -10.6 | % | |||||||||||||
| Net loss |
$ | (48,136,927 | ) | $ | (94,963,456 | ) | 46,826,529 | -49.3 | % | -153.4 | % | -457.5 | % | |||||||||||
| * | Variance is not meaningful. |
| (1) | During 2010, we modified the presentation of our operating expenses to separately convey research and development and restructuring expenses in our consolidated statement of operations and comprehensive loss. This table reflects management’s modified presentation for all periods presented. |
Revenues
Revenues increased $10.6 million, or 51.2%, to $31.4 million, for the year ended December 31, 2009 from $20.8 million for the year ended December 31, 2008. Revenues for the year ended December 31, 2009 consisted primarily of sales of LED retrofit lamps and luminaires, light engines and components to OEMs for general illumination, the gaming and retail display sectors and the delivery of four major custom projects in Asia, Europe and North America. The increase in revenues was primarily a result of our acquisition of LSGBV (the operations of which are included for eight months in fiscal 2008 compared to twelve months in fiscal 2009), the purchase of the net assets of Lamina (the operations of which are included for five months in fiscal 2008 compared to twelve months in fiscal 2009), increased sales of lamps and luminaires as we introduced several new products in the second half of 2008 and in 2009 and as adoption of LED lighting for general illumination gained further traction and the delivery of four major custom projects. These increases were partially offset by reductions in sales of our other products which we continued to deemphasize or phase out as we restructured our California operations and closed our New Jersey facility during the year ended December 31, 2009.
Cost of goods sold
Cost of goods sold increased $8.1 million, or 48.3%, to $24.8 million for the year ended December 31, 2009 from $16.7 million for the year ended December 31, 2008. The increase in cost of goods sold was primarily due to the increase in revenues from large custom projects and the full year impact of our acquisitions of LSGBV and Lamina.
48
Table of Contents
Cost of goods sold as a percentage of revenues decreased for the year ended December 31, 2009 to 78.9% (or a gross margin of 21.1%) as compared to 80.4% (or a gross margin of 19.6%) for the year ended December 31, 2008. The decrease in cost of goods sold as a percentage of revenue was primarily the result of better custom project margins recognized on the custom projects completed in 2009.
Sales and marketing
Sales and marketing expenses increased $1.4 million, or 23.1%, to $7.2 million for the year ended December 31, 2009 from $5.8 million for the year ended December 31, 2008. The increase in sales and marketing expenses was primarily due to: (i) our acquisitions of LSGBV and Lamina and the effect of a full year of combined operations compared to a partial year of combined operations during the year ended December 31, 2008, (ii) increases in samples and other marketing costs related to new products launched in the second half of 2008 compared to a full year of expenses for the year ended December 31, 2009, and (iii) an increase in commissions resulting from the increase in sales during the year ended December 31, 2009.
Operations
Operations expenses increased $1.7 million, or 26.5%, to $8.2 million for the year ended December 31, 2009 from $6.5 million for the year ended December 31, 2008. The increase in operations expenses was primarily due to our acquisitions of LSGBV and Lamina and the effect of a full year of combined operations compared to a partial year of combined operations during the year ended December 31, 2008.
Research and development
Research and development expenses decreased $732,000, or 10.0%, to $6.6 million for the year ended December 31, 2009 from $7.3 million for the year ended December 31, 2008. The decrease in research and development expenses was primarily due to a reduction in contract labor costs.
General and administrative
General and administrative expenses decreased $2.5 million, or 10.6%, to $20.8 million for the year ended December 31, 2009 from $23.2 million for the year ended December 31, 2008. The decrease in general and administrative expenses was primarily due to reduced legal expenses as a result of the resolution of our litigation with Philips and its affiliates in August 2009and reductions in personnel and overhead costs as a result of the closing of our Texas and New Jersey facilities in the second and third quarters of 2009, respectively. These decreases in general and administrative expenses were partially offset by our acquisitions of LSGBV and Lamina and the effect of a full year of combined operations compared to a partial year of combined operations during the year ended December 31, 2008.
Restructuring expenses
Restructuring expenses for the year ended December 31, 2009 consisted of $1.1 million in severance and termination benefits and accrued rent costs related to the closing of our Texas and New Jersey facilities and the initial restructuring of our California operations.
Impairment of goodwill and other long lived assets
As of September 30, 2009, we completed our annual assessment of the fair value of our goodwill and determined that no impairment had occurred and therefore no impairment expense was recorded for the year ended December 31, 2009.
We performed an impairment analysis of our goodwill and other intangible assets during the fourth quarter of 2008 due to a number of factors that occurred during the year ended December 31, 2008, including: (i) delays in
49
Table of Contents
the development and launch of several new products, (ii) product failures, (iii) customer delays on custom projects, (iv) the lack of the availability of financing for customers to complete significant projects and installations, (v) the general slowdown in construction spending, and (vi) the reduction in the market price of our common stock. As a result of these factors, we reduced the sales and cash flow forecasts that we had otherwise relied on for our internal planning. This reduction in anticipated cash flows indicated that our intangible assets were materially impaired.
The following table summarizes the total impairment charges recorded in 2008:
| Goodwill arising on the acquisition of Lighting Science Group Corp |
$ | 42,605,552 | ||
| Technology and patents acquired on the acquisition of Lighting Science Group Corp |
2,419,984 | |||
| Goodwill arising on the acquisition of LSGBV |
6,159,000 | |||
| Trademarks acquired on the acquisition of LSGBV |
796,741 | |||
| Technology and patents acquired on the acquisition of LSGBV |
322,856 | |||
| Customer relationships acquired on the acquisition of LSGBV |
806,000 | |||
| Total impairment of goodwill and other long-lived assets |
$ | 53,110,133 | ||
Depreciation and amortization
Depreciation and amortization expense increased $973,000, or 22.3%, to $5.3 million for the year ended December 31, 2009 from $4.4 million for the year ended December 31, 2008. The increase in depreciation and amortization expense was primarily due to: (i) a $711,000 increase in amortization expense for certain definite-lived intangible assets due to a reduction in the estimated useful life of such assets, (ii) a $600,000 increase in amortization expense for certain software assets due to a reduction in the estimated useful life of such software, and (iii) an increase in depreciation expense related to tooling and molds and other production assets purchased in the second half of 2008.
Interest income
Interest income decreased $187,000 for the year ended December 31, 2009 to $1,000 from $188,000 for the year ended December 31, 2008 due to a decrease in cash balances during 2008. At December 31, 2008 and for all of 2009 there were limited funds available for investment in interest bearing investments.
Interest expense, including related party
Interest expense increased $4.6 million, or 325.0%, to $6.1 million for the year ended December 31, 2009 from $1.4 million for the year ended December 31, 2008. The increase in interest expense was primarily due to interest accrued on the convertible note initially issued to Pegasus IV in May 2009 and the convertible note issued to Philips in August 2009. Interest expense for the year ended December 31, 2009 consisted primarily of: (i) $3.2 million of interest expense related to the convertible notes issued to Pegasus IV and Philips, which included interest expense related to the promissory notes issued to Pegasus IV that were exchanged into the convertible note issued to Pegasus IV in May 2009; (ii) $1.9 million of guaranty and transaction fees related to the BMO line of credit, which we entered into in July 2008; (iii) $848,000 of interest expense related to the BMO line of credit; and (iv) $259,000 of interest expense related to LSGBV’s debt facilities. Interest expense for the year ended December 31, 2008 consisted of: (i) $674,000 of guaranty and transaction fees related to the BMO line of credit, which we entered into in July 2008; (ii) $362,000 of interest expense on the BMO line of credit; (iii) $302,000 of interest expense related to LSGBV’s debt facilities; and (iv) $61,000 of interest expense related to promissory notes issued to Pegasus IV and certain executives in December 2008.
Decrease in fair value of liabilities under derivative contracts
The decrease in fair value of derivative financial instruments for the years ended December 31, 2009 and 2008 related to changes in the fair value of warrants issued to certain directors and officers. These warrants were
50
Table of Contents
accounted for as liabilities and recorded at fair value using the Black Scholes valuation method. The decreases in fair value for the years ended December 31, 2009 and 2008 were primarily due to changes in the price of our common stock and changes in the expected life of these warrants during these periods.
Dividends on preferred stock
Dividends on preferred stock increased $37,000 for the year ended December 31, 2009 to $37,000 from $1,000 for the year ended December 31, 2008. For the years ended December 31, 2009 and 2008, we incurred dividends on our 6% Convertible Preferred Stock, which we issued in May 2005.
Accretion of preferred stock
Accretion of preferred stock increased $31,000 for the year ended December 31, 2009 to $126,000 from $95,000 in the year ended December 31, 2008. For the years ended December 31, 2009 and 2008, accretion expense was incurred on our 6% Convertible Preferred Stock, which we issued in May 2005.
Other income (expense), net
Other income (expense), net increased $205,000 to other income of $203,000 for the year ended December 31, 2009 from other expense of $2,000 for the year ended December 31, 2008. Other income (expense) for the years ended December 31, 2009 and 2008 was primarily due to the effect of foreign exchange translations at LSGBV.
Income tax benefit
Income tax benefit decreased $1.8 million, or 81.3%, to $413,000 for the year ended December 31, 2009 from $2.2 million for the year ended December 31, 2008. The income tax benefit recognized during the year ended December 31, 2009 was mainly due to the establishment of an additional valuation allowance of $40.5 million recorded against the net deferred tax assets. Due to our history of net losses, management deemed it more-likely-than-not that we would not recognize a significant portion of our deferred tax assets as of December 31, 2009.
Liquidity and capital resources
We have experienced significant net losses as well as negative cash flows from operations since our inception. Our cash outflows primarily relate to procurement of materials, components and subsystems used in the manufacture and assembly of our products and payment of salaries, benefits and other operating costs. Our anticipated growth is expected to significantly increase our working capital needs during 2011 and meeting these needs will be an ongoing challenge. Our primary sources of liquidity have been sales of preferred and common stock to, and short-term loans from, affiliates of Pegasus Capital and, to a lesser extent, borrowings under our credit facilities.
We have historically been dependent on affiliates of Pegasus Capital for our liquidity needs because other sources of liquidity have been insufficient or unavailable to meet our needs.
On October 4, 2010, we terminated our revolving line of credit with the Bank of Montreal and the related guaranty agreement pursuant to the terms of the Recapitalization Agreement. On November 22, 2010, we entered into an asset-based revolving credit facility with Wells Fargo Bank, N.A. that provides us with borrowing capacity of up to 85% of our applicable and eligible inventory and accounts receivable plus qualified cash, up to a maximum of $15.0 million. As of December 31, 2010, we had approximately $4.7 million outstanding under the Wells Fargo line of credit and additional borrowing capacity of approximately $9.5 million.
51
Table of Contents
LSGBV has negotiated short- and long-term debt facilities with ABN AMRO Bank. The long-term debt facility with ABN AMRO matured on December 15, 2010. As of December 31, 2010, we had $226,000 outstanding under the short-term ABN AMRO line of credit. LSGBV also has an asset-based lending facility with IFN Finance that provides us with borrowing capacity of up to 82% of LSGBV’s trade receivable invoices, up to a maximum of €1.5 million. As of December 31, 2010, we had approximately $1.2 million outstanding under the IFN Finance line of credit.
As of December 31, 2010, we had cash and cash equivalents of approximately $14.5 million. In January 2011, we received approximately $18.0 million from a private placement of our common stock led by our affiliates, including Pegasus Capital and two of our directors, and expect to receive $7.0 million in life insurance proceeds during 2011 from a key-man life insurance policy issued on Zachary Gibler, our former Chairman and Chief Executive Officer. Upon receipt of the proceeds from such life insurance policy and this offering, we believe we will be able to fund our operations for at least the next 12 months. However, given the rapid anticipated growth in our business and our cash flow needs to support this growth, we may need to raise additional capital through the issuance of equity, equity-related or debt securities or through additional borrowings from financial institutions in the future. We cannot be certain that these additional funds will be available on terms satisfactory to us or at all.
Contractual obligations
As of December 31, 2010, payments to be made pursuant to significant contractual obligations were as follows:
| Payments Due By Period | ||||||||||||||||
| Total | Less Than One Year |
One to Three Years |
Three to Five Years |
|||||||||||||
| Operating lease obligations |
$ | 3,118,862 | $ | 1,273,003 | $ | 1,195,058 | $ | 650,801 | ||||||||
| Purchase obligations |
2,489,239 | 2,489,239 | — | — | ||||||||||||
| Other long-term liabilities |
— | — | — | — | ||||||||||||
| Total |
$ | 5,608,101 | $ | 3,762,242 | $ | 1,195,058 | $ | 650,801 | ||||||||
Operating lease obligations include rental amounts due on leases of certain office and manufacturing space under the terms of non-cancelable operating leases. These leases expire at various times through December 2015. All of the lease agreements provide for adjustments for increases in base rent (up to specific limits), property taxes and general property maintenance that would be recorded as rent expense, if applicable.
Purchase obligations generally relate to the purchase of goods and services in the ordinary course of business such as raw materials, supplies and capital equipment. Our purchase obligations represent authorizations to purchase rather than binding agreements.
Cash flows
The following table summarizes our cash flow activities for the years ended December 31, 2010, 2009 and 2008.
| For the Years
Ended December 31, |
||||||||||||
| 2010 | 2009 | 2008 | ||||||||||
| Cash flow activities: |
||||||||||||
| Net cash used in operating activities |
$ | (45,390,604 | ) | $ | (31,159,329 | ) | $ | (28,792,901 | ) | |||
| Net cash used in investing activities |
(6,597,091 | ) | (1,111,656 | ) | (12,624,686 | ) | ||||||
| Net cash provided by financing activities |
66,321,185 | 31,978,374 | 30,726,264 | |||||||||
52
Table of Contents
Operating activities
Cash used in operating activities is net loss adjusted for certain non-cash items and changes in certain assets and liabilities. Net cash used in operating activities was $45.4 million, $31.2 million and $28.8 million for the years ended December 31, 2010, 2009 and 2008, respectively. Net cash used in operating activities increased for the year ended December 31, 2010 as compared to the year ended December 31, 2009 primarily due to a higher year over year net loss, which included certain non-cash reconciliation items comprised primarily of a $150.6 million increase in fair value of warrants, $73.1 million accretion of preferred stock, $3.5 million in accrued dividends on preferred stock, $11.5 million in goodwill and other long-lived assets impairment, $2.9 million in depreciation and amortization and $4.8 million of stock-based compensation expense. For the year ended December 31, 2009, non-cash reconciliation items included a $129,000 increase in fair value of warrants and accretion of preferred stock, $5.3 million in depreciation and amortization and $3.9 million of stock-based compensation expense. The increase in net loss for the year ended December 31, 2010, excluding these non-cash reconciliation items, was primarily a result of higher than normal costs for the initial launch of our new products and supply chain inefficiencies associated with faster than anticipated growth in demand for our products. For the year ended December 31, 2008, non-cash reconciliation items included $53.1 million in goodwill and other long-lived assets impairment, $4.4 million in depreciation and amortization and $8.0 million of stock-based compensation expense, which was partially offset by a $321,000 net benefit for a decrease in fair value of warrants and accretion of preferred stock. The increase in net loss for the year ended December 31, 2009, excluding these non-cash reconciliation items, was primarily a result of higher operating expenses following our acquisitions in 2008 and higher interest expense on increased borrowings.
Net cash used in operating activities driven by our net losses was partially offset by improvements in working capital. For the year ended December 31, 2010, accounts receivable increased $10.7 million due to the growth in our revenues, inventories increased $14.6 million due to the build-up of materials and components and finished products to support near-term demand for our products and prepaid expenses increased $4.0 million. These uses of cash were more than offset by a $29.2 million increase in accounts payable as we increased our procurement activities to support anticipated growth and a $2.5 million increase in accrued expenses and other liabilities. Working capital items were also a source of cash for the year ended December 31, 2009 as accounts receivable, inventories and prepaid expenses declined $1.6 million, $4.1 million and $300,000, respectively, and accounts payable and accrued expenses and other liabilities increased $1.1 million and $2.1 million, respectively. For the year ended December 31, 2008, net changes in accounts receivable, inventories, prepaid expenses, accounts payable and accrued expenses and other liabilities was a $2.2 million source of cash.
Investing activities
Cash used in investing activities primarily relates to the purchase of property and equipment and cash consideration for strategic acquisitions. Net cash used in investing activities was $6.6 million, $1.1 million and $12.6 million for the years ended December 31, 2010, 2009 and 2008, respectively. The increase in cash used in investing activities for the year ended December 31, 2010 was due to an increase in our capital expenditures as we continued to expand our production capacity at our headquarters in Satellite Beach, FL and established our new manufacturing facility in Monterrey, Mexico.
The decrease in cash used in investing activities for the year ended December 31, 2009 was due to a modest decrease in capital expenditures in 2009 and the absence of strategic acquisitions in 2009. Cash used in acquisitions for the year ended December 31, 2008 included $6.2 million for the purchase of LSGBV and $4.8 million for the purchase of the net assets of Lamina.
Financing activities
Cash provided by financing activities has historically been composed of net proceeds from various debt facilities and the issuance of common and preferred stock. Net cash provided by financing activities was $66.3
53
Table of Contents
million, $32.0 million and $30.7 million for the years ended December 31, 2010, 2009 and 2008, respectively. The increase in cash provided by financing activities for the year ended December 31, 2010 was a result of proceeds from the issuance of mandatorily redeemable Series D and Series E Preferred Stock and the issuance of common stock for $25.4 million, $30.0 million and $25.0 million, respectively. These proceeds were partially offset by $13.8 million in net repayments of short- and long-term borrowings. For the year ended December 31, 2009, cash provided by financing activities included $35.8 million in net proceeds from the issuance of promissory notes which was partially offset by $3.8 million in net repayments of short- and long-term borrowings. For the year ended December 31, 2008, cash provided by financing activities included $20.0 million in net proceeds from net short- and long-term borrowings and $10.7 million in proceeds from a private placement of our common stock and the exercise of common stock warrants.
54
Table of Contents
Overview
We design, develop, manufacture and market general illumination products that exclusively use LEDs as their light source. Our broad product portfolio includes LED-based retrofit lamps (replacement bulbs) that can be used in existing light fixtures and sockets as well as purpose-built LED-based luminaires (light fixtures), for many common indoor and outdoor residential, commercial, industrial and public infrastructure lighting applications. Our proprietary technology, differentiated design approach and key relationships throughout the LED lighting supply chain position us well as general illumination continues its transition to the use of LEDs as a replacement for existing lighting technologies.
LED lighting products offer numerous benefits as compared to products that employ other lighting technologies such as greater energy efficiency, longer lifetime, improved durability, increased environmental friendliness, digital controllability, smaller size and lower heat output. As the performance of LED lighting products continues to improve and their costs decline, the corresponding reduction in the total cost of ownership associated with LED lighting will further drive adoption in an increasing range of lighting applications. A March 2010 report by Strategies Unlimited, for example, estimated that the market for packaged LEDs used in general illumination was expected to be approximately $874.0 million in 2010, growing to over $4.3 billion by 2014. For our retrofit lamps and luminaires, the cost of packaged LEDs represent on average 35% of their sales prices. Therefore, the estimated market for LED lighting products will be necessarily larger.
We are a technology integrator with intricate knowledge of each of the main component technologies used in our products. Our in-house design and development of power supplies, thermal management solutions and optical systems used in our products along with our detailed specification of the packaged LEDs we incorporate into our products, provides us with a distinctive ability to manage the interrelationships between these components and subsystems. This system-based approach, combined with our thorough understanding of the requirements of each lighting application our products are designed to address, enables us to provide a broader and more relevant range of products that we believe deliver industry-leading performance and offer shorter payback periods relative to the products of our competitors. The performance advantage of our products can be measured by the combination of higher efficacy, light quality and reliability.
Our product offering has been adopted by leading retailers and OEMs of lighting products such as The Home Depot and Osram Sylvania that sell our products on a co-branded or private label basis, as well as by large end-users to whom we sell directly and through distributors, such as Harrah’s, Hilton, Simon Property and Starbucks. Notably, we are The Home Depot’s preferred provider and product development partner for LED retrofit lamps and luminaires, which are currently sold under its EcoSmart line on a co-branded basis. In addition, we sell our luminaires for use in large-scale infrastructure projects including, among others, those in Dallas, Mexico City, Salt Lake City and Washington, D.C. During the second half of 2010 alone, we sold over one million LED retrofit lamps, which we believe makes us one of the largest worldwide suppliers of LED retrofit lamps. We produced the first LED retrofit lamp to be successfully qualified for ENERGY STAR designation and, as of March 25, 2011, we designed and produced 58 ENERGY STAR-qualified LED retrofit lamps. ENERGY STAR is an international standard established by the U.S. Environmental Protection Agency, or the EPA, and the DOE that requires LED lighting products to meet stringent efficiency, quality and lifetime criteria.
As a pioneer in our industry, we have been producing and selling LED-based lighting products for nearly a decade. We manufacture and assemble our products both internally and through our contract manufacturer in Asia. Our internal manufacturing operations are currently based in our Monterrey, Mexico site, which commenced production in November 2010, and our Satellite Beach, Florida headquarters. Our revenue for the year ended December 31, 2010 was $53.2 million, representing an increase of 69.5% as compared to the year ended December 31, 2009. In order to meet the recent and expected growth in demand for our products, we have increased our headcount, including contractors, to approximately 600 as of December 31, 2010 from 210 as of December 31, 2009.
55
Table of Contents
Industry background
According to the Freedonia Group, an independent market research firm, the worldwide general lighting market, including sales of light fixtures and bulbs, was estimated to be in excess of $100 billion in 2009. This figure excludes the enormous cost of the energy required for lighting. The DOE estimates that lighting accounted for 25% of U.S. electricity consumption in 2009. Accordingly, adoption of energy efficient lighting is increasingly being acknowledged as a critical means to reduce energy consumption from an environmental perspective and to mitigate the need for investments in new electrical generation capacity.
LEDs, which are solid state semiconductor devices that emit light when electric current is passed through them, are, according to the DOE, the most promising technology for reducing energy consumption by lighting. Since the development of high brightness LEDs in the 1990s, LED technology has continued to advance rapidly. Currently available cool white LED lighting products boast an efficacy of as much as 92 lm/W and last as long as 50,000 hours while currently available warm white LED lighting products have an efficacy of as much as 66 lm/W which, as shown below, already compares very favorably to traditional lighting technologies today. While packaged LEDs have efficacies in excess of 200 lm/W, they experience lumen loss when integrated with other components and subsystems in a finished lighting product. As LED lighting technology continues to improve, its efficiency advantage will further increase. For example, a March 2010 study from the DOE projects that cool white LED luminaire efficacies will reach 121 lm/W in 2012 and 219 lm/W by 2020. We believe a significant portion of this improvement will be due to efficiencies gained in the areas core to our expertise rather than at the packaged LED level.
| Percentage of Annual U.S. Lighting Demand |
Primary Traditional Lighting Technologies |
Representative Efficacy (lm/W) (1) |
Estimated Lifetime (Hours) (1) | |||||||
| Lighting Sector |
Lumen hours (1) |
Watt hours (2) |
||||||||
| Commercial (retail stores, hospitality, offices) |
59% | 51% | Incandescent Fluorescent (in various forms) Compact fluorescent, or CFLs |
14 60-84 55 |
2,500 12,800-20,000 10,000 | |||||
| Industrial (warehouses, manufacturing facilities) |
20% | 14% | Fluorescent (in various forms) High intensity discharge, or HID (as listed under “Outdoor”) |
60-84 43-113 |
12,800-20,000 18,000-24,000 | |||||
| Outdoor (street lighting, parking garages, other large area lighting) |
11% | 8% | Mercury vapor Metal halide High pressure sodium Low pressure sodium |
43 80 100 113 |
24,000 20,000 20,000 18,000 | |||||
| Residential (home applications) |
10% | 27% | Incandescent Halogen CFLs |
13 16 55 |
1,200 3,000 10,000 | |||||
| (1) | Per Navigant Consulting report entitled Energy Savings Potential of Solid-State Lighting in General Illumination Applications 2010 to 2030 (February 2010) prepared for the DOE. Percentage of overall U.S. lighting market as measured in lumen hours of lighting demand as estimated for 2010. |
| (2) | For 2001 as per DOE report entitled Solid-State Lighting Research and Development: Multi-Year Program Plan (March 2010). |
In addition to greater efficacy and dramatically longer lifetime, LED lighting products also enjoy other important benefits relative to traditional sources of lighting, including:
| • | superior control as a result of being based upon a solid state digital technology that can be dynamically and, in response to external factors, automatically adjusted, allowing greater design flexibility in color changing, dimming and light distribution as well as the opportunity for even greater energy efficiency and novel functionality; |
| • | an ability to generate light at full intensity almost instantly upon demand, in contrast to fluorescent and HID that can take several minutes to reach full intensity; |
56
Table of Contents
| • | smaller size as a result of being powered by LEDs that are often less than one square millimeter in surface area, which enables new applications and differentiated end-product form factors; |
| • | greater directionality, or better ability to focus light where needed, which reduces light pollution and enables the use of fewer lumens of light for a given application, with an accompanying reduction in energy use; |
| • | an absence of hazardous materials such as mercury and lead that are used in other energy efficient lighting technologies, most notably fluorescents, including CFLs; and |
| • | lower heat radiation, which further mitigates energy costs through reduced need for cooling and expands the lighting applications in which LEDs can practically be used. |
LEDs have a demonstrated history of rapid adoption in various applications when their total cost of ownership, including both purchase price and ongoing energy and maintenance costs, declines to a point that warrants their use. Reductions in total cost of ownership, which are primarily driven by increased product efficacy and lower purchase prices, improve users’ return on investment in LED technology and shorten the payback period for LEDs relative to other lighting technologies. The exact payback period required to drive LED lighting adoption varies by application and end-user and is influenced by the perceived value of other benefits of LED lighting for a given application as well as individual end-user willingness to invest in the higher upfront cost of LED lighting. We expect that as payback periods further shorten, LED adoption will accelerate across a growing range of applications.
We believe there is a tremendous market opportunity for providers of LED general illumination products as LEDs continue to penetrate the broader lighting industry. The following trends, in addition to improving product efficacy and declining purchase prices, will play key roles in this industry transition:
| • | continuing improvements in LED technology that will further increase light quality; |
| • | increasing focus on energy efficiency among individuals as well as public and private entities; |
| • | greater demand for lighting solutions with design differentiation and enhanced functionality, including digital controls; |
| • | growing demand for electricity that may increasingly drive utilities and governmental agencies to provide greater financial incentives for energy efficient lighting technologies including LED lighting; |
| • | government regulations worldwide effectively eliminating incandescent bulb sales, including in the European Union by December 31, 2012 and in the United States by December 31, 2014; and |
| • | government programs aimed at promoting awareness and improving quality and user experience of energy efficient products, such as ENERGY STAR, which has established energy-efficiency accreditation and labeling guidelines for qualified products. |
In light of these trends, the market for LED lighting is expected to grow rapidly and capture an increasing proportion of the worldwide market for general illumination. A March 2010 report by Strategies Unlimited estimated that the market for packaged LEDs used in general illumination was expected to be approximately $874.0 million in 2010, growing to over $4.3 billion by 2014, representing a compound annual growth rate of approximately 49%. A large part of the near-term opportunity will be derived from the replacement of incandescent and fluorescent bulbs with LED retrofit lamps. A DOE study estimated that in 2001 there were approximately seven billion incandescent and fluorescent lamps or bulbs in the United States alone. Given the resulting magnitude of this potential opportunity for LED retrofit lamps, Strategies Unlimited projects the market for packaged LEDs used in retrofit lamps to grow from $168.0 million in 2010 to $2.6 billion by 2014, representing a compound annual growth rate of approximately 98%. Given that packaged LEDs are a small percentage of final product prices, the estimated market for LED lighting products will be necessarily larger.
57
Table of Contents
Our competitive strengths
We are a leading provider of LED retrofit lamps and luminaires for general illumination and believe the following competitive strengths have enabled us to achieve this position:
In-depth understanding of the lighting markets we serve. Bringing leading lighting products to market requires a deep understanding of how multiple components and subsystems function when integrated into an LED lighting product under actual operating conditions. Equally important is the knowledge of what attributes end users truly value for each application including potential tradeoffs between efficacy, lumen output, light color and quality, light distribution, control features (such as dimmability) and form factor. The ability to bring these knowledge sets together requires extensive experience in the lighting industry in addition to deep technology expertise. As key members of our management, sales and product development teams have spent the vast majority of their careers at traditional lighting companies, we believe we have the expertise to develop market leading products that address the specific needs of each application we target. We also dedicate significant resources, from product development through installation and after-market support, collaborating with our customers to ensure we meet their unique needs.
Extensive proprietary technology and know-how. We are a technology integrator with expertise in each of the key technologies used in our products. This expertise is complemented by a portfolio of 124 issued and pending U.S. patents that have been developed over the course of nearly a decade of operations. Key areas of our focus include:
| • | Power supplies and controls. We design, develop and manufacture most of the power supplies used in our products taking into consideration the exact specifications of the packaged LEDs and other components and subsystems being integrated as well as the intended application of the product. This enables us to optimize the performance of these other components and subsystems as well as improve characteristics of the power supply itself. It also allows us to introduce novel functionality though the integration of communications and control capabilities. |
| • | Thermal management solutions. We utilize proprietary design tools that employ highly accurate predictive modeling for the rapid design and development of efficient heat transfer solutions that are tailored to individual products and applications. This enables us to provide products that maintain their performance over time and are aesthetically pleasing. |
| • | Optical systems. We design and develop our own optical systems using advanced material science to improve product efficacy and optimize the intensity, direction, spectrum and spread of the light generated by our products for their intended applications. |
| • | LED technology. Our understanding of LED technology is critical for us to specify key attributes of the packaged LEDs we purchase from our suppliers. These specifications consider both the intended application of the product into which the LEDs are incorporated as well as the other components and subsystems with which they are integrated and by which they and the light they produce are impacted. For example, each packaged LED has a unique power input level that maximizes its efficacy, heat gradient that impacts its performance over time and light distribution and spectrum characteristics that must be shaped, altered and tuned by the phosphor and optical systems used. |
Comprehensive system-based approach. We are focused on the profound impact the interrelationships between key components and subsystems used in our retrofit lamps and luminaires have on product performance. Accordingly, we retain significant in-house capabilities for critical components and subsystems that provide us with what we believe is an important ability to finely tune them to improve their interoperability. For example, our power supplies, thermal management solutions and optical systems are designed and developed in-house and the packaged LEDs we incorporate into our products are supplied to us according to our detailed specifications. Our approach is in marked contrast to lighting competitors that purchase generic components and subsystems or subassemblies with multiple components and subsystems integrated with each other, which are not optimized for
58
Table of Contents
further integration into a final product or to meet the needs of specific lighting applications. The high level of collaboration between our research and development resources resulting from their co-location and our compressed management hierarchy also distinguishes us from those large competitors that, to the extent they have component capabilities, they often reside in discrete, often geographically dispersed, departments. In addition to helping us improve the performance of our products, our approach also helps reduce the number of parts used in our products which, in turn, lowers materials costs, simplifies the manufacturing process and reduces potential points of failure. For example, our 60 watt-equivalent A19 retrofit lamp incorporates 80 parts while the leading competitor’s product incorporates 151 parts.
Broad product portfolio sustained by rapid speed to market. We believe we are a leading provider of LED products for general illumination, not only in terms of overall product performance but also as measured by the breadth of our product portfolio and the speed of our new product introductions. Our products are developed using a modular approach that enables us to design and develop optimized components and subsystems that we use in multiple products while maintaining the flexibility to modify key attributes of these components and subsystems for the specific needs of individual applications. We believe this approach allows us to cost-effectively design and commercialize a broader range of retrofit lamps and luminaires at a faster rate than many of our competitors, as evidenced by our introduction of approximately 50 new products in 2010. This modular approach also results in an expedited approbation process with certifying agencies such as Underwriters Laboratories (UL), further reducing time to market. In addition, our related ability to rapidly design key components and subsystems around newly introduced packaged LEDs is a key contributor to our speed to market with performance leading products. Given the rapid pace of LED technology improvement and the resulting onset of LED adoption across an increasing range of lighting applications and inherent short product cycles, speed to market is a critical competitive advantage.
Broad market reach through established channels. We have successfully implemented a multi-faceted channel strategy, which utilizes co-branded and private label programs, our direct sales force, distributors and independent sales agents to address distinct market opportunities. Our retrofit lamp business benefits from key retailer and lighting OEM relationships, including with The Home Depot, the largest worldwide seller of light bulbs, for whom we serve as preferred provider and product development partner for LED retrofit lamps and luminaires on a co-branded basis, as well as our private label programs with Osram Sylvania and others, which provide us with access to a range of other large retailers and end-users. These relationships also provide us with the requisite scale to drive cost reductions across our product portfolio. Our direct sales force includes professionals with senior-level experience at diversified lighting companies including Acuity Brands, Inc., or Acuity Brands, Cooper Industries plc and Philips. This team is focused on sales of retrofit lamps and luminaires to key accounts for potential LED conversion in each of our target markets and has had success with customers such as Harrah’s, Hilton, Simon Property and Starbucks. We believe we are different from: (i) other companies exclusively focused on LED lighting on the basis of the extensive general illumination sales expertise and existing relationships of our sales force and (ii) larger diversified lighting companies on the basis of our absence of conflict from legacy lighting businesses. We also avail ourselves of an extensive network of experienced independent sales agents and distributors that cost effectively expand our geographic coverage and offer high levels of support for large projects in the public infrastructure and commercial and industrial end markets.
Flexible approach to component sourcing. The flexibility of our product designs and our ability to facilitate rapid design adjustments limit our dependence on any single technology or vendor in our supply chain. This latitude in our component sourcing, particularly for packaged LEDs, enables us to mitigate supply risk through a multi-sourcing strategy despite the aggressive expansion of our operations, and provides us with pricing leverage that is further enhanced by our position as one of the largest purchasers of lighting-class packaged LEDs. It also helps insulate us from potential technology changes that represent significant risks to less adaptable competitors, such as vertically integrated LED lighting companies and competitors that are reliant on a narrower range of packaged LEDs or those who purchase subassemblies that integrate some of the required
59
Table of Contents
components or subsystems. Nevertheless, we have cultivated preferred supplier relationships pursuant to which the packaged LEDs we purchase can be accurately tailored to our specifications with relatively short lead times.
Experienced personnel with proven ability to drive our strategies. Our long-standing focus on research and commercialization of LED lighting has been a guiding force in building our roster of talent. As a result, our senior management team consists of long-tenured lighting industry professionals as well as LED technology veterans and includes the innovators that formulated the key strategies that guide our current business approach and practices. Other key members of our team also have experience that is highly relevant to the unique dynamics of our industry as well as to our strategies. Our research and development team, for example, includes approximately 50 research scientists and engineers with Ph.D.s or Masters degrees in disciplines including power electronics, lighting, thermal and mechanical engineering, materials science and cellular and molecular biology. Together, they combine a thorough understanding of the sciences required to develop LED lighting products with significant lighting application experience. Our location on Florida’s “Space Coast” provides us with a deep pool of technical talent from the nearby facilities of NASA, the U.S. Air Force, GE Aerospace, Lockheed Martin Corporation, The Boeing Company and other high-tech businesses. Similarly, our sales and marketing force consists of approximately 40 lighting professionals, many of whom have prior experience in our markets and channels at traditional lighting companies.
Our strategies
Our objective is to leverage our leadership position in LED lighting products to become the leader in the overall lighting industry as LED adoption accelerates through the following strategies:
Improve our products while lowering their cost to sustain our market position. We expect each successive generation of our products to demonstrate enhanced performance and cost less than our existing products as measured by lumens per watt per purchase dollar. In addition to accelerating the adoption of LED lighting by improving returns on investment in LED lighting and driving down payback periods, this will help us sustain our current leadership position. We intend to accomplish this by accumulating improvements across all of our component and subsystem technologies and by availing ourselves of further efficiencies by way of their interoperation. These improvements will include innovations relating to new materials, designs and methods, which we believe will provide revolutionary, rather than evolutionary, gains in product performance and manufacturing cost. In addition, we will continue to rapidly optimize our technologies for the most recently introduced and typically higher efficacy packaged LEDs to which we often have early access. We also intend to employ our intellectual property portfolio along with our application-specific lighting expertise in the development of lighting concepts that incorporate the intelligent control enabled by solid state lighting technology to offer further reductions in cost of ownership and novel functionality to our customers.
Drive improvements in our manufacturing and supply chain operations. We are in the process of increasing production at our facility in Monterrey, Mexico, which opened in November 2010, as well as at our contract manufacturing partner in Asia. Our capacity migration and expansion plans are meant to ensure that we have adequate capacity to meet anticipated future demand for our products as well as to capture efficiencies that we expect will allow us to materially improve our profitability as we transfer high-volume manufacturing and assembly to these lower cost sites from our Satellite Beach, Florida facility. We expect to produce an increasing percentage of our products in Asia and Mexico and will continue to utilize our manufacturing operations in Satellite Beach to support our product development team’s efforts to launch new products until they reach full scale commercial volumes and to identify process improvements that drive cost reductions across the entire supply chain. In addition, we are increasingly sourcing critical components and subsystems from suppliers closer to our production sites, working with our customers to develop more robust demand forecasts and implementing new information technology systems to reduce lead times, expediting costs for inbound supplies and other operational inefficiencies.
Expand our market coverage. We will continue to invest in our sales channels to market in order to drive further adoption of LED general illumination as well as to improve our share of the market. In pursuit of this
60
Table of Contents
strategy, we are enlarging our direct sales force by adding experienced lighting professionals to increase the depth of our activity with key accounts in each of our target markets as well as to expand the number of accounts and markets on which we are focused. In particular, we expect new hires to provide us with the capacity to more fully penetrate existing customers for whom our projects to date may represent a small portion of their overall opportunity. We also continue to enlarge the sales team that manages our growing roster of independent sales agents and distributors for the infrastructure and commercial and industrial markets in order to provide these partners with better sales support. Additionally, we are focused on expanding our efforts in Europe and Asia as we introduce new products designed specifically for the requirements of those regions. We also intend to protect and expand our market coverage by taking a leadership role in the establishment of rebate programs applicable to LED lighting. While we do not believe rebates are necessary for the eventual expected large scale shift to LED lighting, any external financial support has the potential to meaningfully accelerate this transition. Accordingly, we have recently hired dedicated professionals to proactively engage with the constituents relevant to the establishment of rebate policy in order to guide policy implementation and to have our products included in rebate plans.
Expand our product offering to target further conventional lighting applications. We will significantly increase the range of applications that we target as the value proposition of LED lighting continues to improve. We follow a disciplined approach to the expansion of our business given the significant cost of developing customized solutions for particular applications and the need for a sufficiently large market opportunity to justify such investment. Further, our reputation and long-term success are dependent on providing high quality products that are well-suited to address the application-specific needs of our customers. Accordingly, we prioritize those applications for which we believe there are clear and compelling reasons from a return on investment and total cost of ownership perspective for a potential customer to adopt LED lighting. For example, we have not yet marketed a linear fluorescent replacement product for office applications because the overall economics are not yet sufficiently compelling for LED replacement despite our belief that we can provide a solution with an incrementally lower total cost of ownership than existing LED products for this application. We review our product development roadmap on an ongoing basis in light of a number of constantly changing factors, including improvements in our technology and that of our packaged LED and other suppliers as well as reductions in our product costs.
Extend our technology to non-traditional markets. We plan to develop products for novel applications beyond traditional lighting that can benefit from the unique properties of LED lighting. We believe these potential non-traditional markets help drive our culture of innovation as well as our understanding of LED technology. Many of these applications center around the precise wavelength control afforded by LEDs in concert with the importance of light as an environmental factor and energy input into the metabolism of microbes, plants and animals. Although these applications are not expected to meaningfully contribute to our revenue in the near future, they nevertheless may represent material market opportunities in addition to their promising social benefits. We intend to collaborate with our existing research partners in pursuit of these opportunities, including NASA, Jefferson Medical College, Bayer AG, the University of Florida and OakRidge National Laboratory.
Our products
We have developed an extensive product portfolio in three distinct product families (lamps; infrastructure luminaires; and commercial, architectural and residential luminaires), and also provide custom lighting solutions. We believe our products in each of our three families offer the best combination of lumen output, efficacy, cost per lumen and payback period. We intend to introduce a number of new products within each of our product families during 2011.
Lamps. We offer a broad range of LED retrofit lamps that are designed to fit into existing light fixtures and sockets. We believe these LED retrofit lamps are economically compelling replacements for traditional reflector and globe incandescent and incandescent halogen lamps. Our range of dimmable LED retrofit lamps exhibit
61
Table of Contents
consistent color and deliver excellent light distribution and brightness in commercial and residential lighting applications. Our line of retrofit lamps includes DEFINITY branded retrofit lamps which we sell directly to our customers and through distributors under the Lighting Science name as well as co-branded and private label retrofit lamps.
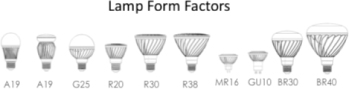
Above is a sampling of our retrofit lamps. Many of these lamp types are available in multiple beam spread and color temperatures to address specific lighting needs.`
Infrastructure luminaires. We offer LED luminaires that combine energy efficiency, long life, high lumen output and excellent light distribution, which makes them ideal for street lighting as well as for use in parking facilities, outdoor areas, warehouses and manufacturing areas. Our infrastructure luminaire product range includes: (i) the PROLIFIC Series Roadway Luminaire; (ii) the Pyramid Low Bay, Flat Low Bay and BAYLUME luminaires for use in parking garages; and (iii) the ShoeBox and WallPack luminaires for use in area and pathway and security lighting, respectively.
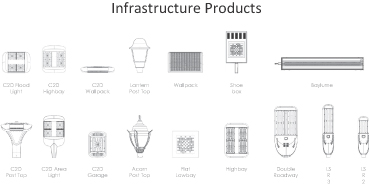
Above is a sampling of our infrastructure luminaire products.
Commercial, architectural and residential luminaires. We offer LED luminaires for the commercial, architectural and residential markets. Our SYMETRIE line of LED luminaires is designed for retail display applications and is available in various profiles and lengths and in color temperatures ranging from cool to warm. This line offers excellent color control to highlight the appearance of high value or perishable products without generating excessive heat and UV light that may damage these products as often happens with conventional lighting. We also offer LED-based spot, accent, recessed, pendant and track lighting, which offer uniform illumination and a more energy efficient alternative to incandescent halogen lighting to commercial customers. We are also in the process of launching a line of residential luminaires that will give consumers the opportunity to bring attractive and energy efficient LED lighting to their homes via purpose-built fixtures. Our architectural lighting products help architects, lighting designers and builders enhance building structures with light, color, movement and video in both interior and exterior applications. Many of these architectural lighting products are offered through our custom lighting solutions group.
62
Table of Contents
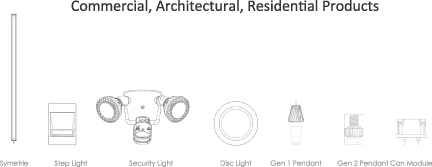
Above is a sampling of our commercial, architectural and residential luminaire products.
Custom lighting solutions. In addition to our three product families, we also offer custom LED lighting solutions that combine project management, system integration and advanced control systems and software to create desired lighting effects for architects, lighting designers and research projects. Solutions developed as part of these projects provide new insights into uses of light and the basis for new lighting fixtures for mainstream applications, in addition to generating revenues and brand awareness. Our custom projects cover a wide range of specialized applications, from the New York City Times Square New Year’s Eve Ball to energy efficient lighting for the International Space Station.
Our target markets and customers
We target applications across several markets for which the return on investment, total cost of ownership and other benefits of LED lighting currently present clear and compelling reasons for its use. In many instances the products we offer to our customers have less than a two year payback depending on the cost of electricity, the efficiency and useful life of the replaced lamps or luminaires, and other factors including customer-specific characteristics such as daily duration of lighting use and ease or cost of incumbent lighting technology replacement. The exact payback period required to drive LED lighting adoption varies by application and end-user and is influenced by the perceived value of other benefits of LED lighting for a given application as well as individual end-user willingness to invest in the higher upfront cost of LED lighting. We expect that as payback periods further shorten, LED adoption will accelerate across a growing range of applications and we expect to broaden our target applications and roster of customers accordingly.
We primarily target our product families to the following major markets:
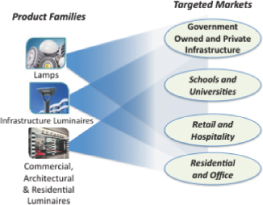
63
Table of Contents
Government-owned and private infrastructure. Public and private infrastructure includes outdoor facilities and spaces that are managed by government and private entities. Primary applications in this market include lighting for streets and highways, parking facilities, airports, ports, railroads, utilities and other large outdoor areas. Street and highway lighting represents the largest segment within the infrastructure market with the number of street and area lights in the United States alone estimated at over 100 million fixtures. Although LED lighting currently represents only a small part of this market, we expect it to grow significantly due to increasing customer awareness of the benefits of LED technology, including longer lifetime, which reduces the need for costly and disruptive replacement and maintenance, and the improving performance and declining cost of LED lighting products. Our customers within this market include American Airlines, Dallas, Salt Lake City, Mexico City and Washington, D.C.
Schools and universities. Campuses for primary, secondary and higher education represent a significant market opportunity for our energy-efficient LED lighting products. Principal applications in this market include lighting for parking lots, large outdoor areas, streets and building exteriors as well indoor lighting. The significant electricity cost savings, low required maintenance and long life of our retrofit lamps and luminaires create a compelling economic equation. A substantial movement currently exists across colleges and universities to reduce energy use and improve sustainability and switching to LED lighting is, we believe, one of the most practical, rapidly adoptable, highest-return and highest profile actions campus administrators can take towards fulfilling this mandate. Our customers within this market include Dallas County Schools, Arizona State University-Tempe and Tufts University.
Retail and hospitality. The market for lighting in the retail and hospitality environment is both large and varied and includes products for malls, retail stores, hotels and resorts, cruise ships and restaurants. Our retrofit lamp and luminaire offerings for this market focus on task lighting, down lighting, bay lighting, cove lighting, accent lighting, track lighting and spot lighting as well as retail display lighting. Several major retailers have replaced their existing lighting with our LED retrofit lamps and luminaires, including Starbucks, Cartier and kiosks within shopping malls managed by Simon Property.
Residential and office. We offer a line of retrofit lamps and luminaires targeted to compete with traditional incandescent and incandescent halogen lamps and luminaires for commercial and residential lighting applications. Our retrofit lamps and luminaires are currently sold to leading OEMs that resell them under their own brands both directly to end users and into retail channels such as home centers. We also sell our retrofit lamps and luminaires to The Home Depot, which offers them to end-users under the EcoSmart brand. In addition, our retrofit lamps and luminaires are sold under the Lighting Science name through distributors and directly to large customers.
Sales channels
We employ a multi-faceted channel strategy, which utilizes co-branded and private label programs, our direct sales force, distributors and independent sales agents to address distinct market opportunities. Our organization of 38 sales professionals is divided into account-focused and project-focused activities, each of which is supported by our rebates team.
64
Table of Contents
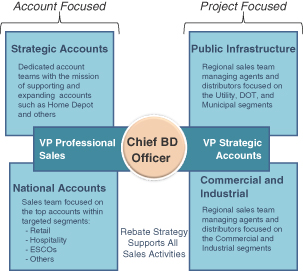
Our account-focused activities are conducted by strategic account and national account teams. Strategic account management focuses on business alliances such as those with The Home Depot and branded lighting OEMs that help us access residential and commercial customers. For example, our products are carried in nearly 2,000 of The Home Depot’s stores located throughout the United States. In addition to initiating new relationships, our strategic account teams also actively manage these accounts by providing quality service, expertise and support in order to expand account revenue. As of April 12, 2011, we had six professionals focused on strategic account management, and we plan to increase this staff during 2011.
National account management focuses on potential high value customers. This team targets the largest national accounts within the markets for which our products’ value proposition is currently the most compelling, including retail, hospitality, schools and universities, large real estate management, and ESCO, or energy service company customers. As of April 12, 2011, we had six professionals focused on national account management, and we plan to increase this team during 2011.
Our project-focused activities involve supporting our network of independent sales agents and distributors that pursue lighting projects in the commercial, industrial and public infrastructure markets on a regional basis. Our project focused sales team develops and manages our network of channel partners and works with these partners to submit competitive bids on projects and oversee the delivery and after-market support related to such projects. As of April 12, 2011, we had five professionals focused on these projects, and we plan to increase this staff during 2011.
Our sales activities are also supported by nine customer advocates who manage customer relationships, coordinate product delivery and also provide after-market services. We also maintain a network of contractors that we qualify for product installation and service within the United States. In addition, our sales and marketing team includes four professionals that are dedicated to managing and monitoring rebate policies with third party constituents.
65
Table of Contents
We believe our products are globally competitive; however, our sales and marketing efforts to date have been primarily focused in North America. We are seeking to expand our international sales team to better service Europe and Asia and intend to pursue a multi-tiered strategy to address these markets as we introduce new products designed specifically for the requirements of these regions. The table below reflects our revenues by geographical region for the years ended December 31, 2010, 2009 and 2008.
| For the Years Ended December 31, | ||||||||||||
| 2010 | 2009 | 2008 | ||||||||||
| Total Revenues by Geographical Region (1) |
||||||||||||
| United States |
$ | 42,223,225 | $ | 18,270,531 | $ | 10,165,476 | ||||||
| The Netherlands |
8,843,899 | 10,428,418 | 2,623,873 | |||||||||
| Other |
2,101,889 | 2,677,867 | 7,969,244 | |||||||||
| $ | 53,169,013 | $ | 31,376,816 | $ | 20,758,593 | |||||||
| (1) | Calculated by reference to the geographical region where sales were made and not the geographical region where the customer was located. |
Our international strategy includes selling through distributors under the Lighting Science name on a geographically exclusive basis, partnering with OEMs, employing a direct sales force in targeted regions and licensing our final assembly to local partners so they can fulfill regional demand in accordance with local content requirements. As of April 12, 2011, we employed seven sales professionals in Europe and two in Australia.
Our sales cycle varies by customer and lighting application and typically ranges between one and three months for commercial customers to as long as a year or more for government infrastructure customers. Sales for large infrastructure and commercial projects usually consist of an initial presentation that may be followed by a pilot period, during which the proposed lighting solution is installed in a limited number of locations to verify its performance prior to purchase. Frequently throughout this process, our in-field technical support team collaborates with our account- and project-focused sales representatives and our product development staff to tailor our products on an iterative basis to the specifications and attributes required by our customers. Sales through our retail and OEM channels are more consistent than our project based sales and are forecasted on a regular basis by our customers. We generally provide a five-year warranty on our products, which gives our customers the option to repair, replace or be reimbursed for the purchase price of the product.
For the year ended December 31, 2010, Osram Sylvania and The Home Depot accounted for 44% and 12% of our net sales, respectively. As a result, our sales are materially affected by fluctuations in the buying patterns of these customers.
66
Table of Contents
Our technology
We have spent nearly a decade developing the technology and know-how that we believe is necessary to design the most reliable and lowest-cost LED lighting products capable of efficiently producing high quality light. This includes a deep understanding of the characteristics of each component and subsystem in a retrofit lamp or luminaire and the impact of their interaction in the context of the needs of individual lighting applications. Several of these key components and subsystems are illustrated below.
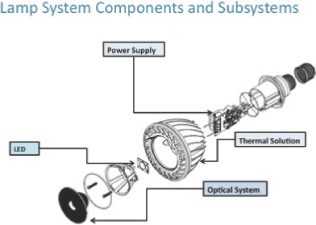
The following areas of expertise are particularly important to our business:
Power supplies and controls. Power supplies and controls convert alternating electrical current from the electrical grid to the direct and modulated current needed to power an LED retrofit lamp or luminaire and control the amount of light output. This permits the retrofit lamp or luminaire to be used with existing electrical infrastructure and enables additional functionality such as dimmability. The electronic nature of these subsystems also enables them to react to external data from environmental sensors as well as networks to which they are connected, to the extent the retrofit lamp or luminaire is part of a larger system. We design, develop and manufacture most of our own power supplies taking into consideration the exact specifications of the packaged LEDs and other components and subsystems being used as well as the intended application of the product into which they are integrated. This enables us to optimize the performance of these other components and subsystems as well as improve characteristics of the power supply itself to enhance energy conversion efficiency and maximize useable power output to the LED as well as to reduce power supply material usage and form factor. Our activities in this regard range from the collaborative design of components used in our power supplies, such as MOSFETs, with our suppliers of these semiconductors to the development of innovative power supply topologies. We also conduct research and development to understand and mitigate the common failure points of power supplies, with the goal of enabling them to last as long as the LEDs in our products. Our expertise in power supplies and controls also allows us to, among other things, integrate new and value added capabilities into our products such as advanced dimming, intelligent controls for added functionality and engineering for extreme environments.
Thermal management solutions. Thermal management solutions help to dissipate heat generated by LEDs and other electronic components in a retrofit lamp or luminaire and range from components such as aluminum heat sinks to more elaborate cooling subsystems. If heat is not dissipated adequately, the performance of the LED can measurably deteriorate, effectively shortening product life and impairing product quality. We utilize proprietary design tools that employ highly accurate predictive modeling for the rapid design and development of efficient heat transfer solutions that are tailored to specific products and applications. In designing these solutions we also focus on their aesthetic impact in the context of the intended product application. Furthermore, we conduct research and development relating to the optimization of thermal management solutions through the use
67
Table of Contents
of advanced materials and methods to reduce their cost, mass and weight, as well as to improve their ease of manufacturing and assembly. This includes the potential use of thermally conductive polymers, self-renewing processes, plasmas and passive and active material combinations.
Optical systems. An optical system determines the intensity, direction, spectrum and spread of the light generated by LEDs and may be a plastic overlay, or optic, placed above an LED or a more elaborate subsystem. We design our own optical systems using advanced material science to achieve maximum efficacy for delivered light to the intended application. We also conduct our own research and development on optimizing optical systems to gain maximum performance from the phosphors being used to prevent color shifting throughout the life of the LED. Phosphors are typically used inside LED packages to alter the color of light emitted by the LED, often to down convert blue light into white light. In addition, we have expertise in introducing new materials and additives, innovative down conversion techniques, nanoprocesses, active optics and microelectromechanical systems, or MEMS, which we believe may be key technologies for improving LED lighting product performance including by removing the phosphor from the packaged LEDs and applying it to the optic itself or by eliminating the phosphor need altogether.
LED Technology. LEDs convert electrons into photons and emit monochromatic light. Our understanding of LED technology is critical for us to specify key attributes of the packaged LEDs we purchase from our suppliers. These specifications consider both the intended application of the product into which the LEDs are incorporated as well as the other components and subsystems with which they are to be integrated, with the aim to create maximum light output, optimal light spectrum, and longer product life. For example, each packaged LED has a unique power input level that maximizes its efficacy, heat gradient that impacts its performance over time and light distribution and spectrum characteristics that must be shaped, altered and tuned by the phosphor and optical systems used.
Research and development
We believe that our ongoing success depends in part on our ability to improve our current products and to develop new products for both existing and new applications. Our research and development team focuses on increasing the efficiency of all of the components and subsystems that comprise our products including power supplies, thermal management solutions and optical systems as well as on designing these components and subsystems for improved aesthetics and reduced total product cost. This goes beyond the optimization of existing technologies and includes the dedication of significant resources toward the development of new materials and methods related to these components and subsystems. We also work closely with LED manufacturers and packagers to promote and drive advances in LED package structures including the application of the phosphors which are required to produce white light.
We have assembled a team of approximately 50 research scientists and engineers with Ph.D.s or Masters degrees in disciplines including power electronics, lighting, thermal and mechanical engineering, materials science and cellular and molecular biology. These professionals combine a thorough understanding of the sciences required to develop LED lighting products with significant lighting application experience. Our research and engineering personnel are co-located in our Satellite Beach, Florida headquarters alongside our manufacturing team, both of which are responsible for new product launches and manufacturing process improvements. Our compressed management hierarchy enables a high level of collaboration between these product development teams as well as our sales and marketing organization.
Our research and development expenses were $10.2 million, $6.6 million and $7.3 million for the years ended December 31, 2010, 2009 and 2008, respectively. For the year ended December 31, 2010, these expenses primarily related to (i) the expansion of our product portfolio including prototype components and tooling and (ii) research into new forms and advances in power conversion, optical materials and thermal substrates and systems.
68
Table of Contents
Our research and development capabilities are enhanced through collaborations with leaders in a wide range of fields, including advanced material science, semiconductor performance, medical and biological research, space exploration and military applications. These technology partners include leading research organizations in the United States, such as NASA, Jefferson Medical College, the University of Florida and OakRidge National Laboratory as well as leading technology-oriented companies such as Bayer AG and National Semiconductor Corporation.
In part due to these partnerships, we are conducting research and development at the frontiers of LED lighting technology, creating the foundation for a range of advanced applications. Key areas of activity include:
Intelligent Controls. Because LED lighting is based on solid-state electronics, adding sensing, adaptation and communication technologies to this platform is economically and technically practical. The additional hardware required for most sensing functionality, such as for motion, temperature, sound, vibration and ambient light levels can be integrated into our products with limited incremental cost. For example, we are developing integrated “smart” fixtures that can anticipate activity based on historical patterns and sense the presence of people in a room. This has applications for both security, activating a light when movement is detected, and lighting efficiency, as lights can be shut off when not needed. We continue to research areas where intuitive, unobtrusive control of light both enhances energy efficiency and provides novel functionality. Further, LED lighting is becoming a platform with networked functionality. Our design and integration of key components, including power supplies, and our deep understanding of the lighting applications we address positions us to lead the development of intelligent controls.
Biology. Light is a critical environmental factor and an important energy input into the metabolism of microbes, plants and animals. The unprecedented control over spectrum and intensity of light conferred by LED lighting therefore provides an untapped opportunity to impact biological processes. For example, LED light may be used to accelerate the growth and development of beneficial organisms, such as plants for food, or to kill undesirable organisms, such as harmful germs and bacteria on surfaces and in water. We are researching potential methods to apply LED light to the biological sciences, for the benefit of sanitation, agricultural productivity and human health and performance.
Manufacturing and supply chain
We manufacture and assemble our LED lighting products utilizing a global supply chain with a significant in-house infrastructure. Today, we have approximately 86,000 square feet of manufacturing facilities, including 20,000 square feet at our headquarters in Satellite Beach, Florida and 66,000 square feet at our new manufacturing facility in Monterrey, Mexico. In addition we have dedicated space at our contract manufacturing partner’s location in Asia.
While we design, develop and manufacture most of our power supplies in house, we use third party suppliers for certain labor or capital intensive components that we design and develop. This cost-effective approach outsources certain manufacturing steps that are not critical to overall product quality and do not require sharing any sensitive intellectual property with third parties. Accordingly, a large portion of our production activity involves final product assembly.
The vast majority of our manufacturing and assembly has traditionally been conducted at our Satellite Beach facility. We are in the process of transferring significant production to our facility in Monterrey, Mexico, which opened in November 2010, as well as to our contract manufacturing partner. Our capacity migration and expansion plans are meant to ensure that we have adequate capacity to meet anticipated future demand for our products as well as to capture efficiencies that we expect will allow us to materially improve our profitability. We will continue to utilize our manufacturing operations in our Satellite Beach, Florida facility to support our product development team’s efforts to launch new products until they reach full scale commercial volumes and to identify process improvements that drive cost reductions across the entire supply chain.
69
Table of Contents
The principal materials used in the manufacture and assembly of our products are packaged LEDs and printed circuit boards, MOSFETs, magnetics and standard electrical components such as capacitors, resistors and diodes used in our power supplies. We also source other materials that are manufactured to our precise specifications, such as aluminum heat sinks for our thermal management systems, plastic optics, as well as aluminum and plastic structural elements. We are not committed to, and do not favor, a single source for packaged LEDs and are therefore free to select LEDs based on availability, price and performance. We favor suppliers on whom we can rely to timely provide us with packaged LEDs to our specifications. We presently use LEDs provided by Citizen Electronics, Nichia Corporation, Osram Opto Semiconductors GmbH, Philips Lumileds Lighting Company, Seoul Semiconductor, Inc. and various other vendors. We believe we have good relationships with our LED suppliers and, in general, receive a high level of cooperation and support from them. In addition, we have entered into strategic relationships with certain key LED suppliers that currently give us access to next generation LED technology at an early stage and at competitive prices. We obtain other materials, components and subsystems from multiple suppliers in North America and Asia. We continuously monitor and evaluate alternative suppliers based on numerous attributes including quality, performance, service and price. We are in the process of expanding our supplier base to increase their proximity to our North American production sites to reduce our reliance on Asian manufacturers. We believe this will help us reduce our lead times as well as our inbound freight costs, including the need for and impact of expediting supplies. In pursuit of these same goals we are also implementing new information technology systems, such as a new ERP system, and working closely with our customers to develop more robust demand forecasts to improve overall supply chain management.
We deliver products to our customers through distributors and directly through strategically located warehouses in the United States and Europe. Our warehouses located in Melbourne, Florida and Dallas, Texas provide us with efficient product distribution for our North American customers. Our warehouses in Breukelen, The Netherlands facilitates delivery of our products to the European markets. We rely on air, sea and ground freight via third party freight services for transporting components and subsystems to our manufacturing sites and final products to most of our customers and distribution facilities. We work with a logistics provider, United Parcel Service, to manage our trade and logistics activities in Asia and Australia. In addition, we have the ability to ship into these markets directly from our contract manufacturer in Asia.
Competition
Our industry is highly competitive. We face competition from both traditional lighting technologies provided by numerous vendors as well as from LED-based lighting products provided by a growing roster of industry participants. The LED lighting industry is characterized by rapid technological change, short product lifecycles and frequent new product introductions, and a competitive pricing environment. These characteristics increase the need for continual innovation and provide entry points for new competitors as well as opportunities for rapid share shifts.
Relative to traditional lighting technologies, we primarily compete on the basis of the numerous benefits of LED lighting technology, such as greater energy efficiency, longer lifetime, improved durability, increased environmental friendliness, digital controllability, smaller size, directionality and lower heat output. As compared to other providers of LED lighting, we compete primarily on the basis of our product performance as measured by lumen output, efficacy, light quality and reliability, as well as on product cost. In addition to the aforementioned factors which generally contribute to total cost of ownership and product quality, we also compete on the basis of our broad product portfolio and strong channel relationships. We believe our differentiated product design approach, proprietary technology and deep understanding of the lighting applications we address enable us to compete favorably on all of these factors.
Currently, we view our primary competition to be large, established companies in the traditional general lighting industry such as Acuity Brands, Cooper Industries, General Electric Company, Osram Sylvania, Panasonic Corporation, Philips and Zumtobel Lighting GmbH. Certain of these companies also provide, or have undertaken initiatives to develop, LED lighting products as well as other energy efficient lighting products.
70
Table of Contents
Additionally, we face competition from a fragmented universe of dedicated smaller niche as well as low-cost offshore providers of LED lighting products. We also anticipate that packaged LED suppliers, including some of those that currently supply us, may seek to compete with us by introducing retrofit lamps or luminaires of their own. For example, Cree, Inc., which is primarily a manufacturer of LEDs, also offers LED retrofit lamps and luminaires. Similarly, affiliates of both Osram Sylvania and Philips are among the larger packaged LED chip providers. We also expect other large technology players with LED technology that are currently focused on other end markets for LEDs, such as backlighting for LCD displays, to increasingly focus on the general illumination market as their existing markets saturate and LED use in general illumination grows. In addition, we may compete in the future with vendors of new technological solutions for energy efficient lighting.
Some of our current and future competitors are larger companies with greater resources to devote to research and development, manufacturing and marketing, as well as greater brand name recognition and channel access. Some of our more diversified customers could also compete more aggressively with us by subsidizing losses in their LED lighting businesses with profits from other lines of business. Moreover, if one or more of our competitors or suppliers were to merge with one another, the change in the competitive landscape could adversely affect our customer, channel or supplier relationships, and, as a result, our competitive position. Additionally, any loss of a key channel partner, whether to a competitor or otherwise, could severely and rapidly damage our competitive position.
Intellectual property
The creation and use of proprietary intellectual property is a key aspect of our strategy to differentiate ourselves in the marketplace. We seek to protect our proprietary technologies by obtaining patents and licenses, retaining trade secrets and defending, enforcing and utilizing our intellectual property rights, where appropriate. We believe this strategy allows us to preserve the advantages of our products and technologies, and helps us to improve the return on our investment in research and development.
As of February 7, 2011, we had filed 143 U.S. patent applications, of which 89 U.S. patents were issued and 35 were pending approval and 19 were no longer active. When we believe it is appropriate and cost effective, we make corresponding international, regional or national filings to pursue patent protection in other parts of the world. In some cases, we rely on confidentiality agreements and trade secret protections to protect our proprietary technology. In addition, we license and have cross-licensing arrangements with respect to third-party technologies that are incorporated into some elements of our design activities, products and manufacturing processes. Notably, we acquired license rights to a portfolio of patents and patent applications, as well as certain registered trademarks and service marks for discrete product offerings, from Philips in connection with a settlement that we reached with Philips and certain of its affiliates, including Color Kinetics, in August 2009. Historically, licenses of the third-party technologies used by us have been available to us on acceptable terms.
The LED industry is characterized by the existence of a significant number of patents and other intellectual property, and by the vigorous pursuit, protection and enforcement of intellectual property rights. As is customary in the industry, many of our customer agreements require us to indemnify our customers for third-party intellectual property infringement claims. Claims of this sort could harm our relationships with our customers and might deter future customers from doing business with us. With respect to any intellectual property rights claims against us or our customers or distributors, we may be required to cease manufacture of the infringing product, pay damages, expend resources to defend against the claim and/or develop non-infringing technology, seek a license or relinquish patents or other intellectual property rights. We believe our extensive intellectual property portfolio, along with our license arrangements, provide us with considerable advantage relative to new entrants to the industry and smaller LED providers in serving sophisticated customers.
Regulations, standards and conventions
Our products are generally required to meet the electrical codes of the jurisdictions in which they are sold. Meeting the typically more stringent codes established in the United States and the European Union usually allows our products to meet the codes in other geographic regions.
71
Table of Contents
Many of our customers require our products to be listed by UL. UL is a United States independent, nationally recognized testing laboratory, third-party product safety testing and certification organization. UL develops standards and test procedures for materials, products, components, assemblies, tools and equipment, chiefly dealing with product safety. UL evaluates products, components, materials and systems for compliance to specific requirements, and permits acceptable products to carry a UL certification mark, as long as they remain compliant with the standards. UL offers several categories of certification. Products that are “UL Listed,” are identified by the distinctive UL mark. We have undertaken to have all of our products meet UL standards and be UL listed. There are alternatives to UL certifications but we believe that customers and end-users tend to favor UL listing. Because LED lighting products are relatively new in the market, UL’s specifications and standards for LED lighting products such as ours are not well established and the prior established specifications and standards for traditional lighting products are sometimes difficult to achieve for LED lighting devices.
Certain of our products must meet industry standards, such as those set by the Illuminating Engineering Society of North America, or IES, and government regulations for their intended application. For example, street lights must meet certain structural standards and must also deliver a certain amount of light in certain positions relative to the installed luminaire. In the United States, our WallPack luminaires must meet standards and regulations established in the Americans with Disabilities Act. We specifically develop and engineer our products to meet the standards and regulations applicable to the lighting applications they address.
Many of our customers and end-users also expect our products to meet the applicable ENERGY STAR requirements. ENERGY STAR is an international standard for energy efficient consumer products. To qualify for ENERGY STAR certification, LED lighting products must pass a variety of tests to prove that the products have certain characteristics.
Legal Proceedings
We are from time to time subject to claims and litigation arising in the ordinary course of business. These claims may include assertions that our products infringe existing patents and claims that the use of our products has caused personal injuries. We intend to defend vigorously any such litigation that may arise under all defenses that would be available to us. At this time, there are no proceedings of which management is aware that is expected to have a material adverse effect on our financial position or results of operations.
Employees
As of December 31, 2010, we had 152 employees in the United States and 91 employees outside the United States, primarily in Mexico and The Netherlands. We also utilized 357 contractors as of December 31, 2010, all of which were in the United States. We are not currently subject to any collective bargaining agreements, and we believe that our relationship with our employees is good.
72
Table of Contents
Below is a list of the names and ages as of April 12, 2011 of our directors and executive officers and a brief account of the experience of each of them.
| Name |
Age | Position | ||||
| Richard Weinberg |
51 | Interim Chief Executive Officer and Chairman of the Board of Directors | ||||
| John Stanley |
43 | Chief Operating Officer | ||||
| Gregory Kaiser |
39 | Chief Financial Officer | ||||
| Frederic Maxik |
50 | Chief Technology Officer | ||||
| David Henderson |
39 | Chief Development Officer | ||||
| Edward “Ted” Russ |
42 | Chief Business Development Officer | ||||
| Charles Darnell |
73 | Vice Chairman of the Board of Directors | ||||
| Donald Harkleroad |
67 | Vice Chairman of the Board of Directors | ||||
| Robert Bachman |
69 | Director | ||||
| David Bell |
67 | Director | ||||
| Michael Kempner |
53 | Director | ||||
| T. Michael Moseley |
61 | Director | ||||
| Leon Wagner |
57 | Director | ||||
Executive officers
Richard Weinberg was appointed to serve as Interim Chief Executive Officer and Chairman of our board of directors in January 2011 and has served as a director since October 2007. Mr. Weinberg joined Pegasus Capital as an operating partner in 2005 and became Co-Managing Director in 2010. Pegasus Capital is an affiliate of our largest stockholders that collectively beneficially owned 88.7% of our common stock as of April 12, 2011. Mr. Weinberg has over 27 years of business development and complex financial and legal restructuring experience. From 2000 to 2005, Mr. Weinberg served as CEO of G-I Holdings (f/k/a GAF Corporation), leading that entity’s bankruptcy restructuring efforts, and from 1993 to 2005, he served as General Counsel and a senior executive of GAF Materials Corporation and International Specialty Chemicals, Inc., building products and specialty chemicals companies, respectively.
We believe Mr. Weinberg is qualified to serve on our board of directors because he brings a significant amount of business experience to the board through previously serving as an executive officer and director of other companies. In addition, Mr. Weinberg has extensive business development and complex financial and legal restructuring experience.
John Stanley has served as our Chief Operating Officer since June 1, 2010. Mr. Stanley previously served as Senior Vice President of Global Supply Chain from April 2010 to June 2010. He has more than 10 years of production and logistics experience managing manufacturing operations in various industries including automotive, electronics, furniture and metals. Mr. Stanley received his bachelor’s degree in engineering from Clarkson University and his M.B.A. from the University of Michigan. From 2009 to 2010, Mr. Stanley served as Vice President of Operations for Shapes, LLC, one of North America’s largest aluminum extrusion operations. From 2008 to 2009, he was Senior Vice President of Operations for Rowe Fine Furniture, Inc., a Virginia-based custom furniture company. Prior to that, from 2006 to 2007, Mr. Stanley served as Vice President of Operations and Supply Chain for Acuity Brands, an electronics and lighting manufacturing company. From 1989 to 2006, Mr. Stanley held numerous plant and site manager positions with Delphi, a leading global supplier of automotive components.
Gregory Kaiser has served as our Chief Financial Officer since July 28, 2010. Prior to joining us, Mr. Kaiser held senior accounting positions with both publicly-traded and privately-held companies. Since 2009,
73
Table of Contents
Mr. Kaiser served as Co-founder and Chief Financial Officer for Mycontent.com, LLC, a start-up social networking website. Prior to joining Mycontent.com, from 2003 until 2009, Mr. Kaiser held numerous positions, including Vice President and Chief Financial Officer of an internal division, with HD Supply, Inc., a wholesale distributor serving professional customers in the infrastructure and energy, maintenance and improvement and specialty construction markets. Prior to joining HD Supply, Inc., Mr. Kaiser served as Assistant Corporate Controller for Hughes Supply, Inc., a former public company listed on the New York Stock Exchange. From 2001 until 2003, Mr. Kaiser served as Division Controller for Equitable Resources, Inc., a public company traded on the New York Stock Exchange. From 1996 – 2001, Mr. Kaiser served with the Internal Audit division of Pitt-Des Moines, Inc., and from 1994 – 1996, Mr. Kaiser served as an accountant for Deloitte & Touche LLP. Mr. Kaiser is a Certified Public Accountant and received a bachelor’s degree from West Virginia University in Business Administration/Accounting.
Fredric Maxik has served as our Chief Technology Officer since January 2010 and from June 2004 to October 2007. Prior to serving in this capacity, Mr. Maxik served as our Chief Scientific Officer from October 2007 to January 2010. He also served as a director from August 2004 to October 2007. After graduating from Bard College with a bachelor’s degree in physics and philosophy, Mr. Maxik began his career with Sansui Electric Co., Ltd., in 1983 in Tokyo, Japan where he became vice president of product development. In 1990, he was recruited to the position of vice president of product development for Onkyo Corporation in Osaka, Japan. In 1993, Mr. Maxik formed a product development consulting firm. In 2002, he formed an environmental products company, which developed the intellectual property that eventually became the principal asset of Lighting Science, Inc. that was acquired by us in June 2004. Mr. Maxik has 38 U.S. patents in the field of solid state lighting. Mr. Maxik is an operating advisor for Pegasus Capital, an affiliate of our largest stockholders that collectively beneficially owned 88.7% of our common stock as of April 12, 2011.
David Henderson has served as our Chief Development Officer since November 2010. From October 2009 to October 2010, Mr. Henderson was our Senior Vice President of Product Development and, from March 2008 to September 2009, served as our Director of Product Development. Prior to joining us, from 2001 to 2008, Mr. Henderson was the Director of Product Management and Engineering for Acuity Brands Lighting, Holophane Division, where he was responsible for the development, engineering and commercialization of new products. From 1997 to 2001, he was Engineering Manager at Thomas & Betts Corporation. Mr. Henderson holds a Bachelor of Science degree in Technology, from Western Kentucky University.
Edward “Ted” Russ has served as our Chief Business Development Officer since November 2010. From January 2010 to November 2010, he was Senior Vice President and General Manager of our Illumination Business. Prior to joining us, Mr. Russ served as a senior executive for several technology organizations in a variety of industries including lighting, automotive and remote asset management. From December 2008 to December 2009, Mr. Russ was the Chief Operations Officer for StreetSmart Technology, a parking management technology company. Prior to that, he was Vice President and General Manager for Acuity Brands’ ROAM business, a remote asset management services company focused on street and area lighting. Mr. Russ received an MBA from Emory University, where he concentrated in Strategic Management. He also served as an officer and pilot in the U.S. Army and is a graduate of the United States Military Academy at West Point.
Directors
Charles Darnell was appointed to our board of directors in October 2010 and was appointed to serve as Vice Chairman of the board of directors on December 21, 2010. For 43 years, from March 1963 until retirement in August 2005, Mr. Darnell was with Lithonia Lighting, later named Acuity Brands, where he started as CIO before later becoming Vice Chairman. Since retiring from Acuity Brands, Mr. Darnell has consulted with several companies specializing in technology such as lighting, wireless networks and electronic medical and metering equipment. He and his family also own several small companies engaged in servicing the interior designer market, including International Arts Group, Lighting Effects, Wingz Marketing, Trimarc Installation, LLC and iDesign.
We believe Mr. Darnell is qualified to serve on our board of directors because he has considerable experience relating to lighting industry operations and thus, provides a critical business perspective to our board of directors.
74
Table of Contents
Donald Harkleroad has served as a director for us since 2003 and was appointed to serve as Vice Chairman of the board of directors on December 21, 2010. He is President of The Bristol Company, an Atlanta-based private holding company with interests in the food service, technology services, real estate and merchant banking industries. From 2003 until 2001, Mr. Harkleroad served as a director for Easylink Services International Corp., a global provider of on-demand electronic messaging and transaction services. Until its sale in 2006, he was also a founding director of Summit Bank Corporation, a commercial bank with offices in Georgia, Texas and California.
We believe Mr. Harkleroad is qualified to serve on our board of directors because he brings significant operating, finance, legal and business knowledge through having participated in various management roles at a number of public and private companies and having practiced corporate and securities law for over 30 years. In addition, Mr. Harkleroad brings an ability to identify and implement strategic growth opportunities that help to provide guidance as the company identifies new ways to compete.
Robert Bachman has served as a director for us since 2003. He is the majority partner in USGT Investors, L.P., or USGT, an investment company based in Dallas, Texas. USGT primarily takes a minority investment position in companies that are controlled by large institutional investors. Mr. Bachman actively manages USGT’s investment portfolio, which currently includes Lighting Science Group, in addition to a shale oil exploration and production company with a large acreage position in Montana, a fusion energy company based in California and a Swiss company with interests in European steel companies. Previously, Mr. Bachman served as Vice President – Finance with a German-owned company that invested in commercial real estate in North America, and subsequently was Executive Vice President and General Manager of an oil and gas investment company affiliate of the German-owned company. He began his business career with Anheuser Busch in St. Louis, Missouri and has an M.B.A. from Columbia University. Mr. Bachman was also an officer in the U.S. Navy.
We believe Mr. Bachman is qualified to serve on our board of directors because he brings a broad base of financial and investment knowledge from a variety of industries to our board of directors.
David Bell was appointed a member of our board of directors in October 2007. Since March 16, 2006, he has served as Chairman Emeritus of The Interpublic Group of Companies, or Interpublic, a provider of advertising, specialized marketing and communication services. Previously, he served as Interpublic’s Co-Chairman from January 2005 until March 15, 2006, Chairman and Chief Executive Officer from February 2003 to January 2005 and Vice Chairman from June 2001 to February 2003. From March 1999 to 2001, Mr. Bell served as Chairman and Chief Executive Officer of True North Communications, Inc., a provider of advertising and marketing services. From 1992 to March 1999, he served as Chairman and Chief Executive Officer of Bozell Worldwide. Mr. Bell serves on the Board of Directors of Warnaco Group Inc. and Primedia, Inc. and is currently Chairman of PRO-AD PAC (the advertising industry’s political action committee) and is the former Chairman of the Board of Directors of The National Forest Foundation and Co-Chairman of the Advertising Council Advisory Group. Mr. Bell is also a member of the Advertising Hall of Fame and is an operating advisor of Pegasus Capital. Pegasus Capital is an affiliate of our largest stockholders that collectively beneficially owned 88.7% of our common stock as of April 12, 2011.
We believe Mr. Bell is qualified to serve on our board of directors because he is a recognized marketing expert and brings significant financial and business knowledge and executive leadership experience to the board of directors from his service as an executive officer and director of Interpublic and other publicly traded companies.
Michael Kempner was appointed a member of our board of directors in March 2010. He is the founder, president and chief executive officer of MWW Group, Inc. Mr. Kempner is an authority on investor relations, public affairs, business-to-business, and consumer marketing and corporate social responsibility, and Mr. Kempner has successfully guided corporate communications programs for numerous companies. Mr. Kempner is also an operating advisor of Pegasus Capital, which is an affiliate of our largest stockholders that collectively beneficially owned 88.7% of our common stock as of April 12, 2011.
75
Table of Contents
We believe Mr. Kempner is qualified to serve on our board of directors because he brings significant financial and business knowledge and executive leadership experience to the board through serving as an executive officer and director of MWW Group. In addition, Mr. Kempner has valuable marketing, public affairs and corporate communications experience.
T. Michael Moseley was appointed a member of our board of directors in March 2010. He is a retired United States Air Force four-star general. Mr. Moseley is a fighter pilot with more than 2,800 flight hours, many in the F-15 Eagle. Mr. Moseley’s final Air Force assignment was Chief of Staff of the Air Force. He retired from the Air Force in August 2008. Mr. Moseley is an operating advisor for Pegasus Capital, an affiliate of our largest stockholders that collectively beneficially owned 88.7% of our common stock as of April 12, 2011.
We believe Mr. Moseley is qualified to serve on our board of directors because he brings perspective to the board as a private investor as well as a significant amount of leadership experience through previously serving as Chief of Staff of the Air Force.
Leon Wagner was appointed to serve on our board of directors on January 3, 2011. Mr. Wagner was a founding partner and chairman of GoldenTree Asset Management, an alternative asset management firm specializing in leveraged loans, high yield bonds, distressed assets and equities in hedge, long only and structured funds. At the time of his retirement, GoldenTree managed in excess of $12 billion in capital. Prior to founding GoldenTree, Mr. Wagner was the co-head of the high yield sales and trading department at CIBC World Markets. He joined CIBC in 1995 when it acquired The Argosy Group, LP. Mr. Wagner directed public and private placement marketing and structuring for high yield issuance at both institutions. Mr. Wagner is also a distinguished philanthropist and the 2003 recipient of the Gustave L. Levy Award, presented by the UJA-Federation of New York, in recognition of service to the community. Mr. Wagner received his M.B.A. from the University of Chicago Graduate School of Business and a B.A. from Lafayette College.
We believe Mr. Wagner is qualified to serve on our board of directors because he brings significant financial experience and knowledge to the board.
Family relationships
There are no family relationships between any of our executive officers or directors.
Board composition
Our certificate of incorporation and bylaws provide that our board of directors will consist of such number of directors as determined from time to time by resolution adopted by a majority of the total number of authorized directors whether or not any vacancies exist in previously authorized directorships. Our board of directors currently consists of eight seats. Subject to any rights applicable to any then outstanding preferred stock, any additional directorships resulting from an increase in the number of directors may only be filled by the directors then in office unless otherwise required by law or by a resolution passed by the board of directors. The term of office for each director will be until his or her successor is elected at our annual meeting or his or her death, resignation or removal, whichever is earliest to occur. Stockholders will elect directors each year at our annual meeting.
We have no formal policy regarding board diversity. Our board of directors believes that each director should have a basic understanding of the principal operational and financial objectives and plans and strategies of the company, the results of operations and financial condition of the company and the relative standing of the company in relation to our competitors. We take into consideration the overall composition and diversity of the board of directors and areas of expertise that director nominees may be able to offer, including business experience, knowledge, abilities and customer relationships. Generally, we will strive to assemble a board of directors that brings to us a variety of perspectives and skills derived from business and professional experience as we may deem are in our and our stockholders’ best interests. In doing so, we will also consider candidates with appropriate non-business backgrounds.
76
Table of Contents
Director independence
Under The NASDAQ Marketplace Rules, a director will only qualify as an “independent director” if, in the opinion of our board of directors, that person does not have a relationship that would interfere with the exercise of independent judgment in carrying out the responsibilities of a director. Our board of directors has affirmatively determined that Messrs. Bachman, Darnell and Harkleroad are “independent directors,” as defined under Rule 5605(a)(2) of The NASDAQ Marketplace Rules.
Because LSGC Holdings holds more than 50% of the voting power for the election of our directors, we may elect to be a “controlled company” under The NASDAQ Marketplace Rules. As a controlled company, exemptions under The NASDAQ Marketplace Rules will free us from the obligation to comply with certain corporate governance requirements, including the requirements:
| • | that a majority of our board of directors consists of “independent directors,” as defined under The NASDAQ Marketplace Rules; and |
| • | that any compensation committee or nominating and corporate governance committee be composed entirely of independent directors with a written charter addressing the committee’s purpose and responsibilities. |
These exemptions do not modify the independence requirements for our Audit Committee, and we intend to comply with the requirements of Rule 10A-3 of the Exchange Act and The NASDAQ Marketplace Rules within the applicable time frame.
Board committees
Our board of directors has established an audit committee, a compensation committee, a governance committee, an executive committee, a finance committee and a committee of independent directors. With the exception of the committee of independent directors, each of these committees operates under a charter that has been approved by our board of directors.
Audit committee
The audit committee is responsible for, among other matters: (1) appointing, compensating, retaining, evaluating, terminating and overseeing our independent registered public accounting firm; (2) discussing with our independent registered public accounting firm their independence from management; (3) reviewing with our independent registered public accounting firm the scope and results of their audit; (4) approving all audit and permissible non-audit services to be performed by our independent registered public accounting firm; (5) overseeing the financial reporting process and discussing with management and our independent registered public accounting firm the interim and annual financial statements that we file with the SEC; (6) reviewing and monitoring our accounting principles, accounting policies, financial and accounting controls and compliance with legal and regulatory requirements; (7) establishing procedures for the confidential anonymous submission of concerns regarding questionable accounting, internal controls or auditing matters; and (8) reviewing and monitoring the guidelines and policies governing risk assessment and risk management.
Our audit committee consists of Messrs. Bachman, Darnell and Harkleroad, and Mr. Bachman is the chairman of the audit committee. Our board of directors has determined that each of the members of our audit committee is independent within the meaning of The NASDAQ Marketplace Rules and Rule 10A-3 under the Exchange Act. Our board of directors does not have an “audit committee financial expert,” within the meaning of that phrase under applicable regulations of the SEC, serving on the audit committee. The board of directors believes that each member is financially literate and experienced in business matters and is capable of (1) understanding generally accepted accounting principles, or GAAP, and financial statements; (2) assessing the general application of GAAP principles in connection with our accounting for estimates, accruals and reserves; (3) analyzing and evaluating our financial statements; (4) understanding our internal controls and procedures for financial reporting; and (5) understanding audit committee functions. All of these are attributes of an audit
77
Table of Contents
committee financial expert. However, the board of directors believes that no audit committee member has obtained these attributes through the experience specified in the SEC’s definition of “audit committee financial expert.” Further, as is the case with many emerging companies, it is difficult for us to attract and retain board members who qualify as “audit committee financial experts,” and competition for such individuals is typically significant. The board of directors believes that its current audit committee is able to fulfill its role under SEC regulations despite not having a designated “audit committee financial expert.”
Compensation committee
Our compensation committee is responsible for, among other matters: (1) recommending to our board of directors for consideration, the compensation and benefits of our executive officers and key employees; (2) monitoring and reviewing our compensation and benefit plans to ensure that they meet corporate objectives; (3) administering our stock and other incentive compensation plans and programs and preparing recommendations and periodic reports to the board of directors concerning these matters; (4) preparing, if necessary, the compensation committee report that may be required by SEC rules to be included in our annual report; and (5) preparing recommendations and periodic reports to the board of directors concerning these matters.
Our compensation committee consists of Messrs. Bell, Harkleroad, Moseley and Weinberg, and Mr. Bell is the chairman of the compensation committee.
Governance committee
Our governance committee has responsibility for, among other things: (1) recommending persons to be selected by our board of directors as nominees for election as directors and to fill any vacancies on the board; (2) recommending persons to be selected by our board of directors as members and chairperson for each board committee; (3) analyzing and proposing for decision of the board of directors the governance structure of the company; (4) reviewing and making recommendations to the board of directors regarding compensation paid to the directors; and (5) monitoring our performance in meeting our obligations of fairness in internal and external matters and our principles of corporate governance.
Our governance committee consists of Messrs. Bachman, Harkleroad and Weinberg, and Mr. Harkleroad is the chairman of the governance committee.
Executive committee
Our executive committee reviews and, where appropriate, approves corporate action with respect to the conduct of our business between board of directors’ meetings. The executive committee has the authority of the full board of directors, except for specific powers that are required by law to be exercised by the full board of directors. Actions taken by the executive committee are reported to the board of directors at its next meeting. Our executive committee consists of Messrs. Darnell, Harkleroad, Kempner and Weinberg, and Mr. Weinberg is the chairman of the executive committee.
Finance committee
The finance committee is responsible for the oversight of, among other matters, our: (1) capital structure plans and strategies and specific debt and equity financings, (2) short-term and long-term financing plans, (3) major commercial banking, investment banking, financial consulting, insurance and other financial relationships, (4) cash management plans, strategies and activities and (5) plans and strategies for managing exposure to economic risks.
Our finance committee consists of Messrs. Harkleroad, Wagner and Weinberg, and Mr. Wagner is the chairman of the finance committee.
78
Table of Contents
Committee of independent directors
Our committee of independent directors was formed by resolution of the board of directors to: (1) consider, negotiate and approve or reject related-party transactions, without further board approval, between the company and (a) Pegasus Capital and its affiliates; (b) executive officers or directors of the company; or (c) any other person or entity that may be deemed an affiliate or related party; and (2) approve awards under the company’s Amended and Restated Equity-Based Compensation Plan (in addition to the authority of the compensation committee).
The committee of independent directors consists of Messrs. Bachman, Darnell and Harkleroad and does not have a chairman.
Compensation committee interlocks and insider participation
During 2010, the members of our compensation committee were Messrs. Bell, Harkleroad and Weinberg and a former director, Carlos Gutierrez. Mr. Weinberg is an executive officer and partner of Pegasus Capital. In addition, Messrs. Bell and Gutierrez are Operating Advisors for Pegasus Capital. As described in further detail under “Certain relationships and related transactions,” during the years ended December 31, 2008, 2009 and 2010, we paid or otherwise accrued approximately $4.9 million in fees and expenses to Pegasus Capital and its affiliates as consideration for: (i) Pegasus IV’s guaranty of our previous line of credit with the Bank of Montreal; (ii) Pegasus Capital’s provision of due diligence and negotiation services in conjunction with our acquisitions of LSGBV and Lamina; and (iii) its provision of financial, strategic planning, monitoring and related services pursuant to a Support Services Agreement.
Board leadership structure and role in risk oversight
Mr. Weinberg, our Chairman and Interim Chief Executive Officer, has been with us since October 2007. The board of directors believes that Mr. Weinberg is best situated to serve as our Chairman and Interim Chief Executive Officer because he is the director most familiar with the company’s business and industry and is most capable of efficiently and effectively identifying strategic priorities and leading the discussion and execution of strategy. Independent directors and management have different perspectives and roles in strategy development. Our independent directors bring experience, oversight and expertise from outside the company and industry, while our Chief Executive Officer brings company-specific and industry experience and expertise. The board of directors believes that the combined role of Chairman and Chief Executive Officer promotes strategy development and execution and facilitates information flow between management and the board of directors, each of which is essential to effective governance.
Our board of directors is comprised of three independent members. The board of directors believes the combined role of Chairman and Chief Executive Officer, together with the oversight of our independent directors, is in the best interest of stockholders because it provides the appropriate balance between strategy development and independent oversight of management.
Our audit committee is primarily responsible for overseeing the company’s risk management processes on behalf of the full board of directors. The audit committee receives reports from management concerning the company’s assessment of risks. In addition, the audit committee reports regularly to the full board of directors, which also considers the company’s risk profile. The audit committee and the full board of directors focus on the most significant risks facing the company and the company’s general risk management strategy. In addition, as part of its oversight of our company’s executive compensation program, the compensation committee considers the impact of such program, and the incentives created by the compensation awards that it administers, on our company’s risk profile. In addition, the compensation committee reviews all of our company’s compensation policies and procedures, including the incentives that they create and factors that may reduce the likelihood of excessive risk taking, to determine whether they present a significant risk to our company. The compensation committee has determined that, for all employees, our company’s compensation programs do not encourage excessive risk and instead encourage behaviors that support sustainable value creation.
79
Table of Contents
Compensation discussion and analysis
This Compensation Discussion and Analysis describes the compensation arrangements we have with our named executive officers as set forth under the rules of the SEC. Consistent with the SEC rules, we are providing disclosure for the principal executive officer (our Chief Executive Officer or CEO) and principal financial officer (our Chief Financial Officer or CFO), regardless of compensation level, and the three most highly compensated executive officers in our last completed fiscal year, other than the CEO and CFO. All of these executive officers are referred to in this Compensation Discussion and Analysis as our “NEOs.”
For fiscal 2010, our NEOs were:
|
Name |
Title | |
| Zachary Gibler (1) |
Former Chairman and Chief Executive Officer | |
| Gregory Kaiser |
Chief Financial Officer | |
| Frederic Maxik |
Chief Technology Officer | |
| John Stanley |
Chief Operating Officer | |
| Khaled Haram (2) |
Former President and Chief Operating Officer | |
| Jonathan Cohen (3) |
Former Chief Accounting Officer (Principal Financial Officer) | |
| Kathryn Reynolds (4) |
Former Senior Vice President, Strategy and Finance (Principal Financial Officer) |
| (1) | Mr. Gibler passed away on January 2, 2011. |
| (2) | Mr. Haram would have been a NEO for fiscal year 2010 but for the fact that his employment terminated on June 30, 2010. |
| (3) | Mr. Cohen served as Principal Financial Officer prior to September 10, 2010 when his employment was terminated. |
| (4) | Ms. Reynolds served as Principal Financial Officer prior to January 29, 2010 when her employment was terminated. |
Recent Events
Zachary Gibler passed away on January 2, 2011 and Richard Weinberg assumed the duties of Chairman of the Board and interim Chief Executive Officer. Mr. Weinberg has agreed to serve in this capacity for no additional compensation.
Overview and responsibility for compensation decisions
The compensation committee of our board of directors has responsibility for evaluating the performance and development of our executive officers in their respective positions, reviewing individual compensation as well as corporate compensation principles and programs, establishing corporate and individual performance objectives as they affect compensation, making determinations as to whether and to what extent such performance objectives have been achieved and ensuring that we have effective and appropriate compensation programs in place. Our CEO supports our compensation committee by driving our annual business plan process, providing information related to the ongoing progress under our annual business plan and other business and financial results, undertaking performance assessments of other executives and presenting other personnel-related data for the committee’s consideration. In addition, as the manager of our executive team, our CEO assesses each executive’s contribution to corporate goals as well as achievement of his or her individual goals and makes a recommendation to our compensation committee with respect to compensation for executive officers other than himself. Our compensation committee meets, including in executive sessions, to consider these recommendations, conducts a similar evaluation of the CEO’s contributions to corporate goals and achievement of individual goals and makes determinations related to the CEO’s and the other executive officers’ compensation.
Our overall compensation philosophy is to provide a competitive total compensation package that will:
| • | fairly compensate our executive officers; |
80
Table of Contents
| • | attract and retain qualified executive officers who are able to contribute to the long-term success of our company; |
| • | incentivize future performance toward clearly defined corporate goals without encouraging excessive risk taking; and |
| • | align our executives’ long-term interests with those of our stockholders. |
Our compensation committee believes that the quality, skills and dedication of our executive officers are critical factors affecting our long-term value. Our compensation arrangements with executive officers are, to a large degree, based upon the consolidated revenue and earnings achievements of our company along with personal performance objectives agreed upon at the beginning of the fiscal year with the respective executive. We believe in compensating progressively for the achievement of established objectives.
In setting compensation levels for individual officers, our compensation committee applies its judgment in determining the amount and mix of compensation elements for each named executive officer, and to date our compensation process has been a largely discretionary process based upon the collective experience and judgment of the compensation committee members acting as a group. Factors affecting the committee’s decisions in setting compensation generally include:
| • | overall corporate performance; |
| • | the individual officer’s performance against corporate-level strategic goals established as part of our annual business plan and the officer’s effectiveness in managing toward achievement of those goals; |
| • | the nature and scope of the officer’s responsibilities; and |
| • | informal market surveys and the personal experience of members of our board of directors. |
While our compensation committee is authorized to engage the services of outside consultants and advisors, neither the compensation committee nor our management has to date retained a compensation consultant to review or provide advice with respect to our policies and procedures with respect to executive compensation. To date, we have not formally benchmarked our executive compensation against peer companies, and we have not identified a group of peer companies against which we would compare our compensation practices. While our compensation committee considers the overall mix of compensation components in its review of compensation matters, it has not adopted formal or informal policies or guidelines for allocating compensation between long-term and current compensation or between cash and non-cash compensation. The compensation committee intends to continue to manage our executive officer compensation programs on a flexible basis that will allow it to respond to market and business developments as it views appropriate, but will continue to consider whether the use of consultants, formal benchmarking and/or fixed guidelines for allocating between compensation components would aid the committee in setting compensation levels or allocating between types of compensation.
We have historically reviewed company compensation annually as part of the business plan process undertaken by management and the board of directors in the early part of each year. During this process, the compensation committee reviews overall compensation, evaluates performance, determines corporate-level performance goals for that year’s business plan and, when appropriate, makes changes to one or more components of our executives’ compensation. We expect to continue this practice after this offering.
Historically, the exercise price of our stock options has been at least equal to the fair market value of our common stock on the date of grant. Prior to this offering, the fair market value of our common stock has been established by reference to the closing price of our common stock on the OTC Bulletin Board or the Pink Sheets, as applicable, on the date of grant. If our common stock becomes listed on the NASDAQ stock market, the fair market value of our common stock will be the closing price of our stock on that exchange on the date of the grant.
81
Table of Contents
Compensation components
Compensation for our executive officers has been highly individualized, at times structured as a result of arm’s length negotiations when an officer is initially hired, and always taking into account our financial condition and available resources. The resulting mix of compensation components has primarily included:
| Compensation Component |
Description |
Relation to Compensation Objectives | ||
| Base Salary |
Fixed cash compensation for services rendered during the fiscal year | • Fairly compensate executives
• Attract and retain qualified executives | ||
| Annual Cash Incentive Bonus |
Annual cash payments for achieving predetermined financial and/or performance goals | • Fairly compensate executives
• Attract and retain qualified executives
• Incentivize future performance toward clearly defined corporate goals without encouraging excessive risk taking | ||
| Long-Term Incentive Awards |
Grants of stock options and/or restricted stock awards designed to focus on long-term growth and increased company value | • Attract and retain qualified executives
• Align executive and stockholder interests
• Incentivize future performance toward clearly defined corporate goals without encouraging excessive risk taking | ||
| Severance and Change of Control Benefits |
Continued payments of base salary for up to 24 months after involuntary termination | • Fairly compensate executives
• Attract and retain qualified executives | ||
| Other Benefits |
Health and medical benefits, and the opportunity to participate in an employee stock purchase plan and a 401(k) retirement plan or comparable foreign plan | • Align executive and stockholder interests
• Attract and retain qualified executives | ||
Our compensation committee believes this mix is appropriate for our executive team because, among other things, it provides a fixed component (base salary) designed to offer the executive funds from which to manage personal and immediate cash flow needs and variable components (annual incentive bonuses, stock options and restricted stock awards) that incentivize our management team to work toward achievement of corporate goals and our long-term success, as well as offering protection (through termination-related benefits) against abrupt changes in the executive’s circumstances in the event of involuntary employment termination including in the context of a change of control of our company. Our compensation committee also believes, based on the collective experience of its members, that this mix is typical of companies in our industry and at our stage of development. It has no current plans to change the mix of components or vary the relative portions of fixed and variable compensation that comprise our overall compensation packages.
As a result of this mix of compensation components, executives earn their compensation over three time frames:
| • | Current Year Performance: Salary and annual incentives that reflect actions and results over 12 months; |
| • | Long-Term Performance: A long-term incentive plan that reflects results over a period of years, helping to ensure that current results remain sustainable; and |
82
Table of Contents
| • | Full Career Performance: Deferrals and retirement accumulations encourage executives to stay with the company until their working careers end. |
In May 2010, as part of the annual compensation review the compensation committee reviewed the compensation of our NEOs and determined that in light of our continued growth in both revenues and product development, it was in our company’s best interest to make certain changes to the compensation packages of our NEOs as set forth below.
Base Salaries. Base salary for our CEO and other executive officers is established based on the scope of their responsibilities, length of service with our company, individual performance during the prior year and competitive market compensation. Base salaries are reviewed annually and adjusted from time-to-time based on competitive conditions, individual performance, our overall financial results, changes in job duties and responsibilities and our company’s overall budget for base salary increases. The budget is designed to allow salary increases to retain and motivate successful performers while maintaining affordability within our company’s business plan.
In May 2010, as part of the annual compensation review, our CEO’s base salary was increased from $275,000 to $375,000 in consideration of our projected growth after the development of significant customer relationships during 2009 and the first half of 2010, and his appointment as Chairman of the board of directors. In addition, our Chief Technology Officer’s base salary was increased from $250,000 to $300,000 due to his tenure with the company and successful product development achievements.
Annual Cash Incentive Bonus. We also have an annual cash incentive bonus program to motivate our executive officers to attain specific short-term performance objectives that, in turn, further our long-term objectives. This program is managed as part of our annual business plan process and involves a high level of discretion on the part of our compensation committee. Typically, the board of directors approves a business plan for the year that incorporates corporate-level objectives. Achievement of those objectives becomes an important factor considered by the compensation committee when, after year-end, it makes a final determination of bonus amounts to be paid. Other factors that are considered by the compensation committee in determining amounts to pay include:
| • | our company’s overall performance and business results; |
| • | general market conditions; |
| • | future business prospects; |
| • | funds available from which to pay bonuses; |
| • | individual performance; |
| • | competitive conditions; and |
| • | any other factors it finds relevant. |
Each executive is measured against their contributions to the consolidated revenue and earnings achievement of our company as a whole along with their performance against individual objectives established at the beginning of the fiscal year with the participation of the respective executive as part of their total compensation plan. This discretionary approach to the variable component of our compensation program allows fluidity in how we manage short-term corporate strategy and executive incentives, while allowing us to achieve more consistency in our focus on longer-term corporate objectives. Our compensation committee and our board of directors believe that this flexibility is important in managing a growing company because it allows executive officers to respond to the often changing demands of the business without undue focus on any one specific short-term performance objective. Our compensation committee does not have plans at this time to change the way it manages our annual cash incentive bonus program or to take a more formal or objective approach to the way it sets bonus payment amounts.
83
Table of Contents
Each executive officer has a target bonus amount, established at the time of hire and then reviewed and potentially adjusted annually over the course of the officer’s tenure with our company. For 2010, the target bonuses for executive officers ranged from 30% to 40% of base salary based on our compensation committee’s belief of respective competitive levels for each officer’s overall amount of fixed and variable compensation. For 2010, the corporate-level performance objectives specified in our business plan related to consolidated sales growth, earnings and certain strategic objectives. Our compensation committee set a consolidated earnings target sufficient to fund the bonus pool during 2010.
On February 10, 2011, the compensation committee approved an increase in the target bonuses for certain officers to 100% of base salary to provide competitive variable compensation levels in light of the company’s overall strategic growth and earnings objectives.
Because of our limited cash flows and our company’s historical losses, our executive officers have not been awarded cash bonuses during the past three years. Our compensation committee elected not to award our named executive officers performance based incentive bonuses for fiscal 2010 because of continued losses.
Long-Term Incentive Compensation. To date, our long-term incentive awards have primarily been in the form of options to purchase our common stock, which options are generally awarded under our Amended and Restated Equity-Based Compensation Plan, or the Equity Plan. Our stock options have an exercise price at least equal to the fair market value of our common stock on the grant date, generally vest over four years, with 25% of the option shares vesting after the first, second, third and fourth years of service following the grant, and have a ten year term. Additional vesting acceleration benefits apply in certain circumstances discussed below.
Generally, a stock option award is made in the year that an executive officer commences employment. The size of this award is intended to offer the executive a meaningful opportunity for stock ownership relative to his or her position and reflects the compensation committee’s assessment of market conditions affecting the position as well as the individual’s potential for future responsibility within our company. Thereafter, additional option grants may be made in the discretion of our compensation committee, board of directors or committee of independent directors. To date, we have not granted additional options on an annual basis to executives or other employees, although we do evaluate individual performance annually. Instead, additional options have been granted to executives on a case-by-case basis reflecting the compensation committee’s determination that such grants are appropriate or necessary to reward exceptional performance (including upon promotion) or to retain individuals when market conditions change. The size of additional option grants are determined in the discretion of the compensation committee or our board of directors, and typically incorporate our CEO’s recommendations (except with respect to his own option grants).
In 2010, our board of directors approved additional option grants to our CEO based upon his length of service, promotion to Chairman of the board of directors and achievement in improving sales results and market acceptance of our products. In addition, our board of directors approved initial option grants to our Chief Financial Officer and our Chief Operating Officer in conjunction with their hiring. The amounts of these grants are presented below under “Executive compensation — 2010 grants of plan-based awards.”
Other than awards of restricted stock granted to our former Chief Executive Officer and current Chief Technology Officer in 2008 and our Senior Vice President, Strategy and Finance in 2009, we have not granted restricted stock awards to our NEOs.
On February 10, 2011, we amended the vesting provisions of the stock option agreements of certain officers (including each of the NEOs that are currently employed by us) to provide that 50% of the previously granted stock options will vest on the first and second anniversary of the applicable date of grant. These amendments also provided that these options will become fully vested upon the holder’s death, disability, termination without cause or termination for good reason. For purposes of this agreement, “cause” and “good reason” have the same definition of “cause” and “good reason” in Mr. Gibler’s employment agreement below.
84
Table of Contents
LSGC Holdings, the beneficial owner of approximately 88.7% of our common stock, has created a non-voting class of profits interests (“Class B Units”) in LSGC Holdings in order to provide additional incentive compensation to certain members of our management team. Awards of Class B Units were made January 24, 2011. The Class B Units entitle the holders (including each of the NEOs that are currently employed by us) to participate in the distributions made by LSGC Holdings to its members, but only after the holders of Class A Units in LSGC Holdings have received distributions equal to the fair market value of the assets of LSGC Holdings on the grant date of the awards. The Class B Units, which were deemed to have a fair market value of $0.00 on the grant date, remain subject to vesting upon the passage of time.
Severance and Change in Control Benefits. We have entered into employment agreements with each of our named executive officers, which provide severance benefits in the event the executive officer’s employment is terminated by us without cause or the executive officer is terminated without cause in connection with a change in control, in consideration of a release of potential claims and other customary covenants. These benefits range from 12 weeks to, following a change-in-control, 24 months of their base salary. In addition, all stock options held by our NEOs provide for full acceleration of unvested stock options upon a change of control of our company. For more information regarding these severance and change in control benefits, see “Executive compensation — Estimated benefits and payments upon termination of employment or change of control.” Our board of directors and compensation committee have determined it appropriate to have these termination-related benefits in place to preserve morale and productivity, and encourage retention in the face of potentially disruptive circumstances that might cause an executive to be concerned that his or her employment is in jeopardy or that might involve an actual or rumored change in control of our company. We believe that our change of control benefits are generally in line with packages offered to executives in our industry.
Other Benefits. Certain NEOs are entitled to monthly car allowances pursuant to their employment agreements and/or were reimbursed for relocation and moving expenses. The values of such benefits are presented below under the “Summary compensation table” as “All Other Compensation.”
We also provide our executive officers with benefits that are generally available to our salaried employees. These benefits include health and medical benefits, flexible spending plans and the opportunity to participate in an employee stock purchase plan, and a 401(k) retirement plan or comparable foreign plan.
Tax matters
Our board of directors and compensation committee will consider the deductibility of compensation amounts paid to our executive officers including the potential future effects of Section 162(m) of the Internal Revenue Code on the compensation paid to our executive officers in making its decisions, although such deductibility has not historically been material to our financial position. Section 162(m) disallows a tax deduction for any publicly held corporation for individual compensation exceeding $1.0 million in any taxable year for our CEO and each of the other named executive officers (other than our Chief Financial Officer), unless compensation is “performance-based” as defined under Section 162(m). Our stock option grants are generally designed to qualify as performance-based compensation for purposes of Section 162(m), and we expect compensation amounts related to options to be fully deductible. However, our compensation committee may, in its judgment, authorize compensation payments that are not deductible when it believes that such payments are appropriate to attract and retain executive talent.
85
Table of Contents
Summary compensation table
The following table summarizes the overall compensation earned by NEOs during each of the past three fiscal years ended December 31, 2010.
| Name and Principal Position |
Year | Salary ($) |
Stock Awards ($) (1) |
Option Awards ($) (1) |
All Other Compensation ($) |
Total ($) | ||||||||||||||||||
| Zachary Gibler |
2010 | $ | 325,000 | — | $ | 384,900 | $ | 89,800 | (3) | $ | 799,700 | |||||||||||||
| (Chairman and Chief Executive Officer) (2) |
2009 | $ | 248,542 | — | $ | 1,706,320 | $ | 8,400 | (3) | $ | 1,963,262 | |||||||||||||
| 2008 | $ | 183,333 | $ | 172,938 | $ | 207,525 | — | $ | 563,796 | |||||||||||||||
| Gregory Kaiser |
2010 | $ | 85,606 | — | $ | 480,700 | — | $ | 566,306 | |||||||||||||||
| (Chief Financial Officer) (4) |
||||||||||||||||||||||||
| Frederic Maxik |
2010 | $ | 275,000 | — | — | $ | 14,400 | (5) | $ | 289,400 | ||||||||||||||
| (Chief Technology Officer) |
2009 | $ | 250,000 | — | $ | 339,600 | $ | 5,900 | (5) | $ | 595,500 | |||||||||||||
| 2008 | $ | 250,000 | $ | 484,225 | $ | 207,525 | — | $ | 941,750 | |||||||||||||||
| John Stanley |
2010 | $ | 144,697 | — | $ | 481,600 | $ | 14,000 | (7) | $ | 640,297 | |||||||||||||
| (Chief Operating Officer) (6) |
||||||||||||||||||||||||
| Khaled Haram |
2010 | $ | 119,689 | — | — | $ | 119,700 | (9) | $ | 239,389 | ||||||||||||||
| (President and Chief Operating Officer) (8) |
2009 | $ | 108,278 | — | $ | 339,600 | $ | 7,200 | (9) | $ | 455,078 | |||||||||||||
| Jonathan Cohen |
2010 | $ | 122,811 | — | $ | 43,020 | $ | 41,250 | (11) | $ | 207,081 | |||||||||||||
| (Chief Accounting Officer) (10) |
2009 | $ | 27,500 | — | $ | 27,920 | — | $ | 55,420 | |||||||||||||||
| Kathryn Reynolds |
2010 | $ | 30,572 | — | — | $ | 46,154 | (11) | $ | 76,726 | ||||||||||||||
| (Senior Vice President, Strategy and Finance) (12) |
2009 | $ | 155,416 | $ | 24,343 | $ | 78,395 | — | $ | 258,154 | ||||||||||||||
| (1) | Represents the total grant date fair value, as determined under Financial Accounting Standards Board (FASB) Accounting Standards Codification (ASC) Topic 718, Stock Compensation, of all awards granted to the NEO during fiscal 2010, 2009 and 2008, as applicable. Assumptions used to calculate these amounts are included in Note 13, “Equity Based Compensation Plans,” to our consolidated financial statements for the year ended December 31, 2010. |
| (2) | Mr. Gibler began serving as our Chief Executive Officer on June 11, 2009 and passed away on January 2, 2011. |
| (3) | Includes $14,400 of car allowance and $75,400 for reimbursement of relocation and moving expenses during 2010. Consists of car allowance during 2009. |
| (4) | Mr. Kaiser began serving as our Chief Financial Officer on August 31, 2010. |
| (5) | Consisted of car allowance. |
| (6) | Mr. Stanley began serving as our Chief Operating Officer on June 1, 2010. |
| (7) | Consisted of relocation expenses. |
| (8) | Mr. Haram began serving as our Chief Operating Officer on July 13, 2009 and resigned on June 30, 2010. |
| (9) | Includes $112,500 of separation pay and $7,200 of car allowance during 2010. Consisted of car allowance during 2009. |
| (10) | Mr. Cohen began serving as our Chief Accounting Officer on November 1, 2009 and resigned on September 10, 2010. |
| (11) | Consists of separation pay. |
| (12) | Ms. Reynolds began serving as our Senior Vice President, Strategy and Finance on March 3, 2009 and resigned on January 29, 2010. |
In May 2010, Mr. Gibler was awarded stock options to purchase 250,000 shares of common stock. These options have an exercise price of $2.48 per share and a ten-year term. In May 2010, we also granted Mr. Stanley options to purchase 700,000 shares of common stock at an exercise price of $1.11 per share in conjunction with his commencement of employment and promotion to Chief Operating Officer. Similarly, in August 2010, we granted Mr. Kaiser options to purchase 500,000 shares of common stock at an exercise price of $1.64 per share when he was appointed Chief Financial Officer. Mr. Gibler’s options were scheduled to vest and become exercisable in equal annual installments over a four-year period commencing on the first anniversary of the date of grant. After giving effect to the amendments that were approved on February 10, 2011, Mr. Stanley’s and Mr. Kaiser’s options vest and become exercisable in equal annual installments over a two-year period
86
Table of Contents
commencing on the first anniversary of the date of grant, and these options will be subject to acceleration in the event of a change in control, upon their death or becoming disabled, termination without cause, termination for good reason and may be accelerated upon retirement in the discretion of our board of directors. The exercise price of each award is equal to at least the fair market value of the company’s common stock on the date of grant.
2010 grants of plan-based awards
The following table sets forth each Equity Plan-based award granted to our NEOs during the year ended December 31, 2010.
| Option Award: | ||||||||||||||
| Grant Date |
Number of Securities Underlying Options |
Exercise Price of Option Awards (1) |
Grant Date Fair Value of Option Awards (2) |
|||||||||||
| Zachary Gibler |
May 26, 2010 |
250,000 | $ | 2.48 | $ | 384,900 | ||||||||
| Gregory Kaiser |
August 31, 2010 |
500,000 | $ | 1.64 | $ | 480,700 | ||||||||
| John Stanley |
May 6, 2010 |
700,000 | $ | 1.11 | $ | 481,600 | ||||||||
| Jonathan Cohen |
March 22, 2010 |
100,000 | $1.00 | $43,020 | ||||||||||
| (1) | The amounts in this column represent the exercise price of the option awards, as determined by our board of directors with the assistance of management, which is not less than the fair market value of our common stock on the date of grant. |
| (2) | Represents the total grant date fair value, as determined under Financial Accounting Standards Board (FASB) Accounting Standards Codification (ASC) Topic 718, Stock Compensation, of all awards granted to the NEO during fiscal 2010, as applicable. Assumptions used to calculate these amounts are included in Note 13, “Equity Based Compensation Plans,” to our consolidated financial statements for the year ended December 31, 2010. |
87
Table of Contents
Outstanding equity awards at 2010 fiscal year-end
The following table provides certain information concerning unexercised options, stock that has not vested and Plan awards held by each of our NEOs that were outstanding as of December 31, 2010.
| Option Awards | Stock Awards | |||||||||||||||||||||||||||||||||||
| Name |
Number of Securities Underlying Unexercised Options (#) Exercisable |
Number of Securities Underlying Unexercised Options (#) Unexercisable |
Equity Incentive Plan Awards: Number of Securities Underlying Unexercised Unearned Options (#) |
Option Exercise Price ($) |
Option Expiration Date |
Number of Shares or Units of Stock That Have Not Vested (#) |
Market Value of Shares or Units of Stock That Have Not Vested ($) (1) |
Equity Incentive Plan Awards: Number of Unearned Shares, Units or Other Rights That Have Not Vested (#) |
Equity Incentive Plan Awards: Market or Payout Value of Unearned Shares, Units or Other Rights That Have Not Vested ($) (1) |
|||||||||||||||||||||||||||
| Zachary Gibler |
50,000 | (2) | 25,000 | (3) | — | $ | 4.90 | 4/17/2013 | — | — | 41,667 | (5) | $ | 135,418 | ||||||||||||||||||||||
| 2,500,000 | (6) | — | — | $ | 1.00 | 8/21/2019 | ||||||||||||||||||||||||||||||
| — | 250,000 | (4) | — | $ | 2.48 | 5/26/2020 | ||||||||||||||||||||||||||||||
| Frederic Maxik |
50,000 | (2) | 25,000 | (7) | — | $ | 4.90 | 4/17/2013 | — | — | 116,667 | (8) | $ | 379,168 | ||||||||||||||||||||||
| 1,500,000 | (6) | — | — | $ | 1.00 | 8/21/2019 | ||||||||||||||||||||||||||||||
| Gregory Kaiser |
— | 500,000 | (9) | — | $ | 1.64 | 8/31/2020 | — | — | — | — | |||||||||||||||||||||||||
| John Stanley |
— | 700,000 | (10) | — | $ | 1.11 | 5/6/2020 | — | — | — | — | |||||||||||||||||||||||||
| Khaled Haram |
645,085 | (11) | — | — | $ | 1.00 | 10/30/2012 | — | — | — | — | |||||||||||||||||||||||||
| Kathryn Reynolds |
6,667 | (12) | — | — | $ | 0.60 | 7/31/2012 | — | — | — | — | |||||||||||||||||||||||||
| 100,000 | (13) | — | — | $ | 1.00 | 7/31/2012 | — | — | — | — | ||||||||||||||||||||||||||
| 100,000 | (13) | — | — | $ | 1.00 | 10/31/2012 | — | — | — | — | ||||||||||||||||||||||||||
| (1) | Assumes a market value of $3.25 per share of common stock, as reported on the OTC Bulletin Board on December 31, 2010. |
| (2) | These options were granted on April 17, 2008 and 25,000 options vested on each of April 17, 2009 and April 17, 2010. |
| (3) | These options were granted on April 17, 2008 and were scheduled to vest on April 17, 2011. However, due to the death of Mr. Gibler on January 2, 2011, no further vesting of these options will occur. |
| (4) | These options were granted on May 26, 2010. 62,500 of these options were scheduled to vest on each of May 26, 2011, May 26, 2012, May 26, 2013 and May 26, 2014. However, due to the death of Mr. Gibler on January 2, 2011, 37,842 of the shares automatically vested on January 2, 2011 in accordance with the terms of this grant. No further vesting of these options will occur. |
| (5) | Mr. Gibler was awarded 62,500 shares of restricted stock on April 17, 2008. As long as Mr. Gibler remained employed by us, his remaining shares of restricted stock were scheduled to vest as follows: (i) 21,250 shares would vest on the date that our gross revenues from the sale of products or licensing of technology (“Recognized Revenue”) equaled $115.0 million, and (ii) 20,625 shares would vest on the date that our Recognized Revenue equaled $150.0 million. Any restricted shares that had not vested prior to May 7, 2011 would automatically vest. Due to the death of Mr. Gibler on January 2, 2011, no further vesting of this restricted stock grant will occur. |
| (6) | These options were granted on August 21, 2009 and vesting was accelerated on December 30, 2010 due to the achievement of a “capitalization threshold event.” |
| (7) | These options were granted on April 17, 2008 and are scheduled to vest on April 17, 2011. |
| (8) | Mr. Maxik was awarded 175,000 shares of restricted stock on May 7, 2008. As long as Mr. Maxik remains employed by us, his remaining shares of restricted stock vest as follows: (i) 58,333 shares vest on the date that our Recognized Revenue equals $115.0 million, and (ii) 58,334 shares vest on the date that our Recognized Revenue equals $150.0 million. Any restricted shares that have not vested prior to May 7, 2011 will automatically vest. |
| (9) | These options were granted on August 31, 2010. 250,000 of these options will vest on each of August 31, 2011and August 31, 2012. |
| (10) | These options were granted on May 6, 2010. 350,000 of these options will vest on each of May 6, 2011 and May 6, 2012. |
| (11) | These options were granted on April 21, 2009 and vesting was accelerated on April 30, 2010 in accordance with the separation agreement entered into by Mr. Haram and the company. |
| (12) | These options were granted on June 26, 2009 and vesting was accelerated on January 31, 2010 in accordance with the separation agreement entered into by Ms. Reynolds and the company. |
| (13) | These options were granted on August 21, 2009 and vesting was accelerated on January 31, 2010 in accordance with the separation agreement entered into by Ms. Reynolds and the company. |
88
Table of Contents
Option exercises
The following table sets forth stock options that were exercised by each of our NEOs during the fiscal year 2010.
| Option awards | ||||||||
| Number of shares acquired on exercise (#) |
Value realized on exercise (1) |
|||||||
| Khaled Haram |
104,915 | $ | 244,460 | |||||
| Jonathan Cohen |
125,000 | $ | 259,124 | |||||
| Kathryn Reynolds |
15,000 | $ | 41,100 | |||||
| (1) | Computed based on the difference between the market value of the underlying shares of common stock at exercise and the exercise price of the option. |
Employment agreements
We entered into employment agreements with all of our NEOs.
Employment agreement with Zachary Gibler
On October 4, 2007, we entered into an employment agreement with Mr. Gibler pursuant to which Mr. Gibler agreed to serve as our Chief Business Development Officer. On August 17, 2009, such agreement was superseded by a new agreement pursuant to which Mr. Gibler agreed to serve as our Chief Executive Officer, effective as of June 11, 2009. Pursuant to this employment agreement, Mr. Gibler was entitled to an annual base salary of $275,000, a monthly car allowance of $1,200 and benefits generally available to other employees. However, in May 2010, as part of the annual compensation review, Mr. Gibler’s base salary was increased from $275,000 to $375,000. Mr. Gibler was also eligible to participate in a bonus plan of up to 40% of his base salary based upon a combination of our performance and personal achievements. Pursuant to his employment agreement, we agreed to grant Mr. Gibler an award of restricted stock and/or options under the Equity Plan, which award would be made at a later date. Mr. Gibler’s employment agreement could be terminated at any time, without severance, by Mr. Gibler voluntarily or by us with “cause.” If Mr. Gibler’s employment were terminated by us without “cause” or by Mr. Gibler for “good reason,” then he would be entitled to severance pay equal to 12 months’ base salary.
For purposes of this agreement, “cause” was defined as: (a) a misrepresentation of the executive’s education, work experience and/or any other matter upon which the company relied in considering and offering employment; (b) willful breach of the executive’s obligations under the agreement, which breach the executive fails to cure, if curable, within 30 days after receipt of a written notice of such breach; (c) gross negligence in the performance or intentional non-performance of material duties to the company; (d) commission of a felony or a crime of moral turpitude; (e) commission of a material act of deceit, fraud, perjury or embezzlement that involves or directly or indirectly causes harm to the company; (f) repeatedly (i.e., on more than one occasion) being under the influence of drugs or alcohol during the performance of the executive’s duties to the company or, while under the influence of such drugs or alcohol, engaging in grossly inappropriate conduct during the performance of the executive’s duties to the company. “Good reason” was defined as any of the following occurrences (without the executive’s consent): (a) any material breach by the company of its obligations under the agreement that is not cured within a reasonable time, (b) a reduction in base salary that is greater than 10% or greater proportionally than an across-the-board reduction in the base salaries of all officers of the company, (c) a material reduction by the company in the kind or level of employee benefits to which the executive is entitled immediately prior to such reduction that is not generally applicable to all executive level employees; or (d) a material reduction by the company of the executive’s duties and responsibilities, including a material change in job title.
89
Table of Contents
Employment agreement with Frederic Maxik
On October 4, 2007, we entered into an employment agreement with Mr. Maxik pursuant to which Mr. Maxik agreed to serve as our Chief Scientific Officer. Under his employment agreement, Mr. Maxik was entitled to an annual base salary of $250,000. However, in May 2010, as part of the annual compensation review, Mr. Maxik’s base salary was increased from $250,000 to $300,000. We could also pay Mr. Maxik bonuses at such times and in such amounts as our board of directors determines, and Mr. Maxik was entitled to participate in the Equity Plan. Mr. Maxik’s employment agreement had a term commencing on October 4, 2007 and continued until October 4, 2012. It may be terminated at any time, without severance, by Mr. Maxik voluntarily or by us with “cause.” In the event that Mr. Maxik’s employment is terminated by us without “cause” or by Mr. Maxik with “good reason,” Mr. Maxik would have been entitled to severance pay equal to 12 months’ base salary. “Cause” and “Good Reason” had the same definitions as those terms in Mr. Gibler’s employment agreement, except that “Cause” did not explicitly include a misrepresentation of education, work experience or other matter upon which the company relied in considering and offering employment.
On March 22, 2011, we entered into a new employment agreement with Mr. Maxik pursuant to which Mr. Maxik agreed to serve as our Chief Technology Officer. The new employment agreement contains substantially the same terms as the prior agreement. However, the new employment agreement extends the term to October 4, 2014 and increases the salary continuation period to 24 months in the event Mr. Maxik’s employment is terminated by us without “cause” or by Mr. Maxik for “good reason” during the 24-month period following a change in control. Any severance paid reduces the amount that Mr. Maxik otherwise would be entitled to receive for complying with the non-competition restrictions in his employment agreement, except in the case of a qualifying severance following a change in control.
For purposes of Mr. Maxik’s new employment agreement, “cause” is defined as: (a) a willful breach of the executive’s obligations under the agreement, which the executive fails to cure within 30 days after receipt of a written notice of such breach; (b) gross negligence in the performance or intentional non-performance of the executive’s material duties to us; (c) commission of a felony or a crime of moral turpitude; (d) commission of a material act of deceit, fraud, perjury or embezzlement that involves or directly or indirectly causes harm to us or any of our affiliates; or (e) repeatedly (i.e., on more than one occasion) being under the influence of drugs or alcohol (other than over-the-counter or prescription medicine or other medically-related drugs to the extent they are taken in accordance with their directions or under the supervision of a physician) during the performance of the executive’s duties to us or any of our affiliates, or, while under the influence of such drugs or alcohol, engaging in grossly inappropriate conduct during the performance of the executive’s duties to us or any of our affiliates.
For purposes of Mr. Maxik’s prior employment agreement, “good reason” had the same meaning given to such term in Mr. Gibler’s employment agreement. For purposes of Mr. Maxik’s new employment agreement, “good reason” means the occurrence, without the executive’s written consent, any of the following events: (a) any material breach by us of our obligations under the agreement; (b) a reduction in the executive’s base salary (other than a reduction made in connection with an across-the-board proportionate reduction in the base salaries of all employees with a position of director or above that is no more than 10% of base salary); (c) a material reduction in the kind or level of employee benefits to which the executive is entitled to immediately prior to such reduction (other than a reduction generally applicable to all executive level employees that, in combination with any reduction in base salary, does not reduce total compensation by more than 10%); or (d) a material reduction of the executive’s duties and level of responsibilities; provided that any such event will not constitute good reason unless the executive delivers to us a written notice of termination for good reason within 90 days after the executive first learns of the existence of the circumstances giving rise to good reason, and within 30 days following the delivery of such notice, we have failed to cure the circumstances giving rise to good reason.
90
Table of Contents
Employment agreement with John Stanley
On April 7, 2010, we entered into an employment agreement with Mr. Stanley pursuant to which Mr. Stanley agreed to serve as our Senior Vice President, Global Supply Chain. Pursuant to the employment agreement, Mr. Stanley was entitled to a base salary of $200,000 and benefits generally available to other employees. However, in January 2011, as part of the annual compensation review, Mr. Stanley’s base salary was increased from $200,000 to $250,000. Mr. Stanley was also eligible to participate in a bonus plan of up to 40% of his base salary based upon a combination of performance and personal achievements. In addition, pursuant to his employment agreement, we agreed to grant Mr. Stanley an option, to purchase 700,000 shares of common stock under the Equity Plan. Mr. Stanley’s employment is at will and may be terminated at any time. If Mr. Stanley’s employment is terminated for reasons other than for “cause” or a change in control, Mr. Stanley was entitled to six months of base salary. If Mr. Stanley’s employment is terminated due a change in control, Mr. Stanley was entitled to 12 months of base salary.
Effective as of February 10, 2011, we entered into a new employment agreement with Mr. Stanley pursuant to which Mr. Stanley agreed to serve as our Chief Operating Officer. The new employment agreement contains substantially the same terms as the prior agreement. However, the new employment agreement increases the salary continuation period to 12 months in the event Mr. Stanley’s employment is terminated by us without “cause” or by Mr. Stanley for “good reason”. In addition, such salary continuation period shall be increased to 24 months in the case of termination by us without “cause” or by Mr. Stanley for “good reason” during the 24-month period following a change in control. Any severance paid reduces the amount that Mr. Stanley otherwise would be entitled to receive for complying with the non-competition restrictions in his employment agreement, except in the case of a qualifying severance following a change in control.
For purposes of Mr. Stanley’s new employment agreement, “cause” has the same meaning given to the term in Mr. Maxik’s employment agreement, but also includes the executive’s misrepresentation of his education or work experience or any other matter upon which we relied in considering and offering him employment. “Good reason” has the same meaning given to the term in Mr. Maxik’s new employment agreement.
On February 10, 2011, the compensation committee also amended the vesting provisions of Mr. Stanley’s option agreements to provide that 50% of the options granted shall vest on the first and second anniversary of the applicable date of grant. The amendment also provides that the options shall become fully vested upon the optionholder’s death, disability, termination without cause or termination for good reason.
Employment agreement with Gregory Kaiser
On July 14, 2010, we entered into an employment agreement with Mr. Kaiser pursuant to which Mr. Kaiser agreed to serve as our interim Chief Financial Officer. Pursuant to the employment agreement, Mr. Kaiser was entitled to a base salary of $200,000 and benefits generally available to other employees. Mr. Kaiser was also eligible to participate in a bonus plan of up to 40% of his base salary based upon a combination of performance and personal achievements. Mr. Kaiser was also entitled to a grant of stock options in an amount to be determined. Mr. Kaiser’s employment is at will and may be terminated at any time. If Mr. Kaiser was terminated for reasons other than for “cause” or a change in control during the first year of employment, Mr. Kaiser was entitled to 12 weeks of base pay. If he were to be terminated anytime thereafter for reasons other than for “cause” or a change in control, Mr. Kaiser was entitled to 24 weeks of base pay. If Mr. Kaiser’s employment was terminated due to a change in control during the first year of employment, Mr. Kaiser was entitled to a severance payment of 24 weeks of base pay.
Effective as of February 10, 2011, we entered into a new employment agreement with Mr. Kaiser pursuant to which Mr. Kaiser agreed to continue to serve as our Chief Financial Officer. The new employment agreement contains substantially the same terms as the prior agreement. However, the new employment agreement increases the salary continuation period to 12 months in the event Mr. Kaiser’s employment is terminated by us without “cause” or by Mr. Kaiser for “good reason.” In addition, such salary continuation period shall be increased to 24
91
Table of Contents
months in the case of termination by us without “cause” or by Mr. Kaiser for “good reason” during the 24-month period following a change in control. Any severance paid reduces the amount that Mr. Kaiser otherwise would be entitled to receive for complying with the non-competition restrictions in his employment agreement, except in the case of a qualifying severance following a change in control. For purposes of this agreement, “cause” and “good reason” have the same definition of “cause” and “good reason” in Mr. Stanley’s employment agreement.
On February 10, 2011, the compensation committee also amended the vesting provisions of Mr. Kaiser’s option agreements to provide that 50% of the options granted shall vest on the first and second anniversary of the applicable date of grant. The amendment also provides that the options shall become fully vested upon the optionholder’s death, disability, termination without cause or termination for good reason.
Employment agreement with Jon Cohen
On October 27, 2009, we entered into an employment agreement with Mr. Cohen pursuant to which Mr. Cohen agreed to serve as our Vice President & Chief Accounting Officer. Pursuant to the employment agreement, Mr. Cohen was entitled to a base salary of $165,000 and benefits generally available to other employees. Mr. Cohen was also eligible to participate in a bonus plan of up to 30% of his base salary based upon a combination of professional and personal achievements. In addition, pursuant to his employment agreement, we agreed to grant Mr. Cohen 100,000 shares of common stock under the Equity Plan. Mr. Cohen’s employment was at will and could be terminated at any time. If Mr. Cohen’s employment was terminated for reasons other than for “cause”, Mr. Cohen was entitled to receive 4 weeks of base salary. For purposes of the agreement, “cause” has the same definition as “cause” in Mr. Maxik’s original employment agreement.
On June 4, 2010, we entered into an agreement with Mr. Cohen which superseded his employment agreement. Pursuant to the new agreement, Mr. Cohen agreed to continue to serve as our Vice President & Chief Accounting Officer while we looked to hire a new Chief Financial Officer. Under this agreement, if Mr. Cohen’s employment was terminated for reasons other than for “cause,” Mr. Cohen was entitled to three months of base salary. For purposes of this agreement, “cause” meant any act or omission which constitutes a felony or any crime involving dishonesty, theft or fraud; any act of dishonesty resulting or intended to result directly or indirectly in gain or personal enrichment to Mr. Cohen at the expense of the company; and/or the willful and continued failure to substantially perform the duties and responsibilities of his position. Mr. Cohen’s employment was terminated on July 30, 2010, which became effective on September 10, 2010. In accordance with his agreement, Mr. Cohen was entitled to three months base salary upon his termination.
Employment agreement with Khaled Haram
On July 10, 2009, we entered into an employment agreement with Mr. Haram pursuant to which Mr. Haram agreed to serve as our President and Chief Operating Officer. Pursuant to the employment agreement, Mr. Haram was entitled to a base salary of $225,000, a car allowance of $1,200 per month, and benefits generally available to other employees. In addition, we agreed to grant Mr. Haram a number of shares of restricted stock and stock options, which would be made at a later date. Mr. Haram was also eligible to participate in a bonus plan of up to 40% of his base salary based upon a combination of performance and personal achievements. Mr. Haram’s employment was at will and could be terminated at any time. If Mr. Haram’s employment was terminated for reasons other than for “cause” or a change in control, Mr. Haram was entitled to six months of base pay (provided that either (1) Mr. Haram did not return to work for Pegasus Capital or another portfolio company of Pegasus Capital or (2) Mr. Haram was retained by Pegasus Capital or another portfolio company for less than six months). If Mr. Haram’s employment was terminated due to, and within three months of, a change in control, Mr. Haram was entitled to 12 months of base salary. For purposes of this agreement, “cause” has the same definition as “cause” in Mr. Gibler’s agreement.
On April 28, 2010, we entered into a separation agreement with Mr. Haram, pursuant to which Mr. Haram’s employment terminated on June 30, 2010 and his services transitioned to Mr. Cohen and Mr. Stanley. In
92
Table of Contents
accordance with his employment agreement, Mr. Haram was entitled to six months of base salary upon his termination. In addition, upon his termination, 750,000 of the stock options granted to Mr. Haram on August 21, 2009 became vested.
Employment agreement with Kathryn Reynolds
On February 28, 2009, we entered into an agreement with Ms. Reynolds pursuant to which Ms. Reynolds agreed to serve as Senior Vice President, Strategy and Finance. Pursuant to the agreement, Ms. Reynolds was entitled to a base salary of $200,000 and benefits generally available to other employees. In addition, we agreed to grant Ms. Reynolds a number of shares of restricted stock and stock options, which would be made at a later date. Ms. Reynolds was also eligible to participate in a bonus plan of up to 40% of her base salary based upon a combination of performance and personal achievements. Ms. Reynolds’s employment was at will and could be terminated at any time. If Ms. Reynolds’ employment were terminated for reasons other than for “cause” or a change in control, Ms. Reynolds was entitled to three months of base salary. If Ms. Reynolds’ employment were terminated due a change in control, Ms. Reynolds was entitled to six months of base salary. For purposes of the agreement, “cause” has the same definition as “cause” in Mr. Gibler’s employment agreement.
On January 21, 2010, we entered into a separation agreement with Ms. Reynolds, pursuant to which Ms. Reynolds’ employment terminated on January 31, 2010. In accordance with her employment agreement, Ms. Reynolds was entitled to three months of base salary upon her termination. In addition, upon her termination, 18,333 of the shares of restricted stock and 21,667 of the stock options granted to Ms. Reynolds pursuant to her employment agreement vested. In addition, 200,000 of the stock options granted to Ms. Reynolds on August 21, 2009 became vested.
93
Table of Contents
Estimated benefits and payments upon termination of employment or change of control
The following table describes the potential payments and benefits upon termination of our NEOs’ employment before or after a change in control of our company as described above, as if each officer’s employment terminated as of December 31, 2010, the last business day of fiscal 2010. See “Compensation discussion and analysis — Principal elements of executive compensation — Severance and change in control benefits” for a description of the severance and change in control arrangements for our named executive officers.
| Name |
Triggering Event |
Type of Payment/Benefit |
Amount |
|||||
| Zachary Gibler | Termination without cause or for good reason | Base Salary | $ | 375,000 | ||||
| Change in control | Vesting Acceleration of Option Awards | $ | 192,500 | (1) | ||||
| Vesting Acceleration of Restricted Stock | $ | 135,418 | ||||||
| Frederic Maxik | Termination without cause or for good reason | Base Salary | $ | 300,000 | ||||
| Change in control | Vesting Acceleration of Restricted Stock | $ | 379,168 | |||||
| John Stanley | Termination without cause | Base Salary | $ | 100,000 | ||||
| Change in control | Vesting Acceleration of Option Awards | $ | 1,498,000 | (1) | ||||
| Termination upon change in control (2) | Base Salary | $ | 200,000 | |||||
| Gregory Kaiser | Termination without cause | Base Salary | $ | 46,154 | (4) | |||
| Change in control | Vesting Acceleration of Option Awards | $ | 805,000 | (1) | ||||
| Termination upon change in control (3) | Base Salary | $ | 92,308 | |||||
| Jonathan Cohen | Termination without cause | Base Salary | $ | 41,250 | (6) | |||
| Khaled Haram | Termination without cause | Base Salary | $ | 112,500 | ||||
| Base Salary | $ | 225,000 | (5) | |||||
| Kathryn Reynolds | Termination without cause | Base Salary | $ | 50,000 | ||||
| Termination upon a change in control | Base Salary | $ | 100,000 | |||||
| (1) | Assumes a market value of $3.25 per share of common stock, as reported on the OTC Bulletin Board on December 31, 2010. |
| (2) | Termination must occur within 3 months of a change in control. |
| (3) | Termination must occur within first 12 months of employment. |
| (4) | This severance payment will increase to $92,308 if Mr. Kaiser is terminated without cause after one year of employment. |
| (5) | This payment would only be made if either: (i) Mr. Haram does not return to work for Pegasus Capital or another portfolio company of Pegasus Capital or (ii) Mr. Haram is retained by Pegasus Capital or another portfolio company for less than six months. |
| (6) | Mr. Cohen received this amount upon his resignation on July 30, 2010, which became effective on September 10, 2010. |
94
Table of Contents
Director Compensation
Director compensation is determined by the board of directors and recommended by the governance committee. During 2010, each of our non-employee directors was entitled to the following compensation:
| • | $40,000 paid in equal quarterly installments within 30 days of the end of each calendar quarter; |
| • | non-qualified stock options to purchase 12,000 shares of our common stock, which options vested in equal quarterly installments at the end of each calendar quarter; |
| • | 80,000 shares of common stock; and |
| • | compensation through our “Rainmaker” program to the extent they facilitated sales of our products to certain identified customers; provided, that our independent directors are not entitled to participate in this program. |
Our board of directors has approved the following compensation policy for our non-employee directors during 2011:
| • | non-qualified stock options to purchase 12,000 shares of common stock, which options will be awarded on January 3, 2011 and vest in equal quarterly installments on the first trading day immediately following the end of each fiscal quarter of 2011; |
| • | $120,000 payable in equal quarterly installments at the beginning of each fiscal quarter; |
| • | the chair of the audit committee will be entitled to an additional $50,000, payable in equal quarterly installments at the beginning of each fiscal quarter; |
| • | the chair of the finance committee will be entitled to an additional $100,000, payable in equal quarterly installments at the beginning of each fiscal quarter; |
| • | the chair of any other committee (other than the audit and finance committees) will be entitled to an additional $15,000, payable in equal quarterly installments at the beginning of each fiscal quarter; and |
| • | the Vice Chairmen of the board of directors will each be entitled to an additional $155,000, payable in equal quarterly installments at the beginning of each fiscal quarter. |
Each non-employee director may elect to receive all or a portion of their cash compensation in shares of common stock, subject to making an election on or before January 3, 2011. Any compensation that is paid in shares of common stock will be based upon a price per share of common stock equal to $3.30, and such shares shall be issued at the beginning of the fiscal year ending December 31, 2011. We will also reimburse non-employee directors for reasonable expenses incurred in connection with attending board of director and committee meetings.
95
Table of Contents
Director compensation table
Directors who are employees of the company receive no additional compensation for their service on our board of directors or its committees. The following table shows the overall compensation earned for the 2010 fiscal year with respect to each person who was a non-employee director as of December 31, 2010.
| Name |
Fees Earned or Paid in Cash ($) |
Stock Awards ($) (1) |
Option Awards ($) (1) |
Non-Equity Incentive Plan Compensation ($) |
Change in Pension Value and Nonqualified Deferred Compensation Earnings |
All Other Compensation ($) |
Total ($) |
|||||||||||||||||||||
| Robert Bachman |
$ | 45,000 | $ | 93,600 | $ | 5,694 | — | — | — | $ | 144,294 | |||||||||||||||||
| David Bell |
$ | 40,000 | $ | 93,600 | $ | 5,694 | — | — | — | $ | 139,294 | |||||||||||||||||
| Charles Darnell |
— | $ | 57,026 | $ | 8,554 | — | — | — | $ | 65,580 | ||||||||||||||||||
| Carlos Gutierrez |
$ | 20,000 | $ | 73,600 | $ | 4,365 | — | — | — | $ | 97,965 | |||||||||||||||||
| Donald Harkleroad |
$ | 55,000 | $ | 93,600 | $ | 5,694 | — | — | — | $ | 154,294 | |||||||||||||||||
| Michael Kempner |
$ | 20,000 | $ | 73,600 | $ | 4,365 | — | — | — | $ | 97,965 | |||||||||||||||||
| T. Michael Moseley |
$ | 20,000 | $ | 73,600 | $ | 4,365 | — | — | — | $ | 97,965 | |||||||||||||||||
| Richard Weinberg (2) |
$ | 20,000 | $ | 93,600 | — | — | — | — | $ | 113,600 | ||||||||||||||||||
| (1) | Represents the total grant date fair value, as determined under Financial Accounting Standards Board (FASB) Accounting Standards Codification (ASC) Topic 718, Stock Compensation, of all awards granted to the director during fiscal 2010, as applicable. Assumptions used to calculate these amounts are included in Note 13, “Equity Based Compensation Plans,” to our consolidated financial statements for the year ended December 31, 2010. Messrs. Bell, Bachman and Harkleroad were each granted options to purchase 12,000 shares of common stock; Messrs. Gutierrez, Kempner and Moseley were each granted options to purchase 9,200 shares of common stock; and Mr. Darnell was granted an option to purchase 2,600 shares of common stock. Mr. Darnell’s option has an exercise price of $3.29 per share. All other options have an exercise price of $1.00 per share. |
| (2) | Mr. Weinberg serves on our board of directors as a designee of Pegasus Capital. Pursuant to the policies of Pegasus Capital, any fees paid to Mr. Weinberg are for the benefit of Pegasus Capital. |
For 2011, non-employee directors are compensated for their service through a combination of a cash retainer and grants of nonqualified stock options to purchase shares of the company’s common stock. The cash component of compensation is payable in equal quarterly installments at the beginning of each fiscal quarter. However, each non-employee director may elect to receive all or a portion of the cash component in shares of common stock.
The option grants to non-employee directors generally vest in quarterly installments on the first trading day immediately following the end of each fiscal quarter. The exercise price of all option grants is equal to at least the fair market value on the date of grant and the maximum term of the option is ten years. The options are made subject to the Equity Plan and an individual stock option agreement. Non-employee directors appointed to fill a vacancy between annual meetings of stockholders are generally granted equity awards in an amount and with vesting terms that correspond to the remaining term of the service.
96
Table of Contents
The following table sets forth information regarding the beneficial ownership of common stock as of April 12, 2011 by each person known to us to own beneficially 5% or more of the outstanding common stock, each director, certain named executive officers, and the directors and executive officers as a group. The persons named in the table have sole voting and investment power with respect to all shares of common stock owned by them, unless otherwise noted. Percentage of ownership is based on 186,452,442 shares of common stock outstanding on April 12, 2011.
Beneficial ownership is determined in accordance with the rules of the SEC. For the purpose of calculating the number of shares beneficially owned by a stockholder and the percentage ownership of that stockholder, shares of common stock subject to options or warrants that are currently exercisable or exercisable within 60 days of the date of this prospectus by that stockholder are deemed outstanding.
| Common Stock | ||||||||
| Name and Address of Beneficial Owner |
Shares Beneficially Owned (1) | Percent of Class | ||||||
| Directors and Executive Officers |
||||||||
| Robert Bachman |
339,463 | (2) | * | |||||
| David Bell |
251,471 | (3) | * | |||||
| Jonathan Cohen (4) |
— | * | ||||||
| Charles Darnell |
22,933 | (5) | * | |||||
| Zachary Gibler (6) |
2,608,675 | (7) | 1.4 | % | ||||
| Khaled Haram (8) |
496,585 | (9) | * | |||||
| Donald Harkleroad |
341,502 | (10) | * | |||||
| Gregory Kaiser |
— | * | ||||||
| Michael Kempner |
353,319 | (11) | * | |||||
| Fredric Maxik |
1,670,362 | (12) | * | |||||
| T. Michael Moseley |
110,382 | (13) | * | |||||
| Kathryn Reynolds (14) |
160,000 | (15) | * | |||||
| John Stanley |
175,000 | (16) | * | |||||
| Leon Wagner |
824,061 | (17) | ||||||
| Richard Weinberg |
— | * | ||||||
| Directors and Executive Officers as a |
4,871,743 | 2.6 | % | |||||
| Certain Persons |
||||||||
| Craig Cogut (18)(19) |
165,412,280 | (20) | 88.7 | % | ||||
| LED Holdings, LLC (18)(19) |
29,172,496 | 15.7 | % | |||||
| LSGC Holdings LLC (18)(19) |
162,289,829 | (21) | 87.0 | % | ||||
| Pegasus Partners IV, L.P. (19) |
165,259,526 | (21) | 88.6 | % | ||||
| * | Less than 1%. |
| (1) | The number and percentage of shares of our common stock beneficially owned is determined under the rules of the SEC and is not necessarily indicative of beneficial ownership for any other purpose. Under these rules, beneficial ownership includes any shares for which a person has sole or shared voting power or investment power. |
| (2) | Includes 288,686 shares of common stock issued to USGT Investors, L.P. (“USGT”), 20,625 shares of common stock issuable to USGT upon the exercise of warrants and 15,000 shares of common stock issuable to Mr. Bachman pursuant to the exercise of stock options issued under the Equity Plan. Mr. Bachman is a controlling shareholder in the sole corporate general partner of USGT and may be deemed the beneficial owner of the shares held by USGT. |
| (3) | Includes 15,000 shares of common stock issuable to Mr. Bell pursuant to the exercise of stock options issued under the Equity Plan. |
| (4) | Mr. Cohen resigned from his position as Chief Accounting Officer on September 10, 2010. |
| (5) | Includes 5,600 shares of common stock issuable to Mr. Darnell pursuant to the exercise of stock options issued under the Equity Plan. |
| (6) | Mr. Gibler served as our Chairman and Chief Executive Officer during 2010 and passed away on January 2, 2011. |
| (7) | Includes 2,587,842 shares of common stock issuable to Mr. Gibler’s estate upon the exercise of stock options issued under the Equity Plan. |
| (8) | Mr. Haram resigned from his position as President and Chief Operating Officer on June 30, 2010. |
97
Table of Contents
| (9) | Includes 521,585 shares of common stock issuable to Mr. Haram pursuant to the exercise of stock options issued under the Equity Plan. |
| (10) | Includes 296,199 shares of common stock issued to The Bristol Company and 15,000 shares of common stock issuable to Mr. Harkleroad pursuant to the exercise of stock options issued under the Equity Plan. Mr. Harkleroad is the sole shareholder of The Bristol Company and may be deemed the beneficial owner of the shares held by The Bristol Company. |
| (11) | Includes 12,200 shares of common stock issuable to Mr. Kempner pursuant to the exercise of stock options issued under the Equity Plan and 99,403 shares of common stock issuable to Mr. Kempner upon the exercise of Series D Warrant held by Mr. Kempner. |
| (12) | Includes 1,550,000 shares of common stock issuable to Mr. Maxik upon the exercise of stock options issued under the Equity Plan and 117,250 shares of restricted stock issued to Mr. Maxik under the Equity Plan. |
| (13) | Includes 12,200 shares of common stock issuable to Mr. Moseley pursuant to the exercise of stock options issued under the Equity Plan. |
| (14) | Ms. Reynolds resigned from her position as Senior Vice President, Strategy and Finance on January 31, 2010. |
| (15) | Includes 180,000 shares of common stock issuable to Ms. Reynolds pursuant to the exercise of stock options issued under the Equity Plan. |
| (16) | Includes 175,000 shares of common stock issuable to Mr. Stanley upon exercise of stock options issued under the Equity Plan. |
| (17) | Includes 120,000 shares held by trusts for which Mr. Wagner may be deemed the beneficial owner and 3,000 shares of common stock issuable to Mr. Wagner pursuant to the exercise of stock options issued under the Equity Plan. |
| (18) | The principal address and principal office of each of LED Holdings, LLC (“LED Holdings”), LSGC Holdings LLC (“LSGC Holdings”), Pegasus Partners IV, L.P. (“Pegasus IV”) and Craig Cogut is c/o Pegasus Capital Advisors, L.P., 99 River Road, Cos Cob, CT 06807. |
| (19) | LSGC Holdings may be deemed to indirectly beneficially own 29,172,496 shares of common stock held by LED Holdings because LSGC Holdings may be deemed to have voting and dispositive power over such shares due to its membership interest in LED Holdings. Pegasus IV is the managing member of LSGC Holdings. Pegasus Investors IV, LP (“Pegasus Investors”) is the general partner of Pegasus IV and Pegasus Investors IV GP, LLC (“Pegasus GP”) is the general partner of Pegasus Investors. Pegasus GP is wholly owned by Pegasus Capital, LLC (“Pegasus Capital”, and together with Pegasus IV, Pegasus Investors and Pegasus GP, the “Pegasus Entities”). Pegasus Capital may be deemed to be directly or indirectly controlled by Craig Cogut (“Mr. Cogut”). By virtue of the foregoing, the Pegasus Entities and Mr. Cogut may be deemed to beneficially own the 29,172,496 shares of common stock held by LED Holdings and the 133,117,333 shares of common stock held by LSGC Holdings. Each of Pegasus IV, Pegasus Investors, Pegasus GP, Pegasus Capital and Mr. Cogut disclaims beneficial ownership of any of the common stock held by LED Holdings and LSGC Holdings and this disclosure shall not be deemed an admission that any of Pegasus IV, Pegasus Investors, Pegasus GP, Pegasus Capital or Mr. Cogut is the beneficial owner of such securities for purposes of Section 13(d) or for any other purpose. Additionally, Mr. Cogut may be deemed to indirectly own 137,754 shares of common stock and options to purchase 15,000 shares of common stock that represent payment of director fees paid by the company to Pegasus Capital Advisors IV, L.P. (“Pegasus Advisors”). Pegasus Capital Advisors IV GP, LLC (“Pegasus Advisors GP”) is the general partner of Pegasus Advisors and Mr. Cogut is the sole owner and managing member of Pegasus Advisors GP. Mr. Cogut disclaims beneficial ownership of the shares and options held by Pegasus Advisors, and this disclosure shall not be deemed an admission that Mr. Cogut is the beneficial owner of such securities for purposes of Section 13(d) or for any other purpose. |
| (20) | Includes 2,969,697 shares of common stock held by Pegasus IV, 29,172,496 shares of common stock held by LED Holdings and 133,117,333 shares of common stock held by LSGC Holdings. |
| (21) | Includes 29,172,496 shares of common stock held by LED Holdings and 133,117,333 shares of common stock held by LSGC Holdings. |
98
Table of Contents
Certain relationships and related transactions
Parent company
LSGC Holdings may be deemed to be our “parent” by virtue of its beneficial ownership of our voting securities. As of April 12, 2011, LSGC Holdings directly owned 133,117,333 shares of our common stock and indirectly owned an additional 29,172,496 shares of our common stock by virtue of its voting and dispositive control over shares held by its affiliate, LED Holdings. LSGC Holdings and LED Holdings are affiliates of Pegasus IV and Pegasus Capital and they collectively hold approximately 88.7% of our common stock as of April 12, 2011 (calculated in accordance with Rule 13d-3 of the Exchange Act).
Related party transaction policy
Our board of directors has adopted a written policy with respect to the review, approval or ratification of related party transactions. The policy generally defines a related party transaction as a transaction or series of related transactions or any material amendment to any such transaction of $120,000 or more involving the company and any executive officer of the company, any director or director nominee of the company, persons owning 5% or more of our outstanding stock at the time of the transaction, any immediate family member of any of the foregoing persons, or any entity that is owned or controlled by any of the foregoing persons or in which any such person serves as an executive officer or general partner or, together with all of the foregoing persons, owns 10% or more of the equity interests thereof.
The policy requires our audit committee to review and approve related party transactions and any material amendments to such related party transactions. In reviewing and approving any related party transaction or any material amendment thereto, the audit committee is to (i) satisfy itself that it has been fully informed as to the related party’s relationship and interest and as to the material facts of the proposed related party transaction or the proposed material amendment to such transaction, and (ii) determine that the related party transaction or material amendment thereto is fair to the company. At each audit committee meeting, management is required to recommend any related party transactions and any material amendments thereto, if applicable, to be entered into by us. After review, the audit committee must approve or disapprove such transactions and any material amendments to such transactions.
In addition to the above policy, because we have entered into a number of transactions with affiliates of Pegasus Capital, our board of directors established a Committee of Independent Directors, or the Independent Committee, in December 2008 to consider the approval of, and to make recommendations to the board of directors or any committee thereof regarding, any related-party transactions from time to time between us and Pegasus Capital or its affiliates, our executive officers and/or our directors. During 2008 and 2009, the Independent Committee consisted of Robert E. Bachman, Donald R. Harkleroad and Daryl N. Snadon. Mr. Snadon resigned from the board and all committee positions in March 2010. Charles Darnell was appointed to serve on the Independent Committee in October 2010. Each of the transactions set forth below were reviewed and approved by the Independent Committee.
Transactions with affiliates of Pegasus Capital
Acquisition fees
In connection with our acquisitions of Lighting Science Group B.V., formerly known as Lighting Partner B.V., in April 2008 and Lamina Lighting, Inc. in July 2008, we paid $400,000 and $150,000, respectively, to Pegasus Capital, for expenses incurred in performing certain due diligence and other services.
Series C Preferred Stock issuance
On December 31, 2008, we entered into agreements with two of our law firms whereby we issued a combined total of 251,739 shares of Series C Preferred Stock to such firms to settle their outstanding legal fees in
99
Table of Contents
the aggregate amount of approximately $3,200,000. We also issued warrants (the “Series C Warrants”) for the purchase of 3,776,078 shares of common stock to such firms. The warrants have an exercise price of $0.85 per share, a term of 5 years, and are exercisable only following our dissolution, winding-up or change of control or the repurchase or other acquisition by us of all of the Series C Preferred Stock. These shares and warrants were subsequently transferred to Pegasus IV and Govi Rao, our former Chairman and Chief Executive Officer. Pursuant to the Recapitalization (discussed below) all outstanding shares of Series C Preferred Stock and the Series C Warrants were converted into shares of our common stock.
Guaranty of line of credit with Bank of Montreal
On July 15, 2008, we entered into a Loan Agreement with the Bank of Montreal (“BMO”). Pursuant to the Loan Agreement, Pegasus IV guaranteed our line of credit with BMO (the “Guaranty”). As consideration for providing the initial Guaranty, on July 25, 2008 we issued Pegasus IV a warrant to purchase 942,857 shares of common stock at an exercise price of $7.00 per share and agreed to pay Pegasus IV a transaction fee. In connection with the closing of the line of credit, we also paid Pegasus Capital $100,000 pursuant to a Side Letter Agreement dated July 25, 2008, to reimburse Pegasus Capital for the fees and expenses it incurred with respect to the Guaranty and line of credit.
On August 24, 2009, we amended the Loan Agreement to extend the maturity date (the “Second Amendment”). In conjunction with the Second Amendment, Pegasus IV agreed to extend its Guaranty of the Loan Agreement in exchange for an additional fee, subject to adjustment based upon certain corporate events. On March 15, 2010, we further amended the Loan Agreement (the “Third Amendment”) to increase the size of our revolving line of credit with BMO (the “Loan Increase”). In connection with the Third Amendment, Pegasus IV agreed to increase its Guaranty of our obligations pursuant to the Loan Agreement. In exchange for Pegasus IV’s extension of the Guaranty, we agreed to: (i) further amend the fee payable to Pegasus IV to account for any borrowings made pursuant to the Loan Increase; (ii) use proceeds received from Pegasus IV in connection with its exercise of a Standby Purchase Option (discussed below) to purchase shares of Series D Preferred Stock to reduce the principal amount outstanding under the Loan Agreement; and (iii) enter into a future amendment to the Loan Agreement to reduce the total amount of the Guaranty required and to extend the stated maturity date (the “Fourth Amendment”).
On April 20, 2010, we entered into the Fourth Amendment with BMO and executed that certain Replacement Demand Note (the “Replacement Note”). The Fourth Amendment and the Replacement Note decreased the size of the revolving line of credit with BMO and further extended the maturity date. On the same date and in connection with the Fourth Amendment and the Replacement Note, Pegasus IV executed a consent pursuant to which Pegasus IV acknowledged its Guaranty of our obligations pursuant to the Loan Agreement, as further amended by the Fourth Amendment. In conjunction with the execution of the Fourth Amendment, we issued Pegasus IV 1,555,860 Series D Units in satisfaction of the fees due to Pegasus IV pursuant to the Guaranty, as amended, which totaled $1,565,195, in the aggregate, as of April 20, 2010.
On July 9, 2010, we entered into that certain Fifth Amendment to Bank of Montreal Loan Authorization Agreement (the “Fifth Amendment”) and that certain Replacement Demand Note (the “Replacement Note”) with BMO. The Fifth Amendment and the Second Replacement Note decreased the size of our revolving line of credit with BMO. On the same date and in connection with the Fifth Amendment and the Second Replacement Note, Pegasus IV executed a consent pursuant to which Pegasus IV acknowledged its guaranty of our obligations pursuant to the Loan Agreement, as further amended by the Fifth Amendment. In conjunction with the execution of the Fifth Amendment, we agreed to issue 88,102 Series D Units to Pegasus IV in satisfaction of the accrued portion of the guaranty fee, which totaled $88,630 as of July 9, 2010.
Promissory and convertible notes with Pegasus IV
On December 19, 2008, we borrowed $1.95 million from Pegasus IV and $50,000 from certain of our officers, including Govi Rao and Zachary Gibler. On March 2, 2009, we repaid $7,500 borrowed from one of our
100
Table of Contents
officers, and amended the other outstanding promissory notes to extend the maturity date from March 2, 2009 to July 31, 2009. We subsequently borrowed an additional $9.0 million, in the aggregate, from Pegasus IV pursuant to two separate promissory notes issued on February 13, 2009 and April 17, 2009. All of the notes had an interest rate of 8% per annum. On August 5, 2009, we repaid the remaining principal and interest owed to Govi Rao and Zachary Gibler.
In February 2009, we executed a promissory note in favor of Pegasus IV that allowed us to borrow up to $7.0 million in aggregate. The February promissory note was scheduled to mature on June 30, 2009 and had an interest rate of 8% per annum. As a condition to entering into the February promissory note, we entered into a letter agreement with Pegasus IV, dated February 13, 2009 (the “Letter Agreement”), pursuant to which we agreed to use our best efforts to conduct a rights offering during the second fiscal quarter of 2009 for preferred or common stock, the net proceeds of which would raise at least $30.0 million.
In April 2009, we executed an additional promissory note in favor of Pegasus IV that allowed us to borrow up to $2.0 million in the aggregate. The note was scheduled to mature on May 15, 2009 and had an interest rate of 8% per annum. On May 11, 2009, we borrowed an additional aggregate principal amount of $500,000 from Pegasus IV pursuant to an additional promissory note in favor of Pegasus IV. The note had a maturity date of May 31, 2009 and had an interest rate of 14% per annum. As a condition to entering into these additional promissory notes, we agreed that they would also be subject to the Letter Agreement.
On May 15, 2009, we entered into a Convertible Note Agreement (the “Original Pegasus Convertible Note”) with Pegasus IV, which provided us with approximately $31.7 million. The proceeds of the borrowings on the Original Pegasus Convertible Note were generally used to pay in full $11.5 million worth of promissory notes previously granted to Pegasus IV, together with accrued interest thereon, and to pay outstanding principal amounts under our line of credit with BMO. Effective as of July 31, 2009, we entered into the First Amendment to the Convertible Note Agreement, pursuant to which we extended the maturity date of the Original Pegasus Convertible Note.
On August 27, 2009, the Original Pegasus Convertible Note (as amended) was terminated, and we entered into a new Convertible Note Agreement (the “New Pegasus Convertible Note”) with Pegasus IV in the principal amount of approximately $32.8 million, which represented the outstanding principal and interest on the Original Pegasus Convertible Note as of August 27, 2009. As with the Original Pegasus Convertible Note, interest on the New Pegasus Convertible Note accrued at the rate of 14% per annum. The outstanding principal and interest was scheduled to mature upon the earlier of July 31, 2010 and the date of the consummation of the rights offering (described below).
Pursuant to the New Pegasus Convertible Note, we agreed to use commercially reasonable efforts to conduct a rights offering (the “Rights Offering”) of Series D Units as soon as reasonably practical. The New Pegasus Convertible Note granted Pegasus IV the right to acquire any Series D Units not otherwise subscribed for pursuant to the terms of the Rights Offering (the “Standby Purchase Offering”). If the registration statement for the Rights Offering was declared effective by the SEC and the Rights Offering was consummated prior to July 31, 2010 (the scheduled maturity date), Pegasus IV would be deemed to have converted all of the then outstanding principal and interest under the New Pegasus Convertible Note into Series D Units at a conversion price of $1.006 per Unit. Additionally, the New Pegasus Convertible Note provided Pegasus IV with the option to voluntarily convert all or a portion of the outstanding principal and interest under the New Pegasus Convertible Note into Series D Units at any time at a conversion price of $1.006 per Unit.
Rights offering
Upon consummation of the Rights Offering on March 3, 2010, approximately $35.2 million of the outstanding principal and interest pursuant to the New Pegasus Convertible Note automatically converted into 35,017,667 Series D Units. In addition, on April 19, 2010, we sold 24,097,148 Series D Units to Pegasus IV
101
Table of Contents
pursuant to the Standby Purchase Option. These Units were purchased for $1.006 per Series D Unit. We received $2.0 million from Pegasus IV on February 23, 2010 as an advance payment for a portion of these Series D Units. This advance payment accrued interest at the rate of 14% per annum, and 40,415 of the Series D Units issued to Pegasus IV on April 19, 2010 were in satisfaction of the accrued interest on the advance payment, which totaled $40,657.36.
Series E Preferred offering and Support Services Agreement
On June 23, 2010, we entered into a Subscription Agreement (the “Series E Subscription Agreement”) with Pegasus IV, whereby we agreed to issue and sell to Pegasus IV 235,295 units (the “Series E Units”) at a price per Series E Unit of $127.50, for an aggregate purchase price of $30,000,112.50. Each Series E Unit consisted of: (a) one share of Series E Non-Convertible Preferred Stock, par value $0.001 per share (the “Series E Preferred Stock”) and (b) a warrant (the “Series E Warrant”) representing the right to purchase 50 shares of common stock at a price per share of $7.00, subject to adjustment (collectively, the “Series E Preferred Offering”). Pursuant to the Subscription Agreement, on June 24, 2010, we applied a portion of the proceeds of the Series E Preferred Offering to repay all amounts outstanding under our line of credit with BMO.
Concurrent with the execution of the Series E Subscription Agreement, on June 23, 2010, we entered into a Warrant Agreement with Pegasus IV (the “Series E Warrant Agreement”) setting forth the terms and conditions of the Series E Warrants, whereby Pegasus IV was entitled to purchase shares of common stock upon exercise of the Series E Warrant(s) issued in conjunction with the Series E Preferred Offering. Pursuant to the Series E Preferred Offering, Pegasus IV received Series E Warrant(s) to purchase 11,764,750 shares of common stock in the aggregate.
On June 23, 2010, in conjunction with the execution of the Series E Subscription Agreement and Series E Warrant Agreement, and as an inducement for the Series E Preferred Offering, we entered into a Support Services Agreement, whereby we agreed to pay Pegasus Capital $750,000 as reimbursement for prior financial, strategic planning, monitoring and other related services previously provided by Pegasus Capital, and to pay $187,500 for the four calendar quarters commencing October 15, 2010 and then $125,000 for each of the four calendar quarters thereafter in exchange for such services during such periods.
Stock Purchase, Exchange and Recapitalization Agreement
On September 30, 2010, we entered into a Stock Purchase, Exchange and Recapitalization Agreement (the “Recapitalization Agreement”) with Pegasus IV, LSGC Holdings and LED Holdings. Pursuant to the Recapitalization Agreement, Pegasus IV, LSGC Holdings and LED Holdings agreed to participate in a recapitalization of our existing capital position (the “Recapitalization”) and LSGC Holdings purchased 12,500,000 shares of common stock at a price per share of $1.60, as well as options to purchase up to an additional 3,125,000 shares of common stock at a price per share of $1.60, for an aggregate purchase price of $20,000,000. On October 5, 2010, LSGC Holdings exercised its rights pursuant to the option and acquired 3,125,000 additional shares of common stock for an aggregate purchase price of $5,000,000. In total, we issued 15,625,000 shares of common stock to LSGC Holdings for a total purchase price of $25,000,000.
Pursuant to the Recapitalization Agreement, we exchanged all of our outstanding Series B Preferred Stock, par value $0.001 per share (the “Series B Preferred Stock”), Series C Preferred Stock, par value $0.001 per share (the “Series C Preferred Stock”), Series E Preferred Stock, and Series E Warrants for 32,612,249 shares of common stock. Pursuant to such agreements, the holders of all of the Series C Warrants exercised such warrants, in accordance with their terms, on a cashless basis for 1,937,420 shares of common stock. We also filed a Certificate of Amendment to our Certificate of Incorporation in order to amend the Certificate of Designation concerning our Series D Preferred Stock (the “Series D Certificate”) to provide for the automatic conversion of all shares of Series D Preferred Stock into common stock.
On December 21, 2010, pursuant to the amendment to the Series D Certificate, we issued 44,072,123 shares of common stock in exchange for all 67,260,303 outstanding shares of our Series D Preferred Stock. 39,800,874
102
Table of Contents
shares of common stock were issued to LSGC Holdings pursuant to the automatic conversion of its shares of Series D Preferred Stock.
January 2011 Private Placement
On January 26, 2011, we raised $18.0 million in a private placement pursuant to which we issued 5,454,545 shares of common stock to an affiliate of Pegasus Capital, Michael Kempner, Leon Wagner, certain other operating advisors of Pegasus Capital, and certain trusts affiliated with, and business associates of, Mr. Wagner. The purchase price of the shares of common stock represents a discount of less than 3% of the closing price of our common stock on the date our committee of independent directors approved the private placement. Pegasus IV and two of Pegasus Capital’s operating advisors purchased an aggregate of 3,167,333 shares of common stock for a purchase price of $10,452,200. Michael Kempner, who is also an operating advisor of Pegasus Capital and a director of the company, and Leon Wagner, a director of the company, purchased 60,606 and 634,394 shares of common stock, respectively, for a purchase price of $200,000 and $2,093,500.
Warrant Exchange
On February 9, 2011, we entered into an Exchange Agreement with LSGC Holdings pursuant to which we issued 54,500,000 shares of common stock in exchange for its: (i) Series D Warrant to purchase 60,758,777 shares of common stock and (ii) warrant to purchase 942,857 shares of common stock, which was originally issued to Pegasus IV on July 25, 2008.
Transactions with Koninklijke Philips Electronics N.V.
On August 27, 2009, in conjunction with the Governing Agreement and Complete Releases between, among other parties, us and Philips, we entered into a Convertible Note Agreement (the “Philips Convertible Note”) with Philips pursuant to which we borrowed $5.0 million from Philips. Interest on the outstanding principal balance under the Philips Convertible Note accrued at the rate of 14% per annum. Upon consummation of the Rights Offering on March 3, 2010, approximately $5.4 million of the outstanding principal and interest pursuant to the Philips Convertible Note automatically converted into 5,330,482 Series D Units consisting of (i) one share of Series D Preferred Stock and (ii) Series D Warrants to purchase up to 5,330,482 shares of our common stock at an exercise price of 12.00 per share.
On December 21, 2010, we issued 3,506,538 shares of common stock to Philips pursuant to the automatic conversion of its shares of Series D Preferred Stock.
Relationship with MWW Group
On January 21, 2009, we entered into an agreement with MWW Group LLC, (“MWW”) pursuant to which MWW provides us with certain federal and state government relations, third party support and business development services. On March 24, 2010, Michael W. Kempner, the majority stockholder, president and chief executive officer of MWW, was appointed to serve as a member of our board of directors. The agreement’s initial term expires December 31, 2011, but will renew automatically on a month-to-month basis unless terminated by either party. Pursuant to this agreement, we paid MWW a total of $379,000 and $185,780 during 2010 and 2009, respectively, as compensation for services rendered. During 2011, we are obligated to make additional monthly payments of $30,000, and thereafter, for so long as the agreement remains in effect.
Relationship with The Home Depot
Although our agreement with The Home Depot prohibits us from selling, distributing, rebranding or marketing our LED retrofit lamps and luminaires to certain “big box” retailers, we believe our relationship with The Home Depot and various OEM partners provide us with enhanced access to high volume consumer markets.
103
Table of Contents
We entered into a Strategic Purchasing Agreement with The Home Depot in July 2010 pursuant to which we supply The Home Depot with LED retrofit lamps and fixtures. Our products are currently sold through The Home Depot’s EcoSmart line on a co-branded basis and may be sold through different lines in the future. This agreement has a term of three years but may be terminated by The Home Depot upon 180 days written notice. Although The Home Depot is not required to purchase a committed quantity of products from us, we issued it a Warrant to purchase 5,000,000 shares of our common stock at an exercise price of $2.00 per share, but such shares are subject to annual vesting conditions that require The Home Depot’s gross product orders from us, in dollar terms, to increase by at least 20% year-over-year. In addition, the 1,000,000 shares that would be eligible for vesting in each of the years ending December 31, 2014 and 2015 are also subject to The Home Depot’s extension of the Strategic Purchasing Agreement beyond its initial term. For the year ended December 31, 2010, The Home Depot was one of our largest customers, and we believe sales to The Home Depot during fiscal 2011 will continue to increase.
104
Table of Contents
The following descriptions are summaries of the material terms of our Certificate of Incorporation and Amended and Restated Bylaws. This summary does not purport to be complete and is subject to and qualified by our Certificate of Incorporation and Amended and Restated Bylaws, copies of which have been filed with the SEC, and by the provisions of applicable law.
General
Our authorized capital stock as set forth in our certificate of incorporation consists of 400,000,000 shares of common stock, par value of $0.001 per share, and 100,000,000 shares of preferred stock, par value of $0.001 per share. As of April 12, 2011, 186,452,442 shares of common stock were issued and outstanding and no shares of preferred stock were issued and outstanding.
Common stock
The holders of our common stock are entitled to dividends as our board of directors may declare from funds legally available therefor, subject to the preferential rights of the holders of our preferred stock, if any, and any contractual limitations on our ability to declare and pay dividends. The holders of our common stock are entitled to one vote per share on any matter to be voted upon by stockholders. Our Certificate of Incorporation does not provide for cumulative voting in connection with the election of directors, and accordingly, holders of more than 50% of the shares voting will be able to elect all of the directors. No holder of our common stock will have any preemptive right to subscribe for any shares of capital stock issued in the future.
Upon any voluntary or involuntary liquidation or dissolution, the holders of our common stock are entitled to share ratably in all assets remaining after payment of creditors and subject to prior distribution rights of our preferred stock, if any. All of the outstanding shares of common stock are, and the shares issued or to be issued by us pursuant to the Recapitalization and the Series D Exchange will be, fully paid and non-assessable.
Preferred stock
Our Certificate of Incorporation provides that our board of directors may by resolution establish one or more classes or series of preferred stock having the number of shares and relative voting rights, designation, dividend rates, liquidation, and other rights, preferences, and limitations as may be fixed by them without further stockholder approval. The holders of our preferred stock may be entitled to preferences over common stockholders with respect to dividends, liquidation or dissolution in such amounts as are established by our board of directors’ resolutions issuing such shares.
The issuance of preferred stock may adversely affect the rights of our common stockholders by, among other things:
| • | restricting dividends on the common stock; |
| • | diluting the voting power of the common stock; |
| • | impairing the liquidation rights of the common stock; or |
| • | delaying or preventing a change in control without further action by the stockholders. |
Amended and Restated Equity-Based Compensation Plan
As of April 12, 2011, we had outstanding options to purchase 12,518,324 shares of our common stock and 135,001 outstanding unvested shares of restricted stock under the Equity Plan, and 15,346,675 shares were available for issuance pursuant to the Equity Plan.
105
Table of Contents
2011 Employee Stock Purchase Plan
As of April 12, 2011, no shares of our common stock had been issued pursuant to our 2011 Employee Stock Purchase Plan (the “2011 ESPP”).
Anti-takeover provisions
Certificate of incorporation and bylaws
Our certificate of incorporation and bylaws include a number of provisions that may have the effect of delaying, deferring or preventing another party from acquiring control of us and encouraging persons considering unsolicited tender offers or other unilateral takeover proposals to negotiate with our board of directors rather than pursue non-negotiated takeover attempts. These provisions include the items described below.
Blank check preferred stock. We believe that the availability of the preferred stock under our certificate of incorporation provides us with flexibility in addressing corporate issues that may arise. The existence of authorized but unissued shares of preferred stock may enable our board of directors to render more difficult or to discourage an attempt to obtain control of us by means of a merger, tender offer, proxy contest or otherwise. For example, if in the due exercise of its fiduciary obligations, our board of directors were to determine that a takeover proposal is not in the best interests of our stockholders, our board of directors could cause shares of preferred stock to be issued without stockholder approval in one or more private offerings or other transactions that might dilute the voting or other rights of the proposed acquirer or insurgent stockholder or stockholder group. In this regard, our amended and restated certificate of incorporation grants our board of directors broad power to establish the rights and preferences of authorized and unissued shares of preferred stock. Our board of directors will make any determination to issue shares based on its judgment as to our and our stockholders’ best interests.
Management. Our board of directors has the power to retain and discharge our officers. These provisions could make it more difficult for existing stockholders or another party to effect a change in management.
Special meetings. Our bylaws provide that our chairman of the board, our president, a majority of our board of directors or, upon written request, the holders of at least 50.1% of the total number of our outstanding capital stock, may call a special meeting of stockholders.
No cumulative voting. Under Delaware law, the right to vote cumulatively does not exist unless the certificate of incorporation specifically authorizes cumulative voting. Our amended and restated certificate of incorporation does not grant stockholders the right to vote cumulatively.
Amendment to certificate of incorporation and bylaws. As required by the DGCL, any amendment of our amended and restated certificate of incorporation must first be approved by a majority of our board of directors, and if required by law or our certificate of incorporation, must thereafter be approved by a majority of the outstanding shares entitled to vote on the amendment and a majority of the outstanding shares of each class entitled to vote thereon as a class. Our bylaws may be amended by the affirmative vote of a majority of the directors then in office.
Delaware Anti-Takeover Statute
We are a Delaware corporation and are subject to Section 203 of the DGCL. In general, Section 203 prevents us from engaging in a business combination with an “interested stockholder” (generally, a person owning 15% or more of our outstanding voting stock) for three years following the time that person becomes a 15% stockholder unless either:
| • | before that person became a 15% stockholder, our board of directors approved the transaction in which the stockholder became a 15% stockholder or approved the business combination; |
106
Table of Contents
| • | upon completion of the transaction that resulted in the stockholder’s becoming a 15% stockholder, the stockholder owns at least 85% of our voting stock outstanding at the time the transaction began (excluding stock held by directors who are also officers and by employee stock plans that do not provide employees with the right to determine confidentially whether shares held subject to the plan will be tendered in a tender or exchange offer); or |
| • | after the transaction in which that person became a 15% stockholder, the business combination is approved by our board of directors and authorized at a stockholder meeting by at least two-thirds of the outstanding voting stock not owned by the 15% stockholder. |
Delaware law defines the term “business combination” to encompass a wide variety of transactions with, or caused by, an interested stockholder, including mergers, asset sales and other transactions in which the interested stockholder receives or could receive a benefit on other than a pro rata basis with other stockholders. This law could have an anti-takeover effect with respect to transactions not approved in advance by our board of directors, including discouraging takeover attempts that might result in a premium over the market price for the shares of the common stock.
107
Table of Contents
Shares eligible for future sale
Future sales of substantial amounts of our common stock in the public market, or the perception that such sales may occur, could adversely affect the prevailing market price of our common stock. No prediction can be made as to the effect, if any, future sales of shares, or the availability of shares for future sales, will have on the market price of our common stock prevailing from time to time. The number of shares available for future sale in the public market is subject to legal and contractual restrictions, some of which are described below. The expiration of these restrictions will permit sales of substantial amounts of our common stock in the public market, or could create the perception that these sales may occur, which could adversely affect the prevailing market price of our common stock. These factors could also make it more difficult for us to raise funds through future offerings of common stock.
Sale of outstanding shares
Upon completion of this offering, we will have shares of common stock outstanding. Of these shares of common stock:
| • | the shares of common stock being sold in this offering will be freely tradable without restriction under the Securities Act; |
| • | shares will be freely tradable without restriction under the Securities Act, assuming all shares that are currently traded on the OTC Bulletin Board are freely tradable , and |
| • | shares will be freely tradable upon the expiration of the lock-up agreements described in “Underwriting,” subject to the volume limitations and other restrictions of Rule 144 promulgated under the Securities Act, or Rule 144, described below. |
The remaining shares of common stock that will be outstanding upon completion of this offering will be “restricted securities,” as that phrase is defined in Rule 144, and may be resold only after registration under the Securities Act or pursuant to an exemption from such registration, including, among others, the exemptions provided by Rule 144 under the Securities Act, which is summarized below.
Rule 144
The shares of our common stock being sold in this offering will generally be freely tradable without restriction or further registration under the Securities Act, except that any shares of our common stock held by an “affiliate” of ours may not be resold publicly except in compliance with the registration requirements of the Securities Act or under an exemption under Rule 144 or otherwise. Rule 144 permits our common stock that has been acquired by a person who is an affiliate of ours, or has been an affiliate of ours within the past three months, to be sold into the market in an amount that does not exceed, during any three-month period, the greater of:
| • | 1% of the total number of shares of our common stock outstanding which will equal approximately shares after this offering; or |
| • | the average weekly reported trading volume of our common stock on the OTC Bulletin Board, or the NASDAQ stock market, as applicable, for the four calendar weeks prior to the sale. |
Such sales are also subject to specific manner-of-sale provisions, a six-month holding period requirement for restricted securities, notice requirements and the availability of current public information about us.
Rule 144 also provides that a person who is not deemed to have been an affiliate of ours at any time during the three months preceding a sale, and who has for at least six months beneficially owned shares of our common stock that are restricted securities, will be entitled to freely sell such shares of our common stock subject only to the availability of current public information about us. A person who is not deemed to have been an affiliate of
108
Table of Contents
ours at any time during the three months preceding a sale, and who has for at least one year beneficially owned shares of our common stock that are restricted securities, will be entitled to freely sell such shares of common stock under Rule 144 without regard to the public information requirements of Rule 144.
Stock Plans
We have filed registration statements on Form S-8 under the Securities Act to register shares of our common stock issued or reserved for issuance under the Equity Plan and the 2011 ESPP. Accordingly, shares registered under such registration statements are available for sale in the open market unless such shares are subject to vesting restrictions with us, Rule 144 restrictions applicable to our affiliates or the lock-up restrictions described below. As of April 12, 2011, there were outstanding Equity Plan-based options to purchase 12,518,324 shares of our common stock and 15,346,675 shares available for issuance pursuant to awards under the Equity Plan. As of April 12, 2011, no shares of common stock had been issued pursuant to the 2011 ESPP.
Lock-up agreements
We, all of our directors and executive officers and holders of substantially all of our outstanding stock (other than shares held by public stockholders) and holders of securities exercisable for or convertible into shares of common stock have agreed with the underwriters, subject to specified exceptions, not to dispose of or hedge any of the shares of common stock or securities convertible into or exchangeable for, or that represent the right to receive, shares of common stock during the period from the date of this prospectus continuing through the date that is 180 days after the date of this prospectus, except with the prior written consent of the underwriters. See “Underwriting.”
Registration Rights
We have entered into an Amended and Restated Registration Rights with Pegasus IV, an affiliate of Pegasus Capital (the “Pegasus Registration Rights Agreement”), and an Amended and Restated Registration Rights Agreement with the former stockholders of Lighting Partner B.V. (the “LPBV Registration Rights Agreement”). We do not currently have an obligation to register the shares of common stock held by the former stockholders of Lighting Partner B.V. because such shares are freely tradeable pursuant to Rule 144 and therefore do not constitute “registrable securities,” as such term is defined in the LPBV Registration Rights Agreement. As a result, holders of approximately shares of our common stock will be entitled to rights with respect to registration of those shares under the Securities Act. Under the terms of the Pegasus Registration Rights Agreement, if we propose to register any of our securities under the Securities Act, either for our own account or for the account of other security holders exercising registration rights, Pegasus IV and its affiliates (including LED Holdings and LSGC Holdings) are entitled to notice of registration and are entitled to include their shares of common stock in the registration. The Pegasus Registration Rights Agreement also provides Pegasus IV and its affiliates with specified demand registration rights under which they may require us to file a registration statement under the Securities Act at our expense with respect to our shares of common stock, and we are required to use our commercially reasonable efforts to effect this registration. Further, Pegasus IV and its affiliates may require us to file additional registration statements on Form S-3. These registration rights are subject to conditions and limitations. This is not a complete description of the Pegasus Registration Rights Agreement or the LPBV Registration Rights Agreement and is qualified by the full text of such agreements, which have been filed as exhibits to the registration statement of which this prospectus is a part.
109
Table of Contents
Material U.S. federal income and estate tax considerations for non-U.S. holders
The following is a general discussion of the material U.S. federal income and estate tax consequences of the acquisition, ownership and disposition of our common stock to a non-U.S. holder. Except as specifically provided below, for the purpose of this discussion, a non-U.S. holder is any beneficial owner of our common stock that is not for U.S. federal income tax purposes any of the following:
| • | an individual citizen or resident of the United States; |
| • | a corporation (or other entity treated as a corporation for U.S. federal income tax purposes) created or organized in the United States or under the laws of the United States or any state or the District of Columbia; |
| • | a partnership (or other entity treated as a partnership for U.S. federal income tax purposes); |
| • | an estate whose income is subject to U.S. federal income tax regardless of its source; or |
| • | a trust (x) the administration of which is subject to the primary supervision of a U.S. court and which has one or more U.S. persons who have the authority to control all substantial decisions of the trust or (y) which has made a valid election to be treated as a U.S. person. |
If a partnership (or an entity treated as a partnership for U.S. federal income tax purposes) holds our common stock, the tax treatment of a partner in the partnership will generally depend on the status of the partner and upon the activities of the partnership. Accordingly, we urge partnerships that hold our common stock and partners in such partnerships to consult their own tax advisors regarding the tax treatment of acquiring and holding our common stock.
This discussion assumes that a non-U.S. holder will hold our common stock issued pursuant to the offering as a capital asset (generally, property held for investment). This discussion does not address all aspects of U.S. federal income taxation or any aspects of state, local or non-U.S. taxation, nor does it consider any U.S. federal income tax considerations that may be relevant to non-U.S. holders which may be subject to special treatment under U.S. federal income tax laws, including, without limitation, U.S. expatriates, controlled foreign corporations, passive foreign investment companies, insurance companies, tax-exempt or governmental organizations, dealers in securities or currency, banks or other financial institutions, and investors that hold our common stock as part of a hedge, straddle or conversion transaction. Furthermore, the following discussion is based on current provisions of the Internal Revenue Code of 1986, as amended (the “Code”), and Treasury Regulations and administrative and judicial interpretations thereof, all as in effect on the date hereof, and all of which are subject to change, possibly with retroactive effect.
We urge each prospective investor to consult a tax advisor regarding the U.S. federal, state, local and non-U.S. income and other tax consequences of acquiring, holding and disposing of shares of our common stock.
Dividends
If we pay dividends on our common stock, those payments will constitute dividends for U.S. tax purposes to the extent paid from our current or accumulated earnings and profits, as determined under U.S. federal income tax principles. To the extent those dividends exceed our current and accumulated earnings and profits, the dividends will constitute a return of capital and will first reduce a holder’s adjusted tax basis in its common stock, but not below zero, and then will be treated as gain from the sale of the common stock (see “ — Gain on disposition of common stock).
Any dividend paid out of earnings and profits to a non-U.S. holder of our common stock generally will be subject to U.S. withholding tax either at a rate of 30% of the gross amount of the dividend or such lower rate as may be specified by an applicable tax treaty. To receive the benefit of a reduced treaty rate, a non-U.S. holder generally must provide us (or another relevant withholding agent) with an Internal Revenue Service, or IRS, Form W-8BEN certifying qualification for the reduced rate.
110
Table of Contents
Dividends received by a non-U.S. holder that are effectively connected with a U.S. trade or business conducted by the non-U.S. holder will be exempt from such withholding tax. To obtain this exemption, the non-U.S. holder must provide us (or another relevant withholding agent) with an IRS Form W-8ECI properly certifying such exemption. Such effectively connected dividends, although not subject to withholding tax, generally will be subject to U.S. federal income tax on a net income basis at the same graduated U.S. tax rates generally applicable to U.S. persons, net of certain deductions and credits, subject to any applicable tax treaty providing otherwise. In addition to the income tax described above, dividends received by corporate non-U.S. holders that are effectively connected with a U.S. trade or business of the corporate non-U.S. holder may be subject to a branch profits tax at a rate of 30% or such lower rate as may be specified by an applicable tax treaty.
Gain on disposition of common stock
A non-U.S. holder generally will not be subject to U.S. federal income tax on any gain realized upon the sale or other disposition of our common stock unless:
| • | the gain is effectively connected with a U.S. trade or business of the non-U.S. holder and, if required by an applicable tax treaty, is attributable to a U.S. permanent establishment maintained by such non-U.S. holder; |
| • | the non-U.S. holder is an individual who is present in the United States for a period or periods aggregating 183 days or more during the calendar year in which the sale or disposition occurs and certain other conditions are met; or |
| • | we are or have been a “U.S. real property holding corporation” for U.S. federal income tax purposes and the non-U.S. holder holds or has held, directly or indirectly, at any time within the shorter of the five-year period preceding the disposition or the non-U.S. holder’s holding period, more than 5% of our common stock. Generally, a corporation is a U.S. real property holding corporation if the fair market value of its U.S. real property interests equals or exceeds 50% of the sum of the fair market value of its worldwide real property interests and its other assets used or held for use in a trade or business. If we are or have been a “U.S. real property holding corporation” at any time during the periods described above and our common stock is not regularly traded on an established securities market, then the gain recognized on the sale or other disposition of our common stock by a non-U.S. holder would be subject to U.S. federal income tax regardless of the non-U.S. holder’s ownership percentage. |
In the case of a non-U.S. holder described in the first bullet point immediately above, the gain will be subject to U.S. federal income tax on a net income basis generally in the same manner as if the non-U.S. holder were a U.S. person as defined under the Code (unless an applicable income tax treaty provides otherwise), and a non-U.S. holder that is a foreign corporation may be subject to an additional branch profits tax equal to 30% of its effectively connected earnings and profits attributable to such gain (or at such lower rate as may be specified by an applicable income tax treaty). In the case of an individual non-U.S. holder described in the second bullet point immediately above, except as otherwise provided by an applicable income tax treaty, the gain, which may be offset by certain U.S. source capital losses, will be subject to a flat 30% tax.
We believe we are not and do not anticipate becoming a U.S. real property holding corporation (a “USRPHC”) for U.S. federal income tax purposes. If, however, we are or become a USRPHC, so long as our common stock is considered to be regularly traded on an established securities market, only a non-U.S. holder who actually or constructively holds or held (at any time during the shorter of the five year period ending on the date of disposition or the non-U.S. holder’s holding period) more than 5% of our common stock will be subject to U.S. federal income tax, under the third bullet point immediately above, on the disposition of our common stock. You should consult your own advisor about the consequences that could result if we are, or become, a USRPHC.
111
Table of Contents
Backup withholding and information reporting
Generally, we must report annually to the IRS the amount of dividends paid to each non-U.S. holder, and the amount, if any, of tax withheld with respect to those dividends. A similar report is sent to each non-U.S. holder. These information reporting requirements apply even if withholding was not required. Pursuant to tax treaties or other agreements, the IRS may make its reports available to tax authorities in the recipient’s country of residence.
Payments of dividends to a non-U.S. holder may be subject to backup withholding (at a rate of 28% through 2012) unless the non-U.S. holder establishes an exemption, for example, by properly certifying its non-U.S. status on an IRS Form W-8BEN or another appropriate version of IRS Form W-8. Notwithstanding the foregoing, backup withholding also may apply if we have actual knowledge, or reason to know, that the beneficial owner is a U.S. person that is not an exempt recipient.
Payments of the proceeds from sale or other disposition by a non-U.S. holder of our common stock effected outside the United States by or through a foreign office of a broker generally will not be subject to information reporting or backup withholding. However, information reporting will apply to those payments if the broker does not have documentary evidence that the holder is a non-U.S. holder, an exemption is not otherwise established, and the broker has certain relationships with the United States.
Payments of the proceeds from a sale or other disposition by a non-U.S. holder of our common stock effected by or through a U.S. office of a broker generally will be subject to information reporting and backup withholding (at a rate of 28% through 2012) unless the non-U.S. holder establishes an exemption, for example, by properly certifying its non-U.S. status on an IRS Form W-8BEN or another appropriate version of IRS Form W-8. Notwithstanding the foregoing, information reporting and backup withholding also may apply if the broker has actual knowledge, or reason to know, that the holder is a U.S. person that is not an exempt recipient.
Backup withholding is not an additional tax. Rather, the U.S. income tax liability of persons subject to backup withholding will be reduced by the amount of tax withheld. If withholding results in an overpayment of taxes, a refund may be obtained, provided that the required information is timely furnished to the IRS.
Additional withholding requirements
Under recently enacted legislation, the relevant withholding agent may be required to withhold 30% of any dividends and the proceeds of a sale of our common stock paid after December 31, 2012 to (i) a foreign financial institution (whether holding stock for its own account or on behalf of its account holders/investors) unless such foreign financial institution agrees to verify, report and disclose its U.S. account holders and meets certain other specified requirements or (ii) a non-financial foreign entity that is the beneficial owner of the payment (or who holds stock on behalf of another non-financial foreign entity that is the beneficial owner) unless the beneficial owner certifies that it does not have any substantial U.S. owners or provides the name, address and taxpayer identification number of each substantial U.S. owner and meets certain other specified requirements. Non-U.S. holders should consult their own tax advisors regarding the effect of this newly enacted legislation.
Estate tax
Our common stock owned or treated as owned by an individual who is not a citizen or resident of the U.S. (as specifically defined for U.S. federal estate tax purposes) at the time of death will be includible in the individual’s gross estate for U.S. federal estate tax purposes and may be subject to U.S. federal estate tax unless an applicable estate tax treaty provides otherwise.
112
Table of Contents
Credit Suisse Securities (USA) LLC and J.P. Morgan Securities Inc. are acting as joint book-running managers for this offering and representatives of the underwriters. Stifel, Nicolaus & Company, Incorporated, Moelis & Company LLC and Piper Jaffray & Co. are acting as co-managers for this offering. Under the terms and subject to the conditions contained in an underwriting agreement dated the date of this prospectus, the underwriters named below have severally agreed to purchase, and we have agreed to sell to them, the number of shares of common stock indicated in the table below:
| Underwriters |
Number of Shares |
|||
| Credit Suisse Securities (USA) LLC |
||||
| J.P. Morgan Securities LLC. |
||||
| Stifel, Nicolaus & Company, Incorporated |
||||
| Moelis & Company LLC |
||||
| Piper Jaffray & Co. |
||||
| Total |
||||
The underwriters are offering the shares of common stock subject to their acceptance of the shares from us and subject to prior sale. The underwriting agreement provides that the obligations of the several underwriters to pay for and accept delivery of the shares of common stock offered by this prospectus are subject to the approval of certain legal matters by their counsel and to other conditions. The underwriters are obligated to take and pay for all of the shares of common stock offered by this prospectus if any such shares are taken. However, the underwriters are not required to take or pay for the shares covered by the underwriters’ option to purchase additional shares described below. The underwriters initially propose to offer part of the shares of common stock directly to the public at the public offering price listed on the cover page of this prospectus, less underwriting discounts and commissions, and part to certain dealers at a price that represents a concession not in excess of $ a share under the public offering price. After the initial offering of the shares of common stock, the offering price and other selling terms may from time to time be varied by the representatives.
Option to purchase additional shares
We have granted to the underwriters an option, exercisable for 30 days from the date of this prospectus, to purchase up to an aggregate of additional shares of common stock at the public offering price, less underwriting discounts and commissions. The underwriters may exercise this option solely for the purpose of covering over-allotments, if any, made in connection with the offering of the shares of common stock offered by this prospectus. To the extent the option is exercised, each underwriter will become obligated, subject to certain conditions, to purchase approximately the same percentage of the additional shares of common stock as the number listed next to the underwriter’s name in the preceding table bears to the total number of shares of common stock listed next to the names of all underwriters in the preceding table. If the underwriters’ option to purchase additional shares is exercised in full, the total price to the public would be $ , the total underwriters’ discounts and commissions would be $ and the total proceeds to us would be $ .
Commissions and discounts
The following table shows the per share and total underwriting discounts and commissions that we are to pay to the underwriters in connection with this offering. These amounts are shown assuming both no exercise and full exercise of the underwriters’ option.
| Paid by Us | ||||||||
| No Exercise |
Full Exercise |
|||||||
| Per Share |
$ | $ | ||||||
| Total |
$ | $ | ||||||
113
Table of Contents
In addition, we estimate that the expenses of this offering other than underwriting discounts and commissions payable by us will be approximately $ million.
Public offering price
The public offering price in this offering will be determined by negotiations between us and the representatives of the underwriters. Among the factors to be considered in determining the public offering price will be our future prospects and those of our industry in general; sales, earnings and other financial operating information in recent periods; and the price-earnings ratios, price-sales ratios and market prices of securities and certain financial and operating information of companies engaged in activities similar to ours. The estimated public offering price range set forth on the cover page of this preliminary prospectus is subject to change as a result of market conditions and other factors. An active trading market for the shares may not exist, and it is possible that after the offering the shares will not trade in the market above their offering price.
Discretionary shares
The underwriters have informed us that they do not intend sales to discretionary accounts to exceed 5% of the total number of shares of common stock offered by them.
No sales of similar securities
We, all of our directors and executive officers and holders of substantially all of our outstanding stock (other than shares held by public stockholders) and holders of securities exercisable for or convertible into shares of common stock have agreed that, subject to specified exceptions, without the prior written consent of Credit Suisse Securities (USA) LLC and J.P. Morgan Securities LLC on behalf of the underwriters, we and they will not, during the period beginning on the date of this prospectus and ending 180 days thereafter:
| • | offer, pledge, announce the intention to sell, sell, contract to sell, sell any option or contract to purchase, purchase any option or contract to sell, grant any option, right or warrant to purchase, or otherwise transfer or dispose of, directly or indirectly, any shares of common stock or any securities convertible into or exercisable or exchangeable for common stock; |
| • | enter into any swap or other agreement that transfers, in whole or in part, any of the economic consequences of ownership of common stock; or |
| • | make any demand for or exercise any right with respect to the registration of any shares of common stock or any security convertible into or exercisable or exchangeable for common stock; |
with respect to the first and second bullets above, whether any such transaction is to be settled by delivery of common stock or such other securities, in cash or otherwise.
The restrictions described in the preceding paragraphs are subject to certain exceptions, including that such restrictions do not apply to:
| • | the sale by us of shares to the underwriters in connection with the offering; |
| • | the transfer by our directors, executive officers and other stockholders of shares of common stock as a bona fide gift or gifts; |
| • | distributions of shares of our common stock to members, affiliates or stockholders of our stockholders; |
| • | the exercise of a warrant or an option to purchase shares of our common stock; |
| • | the sale or transfer of shares to us to satisfy payment or withholding obligations in connection with any cashless exercise of warrants or options; |
114
Table of Contents
| • | the conversion or exchange of any warrant, preferred stock or other equity interest into shares of our common stock; or |
| • | the establishment of a trading plan pursuant to Rule 10b5-1 under the Exchange Act (provided that such plan does not provide for the transfer of shares of common stock during the lock-up period and no public announcement or filing under the Exchange Act shall be made during the lock-up period). |
The 180-day restricted period described in the preceding paragraph will be extended if:
| • | during the last 17 days of the 180-day restricted period we issue an earnings release or material news or a material event relating to us occurs; or |
| • | prior to the expiration of the 180-day restricted period, we announce that we will release earnings results during the 16-day period beginning on the last day of the 180-day restricted period, |
in which case the restrictions described in the preceding paragraph will continue to apply until the expiration of the 18-day period beginning on the issuance of the earnings release or the occurrence of the material news or material event.
Price stabilization, short positions and penalty bids
In order to facilitate this offering of common stock, the underwriters may engage in transactions that stabilize, maintain or otherwise affect the price of the common stock. Specifically, the underwriters may sell more shares than they are obligated to purchase under the underwriting agreement, creating a short position. A short sale is covered if the short position is no greater than the number of shares available for purchase by the underwriters under the option to purchase additional shares. The underwriters can close out a covered short sale by exercising the option to purchase additional shares or by purchasing shares in the open market. In determining the source of shares to close out a covered short sale, the underwriters will consider, among other things, the open market price of shares compared to the price available under the option to purchase additional shares. The underwriters may also sell shares in excess of the option to purchase additional shares, creating a naked short position. The underwriters must close out any naked short position by purchasing shares in the open market. A naked short position is more likely to be created if the underwriters are concerned that there may be downward pressure on the price of the common stock in the open market after pricing that could adversely affect investors who purchase in this offering. In addition, to stabilize the price of the common stock, the underwriters may bid for and purchase shares of common stock in the open market. Finally, the underwriting syndicate may reclaim selling concessions allowed to an underwriter or a dealer for distributing the common stock in the offering, if the syndicate repurchases previously distributed common stock to cover syndicate short positions or to stabilize the price of the common stock. These activities may raise or maintain the market price of the common stock above independent market levels or prevent or retard a decline in the market price of the common stock. The underwriters are not required to engage in these activities and may end any of these activities at any time.
Listing on the NASDAQ stock market
We intend to apply to have our common stock approved for listing on the NASDAQ stock market under the symbol “LSGC.”
Indemnification
We and the underwriters have agreed to indemnify each other against certain liabilities, including liabilities under the Securities Act.
Electronic distribution
A prospectus in electronic format may be made available on the Internet sites or through other online services maintained by one or more of the underwriters participating in this offering, or by their affiliates. In
115
Table of Contents
those cases, prospective investors may view offering terms online and, depending upon the particular underwriter, prospective investors may be allowed to place orders online. The underwriters may agree with us to allocate a specific number of shares for sale to online brokerage account holders. Any such allocation for online distributions will be made by the representatives on the same basis as other allocations.
Other than the prospectus in electronic format, the information on any underwriter’s website and any information contained in any other website maintained by an underwriter is not part of the prospectus or the registration statement of which this prospectus forms a part, has not been approved and/or endorsed by us or any underwriter in its capacity as underwriter and should not be relied upon by investors.
Other relationships
Some of the underwriters and their affiliates have engaged in, and may in the future engage in, investment banking and other commercial dealings in the ordinary course of business with us. These underwriters have received customary fees and commissions for these transactions. We and Moelis & Company LLC, a FINRA member and co-managing underwriter for this offering, have entered into an agreement pursuant to which Moelis & Company LLC will act as a financial advisor and capital markets advisor to us in connection with this offering. We have agreed to pay Moelis & Company LLC a fee of $200,000 at the initial closing of this offering for their financial advisor and capital markets services and to reimburse Moelis & Company LLC for all reasonable out-of-pocket accountable expenses including the reasonable out-of-pocket accountable expenses of Moelis & Company LLC’s legal counsel, up to $35,000 in the aggregate and subject to our approval for further expenses incurred. Moelis & Company LLC’s services include assisting us with certain pre-offering preparatory steps to be mutually agreed upon by us and Moelis & Company LLC, assisting us in structuring the offering, meeting with our Board of Directors to discuss this offering and its financial implications, assisting us in discussions with the underwriters regarding this offering and marketing, and providing such other advice and assistance in connection with the offering as may be mutually agreed upon by us and Moelis & Company LLC.
Selling restrictions
The common stock is being offered for sale in those jurisdictions in the United States, the European Union and elsewhere where it is lawful to make such offers.
Notice to prospective investors in the European Economic Area
In relation to each Member State of the European Economic Area (the “EEA”) which has implemented the Prospectus Directive (each, a “Relevant Member State”) an offer to the public of any shares which are the subject of the offering contemplated by this prospectus may not be made in that Relevant Member State, except that an offer to the public in that Relevant Member State of any shares may be made at any time under the following exemptions under the Prospectus Directive, if they have been implemented in that Relevant Member State:
| (a) | to legal entities which are authorized or regulated to operate in the financial markets or, if not so authorized or regulated, whose corporate purpose is solely to invest in securities; |
| (b) | to any legal entity which has two or more of (1) an average of at least 250 employees during the last financial year; (2) a total balance sheet of more than €43,000,000 and (3) an annual net turnover of more than €50,000,000, as shown in its last annual or consolidated accounts; |
| (c) | by the underwriters to fewer than 100 natural or legal persons (other than “qualified investors” as defined in the Prospectus Directive) subject to obtaining the prior consent of the representatives for any such offer; or |
| (d) | in any other circumstances falling within Article 3(2) of the Prospectus Directive; |
provided that no such offer of shares shall result in a requirement for the publication by us or any representative of a prospectus pursuant to Article 3 of the Prospectus Directive.
116
Table of Contents
Any person making or intending to make any offer of shares within the EEA should only do so in circumstances in which no obligation arises for us or any of the underwriters to produce a prospectus for such offer. Neither we nor the underwriters have authorized, nor do they authorize, the making of any offer of shares through any financial intermediary, other than offers made by the underwriters which constitute the final offering of shares contemplated in this prospectus.
For the purposes of this provision, and your representation below, the expression an “offer to the public” in relation to any shares in any Relevant Member State means the communication in any form and by any means of sufficient information on the terms of the offer and any shares to be offered so as to enable an investor to decide to purchase any shares, as the same may be varied in that Relevant Member State by any measure implementing the Prospectus Directive in that Relevant Member State and the expression “Prospectus Directive” means Directive 2003/71/EC and includes any relevant implementing measure in each Relevant Member State.
Each person in a Relevant Member State who receives any communication in respect of, or who acquires any shares under, the offer of shares contemplated by this prospectus will be deemed to have represented, warranted and agreed to and with us and each underwriter that:
| (a) | it is a “qualified investor” within the meaning of the law in that Relevant Member State implementing Article 2(1)(e) of the Prospectus Directive; and |
| (b) | in the case of any shares acquired by it as a financial intermediary, as that term is used in Article 3(2) of the Prospectus Directive, (i) the shares acquired by it in the offering have not been acquired on behalf of, nor have they been acquired with a view to their offer or resale to, persons in any Relevant Member State other than “qualified investors” (as defined in the Prospectus Directive), or in circumstances in which the prior consent of the representatives has been given to the offer or resale; or (ii) where shares have been acquired by it on behalf of persons in any Relevant Member State other than qualified investors, the offer of those shares to it is not treated under the Prospectus Directive as having been made to such persons. |
Notice to prospective investors in the United Kingdom
Each of the underwriters severally represents, warrants and agrees as follows:
| (a) | it has only communicated or caused to be communicated and will only communicate or cause to be communicated an invitation or inducement to engage in investment activity (within the meaning of section 21 of the Financial Services and Markets Act 2000, or the FSMA) to persons who have professional experience in matters relating to investments falling with Article 19(5) of the Financial Services and Markets Act 2000 (Financial Promotion) Order 2005 or in circumstances in which section 21 of FSMA does not apply to us; and |
| (b) | it has complied with, and will comply with all applicable provisions of FSMA with respect to anything done by it in relation to the shares of common stock in, from or otherwise involving the United Kingdom. |
Notice to prospective investors in Switzerland
This document, as well as any other material relating to the shares which are the subject of the offering contemplated by this prospectus, do not constitute an issue prospectus pursuant to Article 652a of the Swiss Code of Obligations. The shares will not be listed on the SWX Swiss Exchange and, therefore, the documents relating to the shares, including, but not limited to, this document, do not claim to comply with the disclosure standards of the listing rules of SWX Swiss Exchange and corresponding prospectus schemes annexed to the listing rules of the SWX Swiss Exchange. The shares are being offered in Switzerland by way of a private placement, i.e. to a small number of selected investors only, without any public offer and only to investors who do not purchase the shares with the intention to distribute them to the public. The investors will be individually approached by us
117
Table of Contents
from time to time. This document, as well as any other material relating to the shares, is personal and confidential and do not constitute an offer to any other person. This document may only be used by those investors to whom it has been handed out in connection with the offering described herein and may neither directly nor indirectly be distributed or made available to other persons without our express consent. It may not be used in connection with any other offer and shall in particular not be copied and/or distributed to the public in (or from) Switzerland.
Notice to prospective investors in the Dubai International Financial Centre
This document relates to an exempt offer in accordance with the Offered Securities Rules of the Dubai Financial Services Authority. This document is intended for distribution only to persons of a type specified in those rules. It must not be delivered to, or relied on by, any other person. The Dubai Financial Services Authority has no responsibility for reviewing or verifying any documents in connection with exempt offers. The Dubai Financial Services Authority has not approved this document nor taken steps to verify the information set out in it, and has no responsibility for it. The shares which are the subject of the offering contemplated by this prospectus may be illiquid and/or subject to restrictions on their resale. Prospective purchasers of the shares offered should conduct their own due diligence on the shares. If you do not understand the contents of this document you should consult an authorised financial adviser.
Notice to prospective investors in Australia
This prospectus is not a formal disclosure document and has not been lodged with the Australian Securities and Investments Commission, or ASIC. It does not purport to contain all information that an investor or their professional advisers would expect to find in a prospectus for the purposes of Chapter 6D.2 of the Australian Corporations Act 2001, or the Act, in relation to the securities or our company.
This prospectus is not an offer to retail investors in Australia generally. Any offer of securities in Australia is made on the condition that the recipient is a “sophisticated investor” within the meaning of section 708(8) of the Act or a “professional investor” within the meaning of section 708(11) of the Act, or on condition that the offer to that recipient can be brought within the exemption for ‘Small-Scale Offerings’ (within the meaning of section 708(1) of the Act). If any recipient does not satisfy the criteria for these exemptions, no applications for securities will be accepted from that recipient. Any offer to a recipient in Australia, and any agreement arising from acceptance of the offer, is personal and may only be accepted by the recipient.
If a recipient on-sells their securities within 12 months of their issue, that person will be required to lodge a disclosure document with ASIC unless either:
| • | the sale is pursuant to an offer received outside Australia or is made to a “sophisticated investor” within the meaning of 708(8) of the Act or a “professional investor” within the meaning of section 708(11) of the Act; or |
| • | it can be established that our company issued, and the recipient subscribed for, the securities without the purpose of the recipient on-selling them or granting, issuing or transferring interests in, or options or warrants over them. |
Notice to prospective investors in Hong Kong
The shares may not be offered or sold by means of any document other than (i) in circumstances which do not constitute an offer to the public within the meaning of the Companies Ordinance (Cap. 32, Laws of Hong Kong), or (ii) to “professional investors” within the meaning of the Securities and Futures Ordinance (Cap. 571, Laws of Hong Kong) and any rules made thereunder, or (iii) in other circumstances which do not result in the document being a “prospectus” within the meaning of the Companies Ordinance (Cap. 32, Laws of Hong Kong) and no advertisement, invitation or document relating to the shares may be issued or may be in the possession of any person for the purpose of the issue (in each case whether in Hong Kong or elsewhere), which is directed at,
118
Table of Contents
or the contents of which are likely to be accessed or read by, the public in Hong Kong (except if permitted to do so under the laws of Hong Kong) other than with respect to shares which are or are intended to be disposed of only to persons outside Hong Kong or only to “professional investors” within the meaning of the Securities and Futures Ordinance (Cap. 571, Laws of Hong Kong) or any rules made thereunder.
Notice to prospective investors in India
This prospectus has not been and will not be registered as a prospectus with the Registrar of Companies in India. This prospectus or any other material relating to these securities may not be circulated or distributed, directly or indirectly, to the public or any members of the public in India. Further, persons into whose possession this prospectus comes are required to inform themselves about and to observe any such restrictions. Each prospective investor is advised to consult its advisors about the particular consequences to it of an investment in these securities. Each prospective investor is also advised that any investment in these securities by it is subject to the regulations prescribed by the Reserve Bank of India and the Foreign Exchange Management Act and any regulations framed thereunder.
Notice to prospective investors in Japan
The securities have not been and will not be registered under the Financial Instruments and Exchange Law of Japan (the Financial Instruments and Exchange Law) and each underwriter has agreed that it will not offer or sell any securities, directly or indirectly, in Japan or to, or for the benefit of, any resident of Japan (which term as used herein means any person resident in Japan, including any corporation or other entity organized under the laws of Japan), or to others for re-offering or resale, directly or indirectly, in Japan or to a resident of Japan, except pursuant to an exemption from the registration requirements of, and otherwise in compliance with, the Financial Instruments and Exchange Law and any other applicable laws, regulations and ministerial guidelines of Japan.
Notice to prospective investors in Korea
Our securities may not be offered, sold and delivered directly or indirectly, or offered or sold to any person for reoffering or resale, directly or indirectly, in Korea or to any resident of Korea except pursuant to the applicable laws and regulations of Korea, including the Securities and Exchange Act and the Foreign Exchange Transaction Law and the decrees and regulations thereunder. Our securities have not been registered with the Financial Supervisory Commission of Korea for public offering in Korea. Furthermore, our securities may not be resold to Korean residents unless the purchaser of our securities complies with all applicable regulatory requirements (including but not limited to government approval requirements under the Foreign Exchange Transaction Law and its subordinate decrees and regulations) in connection with the purchase of our securities.
Notice to prospective investors in Singapore
This prospectus has not been registered as a prospectus with the Monetary Authority of Singapore. Accordingly, this prospectus and any other document or material in connection with the offer or sale, or invitation for subscription or purchase, of the shares may not be circulated or distributed, nor may the shares be offered or sold, or be made the subject of an invitation for subscription or purchase, whether directly or indirectly, to persons in Singapore other than (i) to an institutional investor under Section 274 of the Securities and Futures Act, Chapter 289 of Singapore (the “SFA”), (ii) to a relevant person, or any person pursuant to Section 275 (1A), and in accordance with the conditions, specified in Section 275 of the SFA or (iii) otherwise pursuant to, and in accordance with the conditions of, any other applicable provision of the SFA.
Where the shares are subscribed or purchased under Section 275 by a relevant person which is: (a) a corporation (which is not an accredited investor) the sole business of which is to hold investments and the entire share capital of which is owned by one or more individuals, each of whom is an accredited investor; or (b) a trust
119
Table of Contents
(where the trustee is not an accredited investor) whose sole whole purpose is to hold investments and each beneficiary is an accredited investor, shares, debentures and units of shares and debentures of that corporation or the beneficiaries’ rights and interest in that trust shall not be transferable for six months after that corporation or that trust has acquired the shares under Section 275 except: (i) to an institutional investor under Section 274 of the SFA or to a relevant person, or any person pursuant to Section 275(1A), and in accordance with the conditions, specified in Section 275 of the SFA; (ii) where no consideration is given for the transfer; or (iii) by operation of law.
By accepting this prospectus, the recipient hereof represents and warrants that he is entitled to receive it in accordance with the restrictions set forth above and agrees to be bound by limitations contained herein. Any failure to comply with these limitations may constitute a violation of law.
Notice to prospective investors in Germany
Each person who is in possession of this prospectus is aware of the fact that no German sales prospectus (Verkaufsprospekt) within the meaning of the Securities Sales Prospectus Act, Wertpapier-Verkaufsprospektgesetz, or the Act, of the Federal Republic of Germany has been or will be published with respect to our common stock. In particular, each underwriter has represented that it has not engaged and has agreed that it will not engage in a public offering in (offentliches Angebot) within the meaning of the Act with respect to any of our common stock otherwise than in accordance with the Act and all other applicable legal and regulatory requirements.
Notice to prospective investors in France
The shares of common stock are being issued and sold outside the Republic of France and that, in connection with their initial distribution, it has not offered or sold and will not offer or sell, directly or indirectly, any shares of common stock to the public in the Republic of France, and that it has not distributed and will not distribute or cause to be distributed to the public in the Republic of France this prospectus or any other offering material relating to the shares of common stock, and that such offers, sales and distributions have been and will be made in the Republic of France only to qualified investors (investisseurs qualifiés) in accordance with Article L.411-2 of the Monetary and Financial Code and decrét no. 98-880 dated 1st October, 1998.
Notice to prospective investors in The Netherlands
Our common stock may not be offered, sold, transferred or delivered in or from The Netherlands as part of their initial distribution or at any time thereafter, directly or indirectly, other than to, individuals or legal entities situated in The Netherlands who or which trade or invest in securities in the conduct of a business or profession (which includes banks, securities intermediaries (including dealers and brokers), insurance companies, pension funds, collective investment institution, central governments, large international and supranational organizations, other institutional investors and other parties, including treasury departments of commercial enterprises, which as an ancillary activity regularly invest in securities (hereinafter, the Professional Investors), provided that in the offer, prospectus and in any other documents or advertisements in which a forthcoming offering of our common stock is publicly announced (whether electronically or otherwise) in The Netherlands it is stated that such offer is and will be exclusively made to such Professional Investors. Individual or legal entities who are not Professional Investors may not participate in the offering of our common stock, and this prospectus or any other offering material relating to our common stock may not be considered an offer or the prospect of an offer to sell or exchange our common stock.
Notice to prospective investors in Italy
No prospectus has or will be registered in the Republic of Italy with the Italian Stock Exchange Commission (Commissione Nazionale per le Societá di Borsa), or Consob, pursuant to the Prospectus Directive and Italian
120
Table of Contents
laws and regulations on financial products. Accordingly, the common stock may not be offered, sold or delivered in the Republic of Italy, and copies of this prospectus or any other document relating to the common stock may not be distributed in the Republic of Italy, except to (a) qualified investors (investori qualificati), or the Qualified Investors, pursuant to Article 100 of Legislative Decree no. 58 dated February 24, 1998, as amended, or the Financial Act, as defined in Article 34-ter of Consob Regulation no. 11971 dated May 14. 1999, as amended, Regulation no. 11971; or (b) in circumstances where there is an exemption from the rules governing an offer to the public of financial products pursuant to Article 94 et seq. of the Financial Act, and to Regulation no. 11971. Any offer, sale or delivery of the common stock in the Republic of Italy must be (a) made by an investment firm, a bank or financial intermediary authorized to engage in such activities in Italy, in compliance with the Financial Act and with Legislative Decree no. 385 dated September 1, 1993, as amended and Consob Regulation no. 16190 dated October 29, 2007, as amended, and any other applicable law and regulation; and (b) in compliance with any applicable Italian laws and regulations and any other condition or limitation that may be imposed by Consob, the Bank of Italy (Banca d’Italia) and any other relevant Italian authorities.
The validity of the common stock offered hereby will be passed upon for us by Haynes and Boone, LLP, Dallas, Texas. The underwriters are represented by Latham & Watkins LLP, New York, New York, in connection with certain legal matters related to this offering.
The consolidated financial statements as of December 31, 2010 and 2009 and for each of the three years in the period ended December 31, 2010 included in this prospectus have been audited by McGladrey & Pullen, LLP, an independent registered public accounting firm, and have been included in reliance upon the report of such firm included herein given on said firm’s authority as an expert in accounting and auditing.
Where you can find more information
We have filed with the SEC a registration statement on Form S-1 under the Securities Act with respect to the securities offered by this prospectus. This prospectus, which constitutes part of the registration statement, does not include all the information contained in the registration statement and the exhibits, schedules and amendments to the registration statement. Some items are omitted in accordance with the rules and regulations of the SEC. For further information with respect to us and our common stock, we refer you to the registration statement and to the exhibits and schedules to the registration statement filed as part of the registration statement. Statements contained in this prospectus about the contents of any contract or other document filed as an exhibit are not necessarily complete, and, in each instance, we refer you to the copy of the contract or other documents filed as an exhibit to the registration statement. Each of these statements is qualified in all respects by this reference.
We also file annual, quarterly and current reports, proxy statements and other information with the SEC. Such reports, proxy statements and other information, as well as the registration statement and the exhibits thereto, may be read and copied at the Securities and Exchange Commission’s Public Reference Room at 100 F Street, N.E., Room 1580, Washington, D.C. 20549, on official business days during the hours of 10 a.m. to 3 p.m. The public may obtain information on the operation of the Public Reference Room by calling the SEC at 1-800-SEC-0330. The SEC also maintains a website at www.sec.gov that contains reports, proxy and information statements, and other information regarding issuers, such as us, that file electronically with the SEC. More information about us can be found on our website at www.lsgc.com. These references to the SEC’s website and our website are inactive textual references only and are not hyperlinks. The contents of our website are not part of this prospectus, and you should not consider the contents of our website in making an investment decision with respect to our common stock.
121
Table of Contents
Index to consolidated financial statements
| Lighting Science Group Corporation Audited Financial Statements |
||||
| Report of Independent Registered Public Accounting Firm—McGladrey & Pullen, LLP |
F-2 | |||
| Consolidated Balance Sheets as of December 31, 2010 and 2009 |
F-3 | |||
| F-4 | ||||
| F-5 | ||||
| Consolidated Statements of Cash Flows for the Years Ended December 31, 2010, 2009 and 2008 |
F-6 | |||
| F-7 | ||||
F-1
Table of Contents
Report of Independent Registered Public Accounting Firm
To the Board of Directors and Stockholders
Lighting Science Group Corporation
We have audited the accompanying consolidated balance sheets of Lighting Science Group Corporation and Subsidiaries as of December 31, 2010 and 2009, and the related consolidated statements of operations and comprehensive loss, stockholders’ equity (deficit), and cash flows for each of the three years in the period ended December 31, 2010. These financial statements are the responsibility of the Company’s management. Our responsibility is to express an opinion on these financial statements based on our audits.
We conducted our audits in accordance with the standards of the Public Company Accounting Oversight Board (United States). Those standards require that we plan and perform the audit to obtain reasonable assurance about whether the financial statements are free of material misstatement. The Company is not required to have, nor were we engaged to perform an audit of its internal control over financial reporting. Our audit included consideration of internal control over financial reporting as a basis for designing audit procedures that are appropriate in the circumstances, but not for the purpose of expressing an opinion on the effectiveness of the Company’s internal control over financial reporting. Accordingly, we express no such opinion. An audit also includes examining, on a test basis, evidence supporting the amounts and disclosures in the financial statements, assessing the accounting principles used and significant estimates made by management, as well as evaluating the overall financial statement presentation. We believe that our audits provide a reasonable basis for our opinion.
In our opinion, the consolidated financial statements referred to above present fairly, in all material respects, the financial position of Lighting Science Group Corporation and Subsidiaries as of December 31, 2010 and 2009, and the results of their operations and their cash flows for each of the three years in the period ended December 31, 2010, in conformity with U.S. generally accepted accounting principles.
/s/ McGladrey & Pullen, LLP
Orlando, FL
April 1, 2011
F-2
Table of Contents
LIGHTING SCIENCE GROUP CORPORATION AND SUBSIDIARIES
CONSOLIDATED BALANCE SHEETS
| As of December 31, | ||||||||
| 2010 | 2009 | |||||||
| Assets | ||||||||
| Current assets: |
||||||||
| Cash and cash equivalents |
$ | 14,489,700 | $ | 267,048 | ||||
| Accounts receivable, net of allowance for doubtful accounts |
15,722,762 | 5,020,226 | ||||||
| Inventories, net of allowances |
23,046,912 | 8,064,624 | ||||||
| Deferred income tax, net |
— | 682,227 | ||||||
| Prepaid expenses |
5,239,663 | 1,220,445 | ||||||
| Other current assets |
485,236 | 251,573 | ||||||
| Total current assets |
58,984,273 | 15,506,143 | ||||||
| Property and equipment, net |
7,830,341 | 3,291,296 | ||||||
| Other assets |
||||||||
| Intangible assets, net |
3,952,927 | 13,482,736 | ||||||
| Goodwill |
1,626,482 | 5,770,245 | ||||||
| Other long-term assets |
99,340 | 418,394 | ||||||
| Total other assets |
5,678,749 | 19,671,375 | ||||||
| Total assets |
$ | 72,493,363 | $ | 38,468,814 | ||||
| Liabilities, Redeemable Convertible Preferred Stock and Stockholders’ Equity (Deficit) |
||||||||
| Current liabilities: |
||||||||
| Short-term debt (includes $0 and $32,846,619 of related party loans in 2010 and 2009, respectively) |
$ | 6,075,679 | $ | 56,400,173 | ||||
| Current portion of long-term debt |
93,193 | 110,322 | ||||||
| Accounts payable |
37,236,525 | 7,496,633 | ||||||
| Accrued expenses |
4,267,944 | 6,190,129 | ||||||
| Unearned revenue |
132,010 | 12,631 | ||||||
| Total current liabilities |
47,805,351 | 70,209,888 | ||||||
| Long-term debt, less current portion |
6,501 | 117,447 | ||||||
| Deferred income tax |
— | 1,805,334 | ||||||
| Total other liabilities |
6,501 | 1,922,781 | ||||||
| Total liabilities |
47,811,852 | 72,132,669 | ||||||
| Commitments and contingencies |
||||||||
| 6% Redeemable, Convertible Preferred Stock, $.001 par value, authorized 2,656,250 shares, issued and outstanding 196,902 shares in 2009. Liquidation value of $630,086 in 2009. |
— | 585,549 | ||||||
| Stockholders’ equity (deficit): |
||||||||
| Series B Preferred Stock, $.001 par value, authorized, issued and outstanding 2,000,000 shares in 2009. Liquidation value $17,127,642 in 2009. |
— | 2,000 | ||||||
| Series C Preferred Stock, $.001 par value, authorized, issued and outstanding 251,739 shares in 2009. Liquidation value $3,476,066 in 2009. |
— | 252 | ||||||
| Common stock, $.001 par value, authorized 400,000,000 shares, issued and outstanding 125,595,418 and 29,873,846 shares in 2010 and 2009, respectively. |
125,595 | 29,874 | ||||||
| Additional paid-in-capital |
471,255,918 | 116,447,080 | ||||||
| Accumulated deficit |
(443,141,591 | ) | (148,002,652 | ) | ||||
| Accumulated other comprehensive loss |
(3,558,411 | ) | (2,725,958 | ) | ||||
| Total stockholders’ equity (deficit) |
24,681,511 | (34,249,404 | ) | |||||
| Total liabilities, redeemable convertible preferred stock and stockholders’ equity (deficit) |
$ | 72,493,363 | $ | 38,468,814 | ||||
The accompanying notes are an integral part of the consolidated financial statements.
F-3
Table of Contents
LIGHTING SCIENCE GROUP CORPORATION AND SUBSIDIARIES
CONSOLIDATED STATEMENTS OF OPERATIONS
AND COMPREHENSIVE LOSS
| For the Years Ended December 31, | ||||||||||||
| 2010 | 2009 | 2008 | ||||||||||
| Revenue |
$ | 53,169,013 | $ | 31,376,816 | $ | 20,758,593 | ||||||
| Cost of goods sold |
59,021,851 | 24,754,819 | 16,688,600 | |||||||||
| Gross margin (deficit) |
(5,852,838 | ) | 6,621,997 | 4,069,993 | ||||||||
| Operating expenses: |
||||||||||||
| Sales and marketing (includes related party expenses of $379,000 for 2010) |
11,107,379 | 7,200,323 | 5,847,833 | |||||||||
| Operations |
4,834,592 | 8,165,066 | 6,453,867 | |||||||||
| Research and development |
10,246,511 | 6,600,352 | 7,332,296 | |||||||||
| General and administrative (includes related party expenses of $1.1 million for 2010 and $400,000 for 2008) |
17,753,656 | 20,753,513 | 23,224,561 | |||||||||
| Restructuring expenses |
1,101,992 | 1,111,189 | — | |||||||||
| Impairment of goodwill and other long-lived assets |
11,548,650 | — | 53,110,133 | |||||||||
| Depreciation and amortization |
2,867,866 | 5,327,033 | 4,354,028 | |||||||||
| Total operating expenses |
59,460,646 | 49,157,476 | 100,322,718 | |||||||||
| Loss from operations |
(65,313,484 | ) | (42,535,479 | ) | (96,252,725 | ) | ||||||
| Other income (expense): |
||||||||||||
| Interest income |
3,450 | 1,104 | 188,460 | |||||||||
| Interest expense |
(616,545 | ) | (2,378,544 | ) | (1,365,295 | ) | ||||||
| Related party interest expense |
(2,884,511 | ) | (3,680,149 | ) | (60,151 | ) | ||||||
| (Increase) decrease in fair value of liabilities under derivative contracts |
(150,557,529 | ) | 2,731 | 415,628 | ||||||||
| Dividends on preferred stock |
(3,534,795 | ) | (37,356 | ) | (533 | ) | ||||||
| Accretion of preferred stock |
(73,077,280 | ) | (126,017 | ) | (94,607 | ) | ||||||
| Other income (expense), net |
(281,352 | ) | 203,781 | (1,740 | ) | |||||||
| Total other expense |
(230,948,562 | ) | (6,014,450 | ) | (918,238 | ) | ||||||
| Loss before income tax benefit |
(296,262,046 | ) | (48,549,929 | ) | (97,170,963 | ) | ||||||
| Income tax benefit |
(1,123,107 | ) | (413,002 | ) | (2,207,507 | ) | ||||||
| Net loss |
(295,138,939 | ) | (48,136,927 | ) | (94,963,456 | ) | ||||||
| Dividend requirements |
||||||||||||
| 6% return on Series B Preferred Stock |
784,142 | 1,217,642 | — | |||||||||
| 8% return on Series C Preferred Stock |
213,610 | 266,400 | — | |||||||||
| Net loss attributable to common stock |
$ | (296,136,691 | ) | $ | (49,620,969 | ) | $ | (94,963,456 | ) | |||
| Basic and diluted net loss per weighted average common share |
$ | (6.69 | ) | $ | (1.69 | ) | $ | (3.55 | ) | |||
| Basic and diluted weighted average number of common shares outstanding |
44,274,077 | 29,352,585 | 26,781,431 | |||||||||
| Net loss |
$ | (295,138,939 | ) | $ | (48,136,927 | ) | $ | (94,963,456 | ) | |||
| Foreign currency translation loss |
(912,296 | ) | (849,695 | ) | (1,886,544 | ) | ||||||
| Comprehensive loss |
$ | (296,051,235 | ) | $ | (48,986,622 | ) | $ | (96,850,000 | ) | |||
The accompanying notes are an integral part of the consolidated financial statements.
F-4
Table of Contents
LIGHTING SCIENCE GROUP CORPORATION AND SUBSIDIARIES
CONSOLIDATED STATEMENTS OF STOCKHOLDERS’ EQUITY (DEFICIT)
| Series B Preferred Stock |
Series C Preferred Stock |
Common Stock | Additional Paid In Capital |
Accumulated Deficit |
Accumulated Other Comprehensive Income (Loss) |
Total | ||||||||||||||||||||||||||||||||||
| Shares | Amount | Shares | Amount | Shares | Amount | |||||||||||||||||||||||||||||||||||
| Balance at December 31, 2007 |
2,000,000 | $ | 2,000 | — | $ | — | 21,958,482 | $ | 21,959 | $ | 71,056,282 | $ | (4,902,269 | ) | $ | 10,281 | $ | 66,188,253 | ||||||||||||||||||||||
| Sale of common stock to related party |
— | — | — | — | 2,083,333 | 2,083 | 9,997,917 | — | — | 10,000,000 | ||||||||||||||||||||||||||||||
| Common stock issued for acquisition of Lighting Science Group BV |
— | — | — | — | 4,632,000 | 4,632 | 22,228,968 | — | — | 22,233,600 | ||||||||||||||||||||||||||||||
| Preferred stock issued for payment of operating expenses |
— | — | 251,739 | 252 | — | — | 3,209,414 | — | — | 3,209,666 | ||||||||||||||||||||||||||||||
| Stock based compensation expense |
— | — | — | — | 62,500 | 63 | 2,712,624 | — | — | 2,712,687 | ||||||||||||||||||||||||||||||
| Fair value of warrants issued in connection with debt guaranty |
— | — | — | — | — | — | 1,476,464 | — | — | 1,476,464 | ||||||||||||||||||||||||||||||
| Common stock issued upon exercise of warrants |
— | — | — | — | 101,391 | 101 | 693,425 | — | — | 693,526 | ||||||||||||||||||||||||||||||
| Director and other compensation paid in common stock |
— | — | — | — | 138,191 | 138 | 639,862 | — | — | 640,000 | ||||||||||||||||||||||||||||||
| Fair value of derivatives exercised or converted |
— | — | — | — | 10,000 | 10 | 492,447 | — | — | 492,457 | ||||||||||||||||||||||||||||||
| Repurchase of common stock pursuant to reverse stock split |
— | — | — | — | — | — | (1,796 | ) | — | — | (1,796 | ) | ||||||||||||||||||||||||||||
| Net loss |
— | — | — | — | — | — | — | (94,963,456 | ) | — | (94,963,456 | ) | ||||||||||||||||||||||||||||
| Foreign currency translation adjustment, net |
— | — | — | — | — | — | — | — | (1,886,544 | ) | (1,886,544 | ) | ||||||||||||||||||||||||||||
| Balance December 31, 2008 |
2,000,000 | $ | 2,000 | 251,739 | $ | 252 | 28,985,897 | $ | 28,986 | $ | 112,505,607 | $ | (99,865,725 | ) | $ | (1,876,263 | ) | $ | 10,794,857 | |||||||||||||||||||||
| Director compensation paid in common stock |
— | — | — | 817,341 | 817 | 559,183 | — | — | 560,000 | |||||||||||||||||||||||||||||||
| Stock based compensation expense |
— | — | — | — | 62,500 | 63 | 3,376,319 | — | — | 3,376,382 | ||||||||||||||||||||||||||||||
| Stock issued per 2008 Employee Stock Purchase Plan |
— | — | — | — | 8,108 | 8 | 5,971 | — | — | 5,979 | ||||||||||||||||||||||||||||||
| Net loss |
— | — | — | — | — | — | — | (48,136,927 | ) | — | (48,136,927 | ) | ||||||||||||||||||||||||||||
| Foreign currency translation adjustment |
— | — | — | — | — | — | — | — | (849,695 | ) | (849,695 | ) | ||||||||||||||||||||||||||||
| Balance December 31, 2009 |
2,000,000 | $ | 2,000 | 251,739 | $ | 252 | 29,873,846 | $ | 29,874 | $ | 116,447,080 | $ | (148,002,652 | ) | $ | (2,725,958 | ) | $ | (34,249,404 | ) | ||||||||||||||||||||
| Director compensation paid in common stock |
— | — | — | — | 807,070 | 807 | 785,016 | — | — | 785,823 | ||||||||||||||||||||||||||||||
| Stock issued for settlement of service fees |
— | — | — | — | 66,000 | 67 | 144,311 | — | — | 144,378 | ||||||||||||||||||||||||||||||
| Stock based compensation expense |
— | — | — | — | — | — | 3,837,757 | — | — | 3,837,757 | ||||||||||||||||||||||||||||||
| Stock issued for vested restricted stock |
— | — | — | — | 237,498 | 237 | (237 | ) | — | — | — | |||||||||||||||||||||||||||||
| Stock issued per 2008 Employee Stock Purchase Plan |
— | — | — | — | 6,047 | 6 | 10,387 | — | — | 10,393 | ||||||||||||||||||||||||||||||
| Stock issued per exercise of stock options |
— | — | — | — | 358,165 | 358 | 351,806 | — | — | 352,164 | ||||||||||||||||||||||||||||||
| Sale of common stock per Purchase Agreement |
— | — | — | — | 15,625,000 | 15,625 | 24,984,375 | — | — | 25,000,000 | ||||||||||||||||||||||||||||||
| Exchange of Series B Preferred Stock, Series C Preferred Stock and Series E Units for common stock |
(2,000,000 | ) | (2,000 | ) | (251,739 | ) | (252 | ) | 32,612,249 | 32,612 | 49,718,433 | — | — | 49,748,793 | ||||||||||||||||||||||||||
| Exchange of Series C Warrants for common stock |
— | — | — | — | 1,937,420 | 1,937 | (1,937 | ) | — | — | — | |||||||||||||||||||||||||||||
| Exchange of Series D Preferred Stock for common stock |
— | — | — | — | 44,072,123 | 44,072 | 88,790,464 | — | — | 88,834,536 | ||||||||||||||||||||||||||||||
| Reclassification of Series D Warrants to equity |
— | — | — | — | — | — | 186,188,463 | — | — | 186,188,463 | ||||||||||||||||||||||||||||||
| Net loss |
— | — | — | — | — | — | — | (295,138,939 | ) | — | (295,138,939 | ) | ||||||||||||||||||||||||||||
| Foreign currency translation adjustment, net |
— | — | — | — | — | — | — | — | (832,453 | ) | (832,453 | ) | ||||||||||||||||||||||||||||
| Balance December 31, 2010 |
— | $ | — | — | $ | — | 125,595,418 | $ | 125,595 | $ | 471,255,918 | $ | (443,141,591 | ) | $ | (3,558,411 | ) | $ | 24,681,511 | |||||||||||||||||||||
The accompanying notes are an integral part of the consolidated financial statements.
F-5
Table of Contents
LIGHTING SCIENCE GROUP CORPORATION AND SUBSIDIARIES
CONSOLIDATED STATEMENTS OF CASH FLOWS
| For the Years Ended December 31, | ||||||||||||
| 2010 | 2009 | 2008 | ||||||||||
| Cash flows from operating activities: |
||||||||||||
| Net loss |
$ | (295,138,939 | ) | $ | (48,136,927 | ) | $ | (94,963,456 | ) | |||
| Adjustments to reconcile net loss to net cash used in operating activities: |
||||||||||||
| Depreciation and amortization |
2,867,866 | 5,327,033 | 4,354,028 | |||||||||
| Impairment of goodwill and other long-lived assets |
11,548,650 | — | 53,110,133 | |||||||||
| Expenses paid by issuance of common stock and warrants |
930,202 | 560,000 | 5,326,130 | |||||||||
| Non-cash stock option and restricted stock compensation expense |
3,837,757 | 3,376,382 | 2,712,687 | |||||||||
| Accretion of preferred stock redemption value |
73,077,280 | 126,017 | 94,607 | |||||||||
| Increase (decrease) in fair value of warrants |
150,557,529 | 2,731 | (415,628 | ) | ||||||||
| Dividends on preferred stock |
3,534,795 | — | — | |||||||||
| Loss on disposal of assets |
1,198,846 | 143,846 | — | |||||||||
| Deferred income tax |
(1,123,107 | ) | (413,002 | ) | (2,207,507 | ) | ||||||
| Changes in operating assets and liabilities: |
||||||||||||
| Accounts receivable |
(10,663,159 | ) | 1,613,662 | 258,754 | ||||||||
| Inventories |
(14,565,642 | ) | 4,074,095 | 320,766 | ||||||||
| Prepaid expenses |
(4,016,820 | ) | 297,245 | 865,179 | ||||||||
| Other current and long term assets |
754,480 | (280,854 | ) | — | ||||||||
| Accounts payable |
29,222,471 | 1,077,385 | 1,123,060 | |||||||||
| Accrued expenses and other liabilities |
2,467,808 | 2,062,131 | (373,358 | ) | ||||||||
| Unearned revenue |
119,379 | (989,073 | ) | 1,001,704 | ||||||||
| Net cash used in operating activities |
(45,390,604 | ) | (31,159,329 | ) | (28,792,901 | ) | ||||||
| Cash flows from investing activities: |
||||||||||||
| Purchase of property and equipment |
(6,651,591 | ) | (1,111,656 | ) | (1,671,303 | ) | ||||||
| Proceeds from sale of property and equipment |
54,500 | — | — | |||||||||
| Acquisition of Lighting Science Group B.V. |
— | — | (6,190,000 | ) | ||||||||
| Acquisition of Lamina Lighting , Inc. |
— | — | (4,763,383 | ) | ||||||||
| Net cash used in investing activities |
(6,597,091 | ) | (1,111,656 | ) | (12,624,686 | ) | ||||||
| Cash flows from financing activities: |
||||||||||||
| Proceeds from draws on lines of credit and other short-term borrowings |
29,545,062 | 29,550,000 | 21,073,243 | |||||||||
| Payment of amounts due under line of credit and other short-term borrowings |
(41,250,261 | ) | (31,950,000 | ) | — | |||||||
| Proceeds from issuance of promissory notes |
— | 35,896,619 | — | |||||||||
| Payment of amounts due under promissory notes |
— | (50,000 | ) | — | ||||||||
| Payment of short and long-term debt |
(2,101,423 | ) | (1,436,335 | ) | (1,038,709 | ) | ||||||
| Proceeds from issuance of common stock for ESPP and exercise of options |
362,557 | 5,979 | — | |||||||||
| Redemption of 6% Convertible Preferred Stock |
(596,890 | ) | — | — | ||||||||
| Payment of 6% Convertible Preferred Stock dividends |
(17,116 | ) | (37,889 | ) | — | |||||||
| Proceeds from issuance of mandatorily redeemable Series D Preferred Stock |
25,379,144 | — | — | |||||||||
| Proceeds from issuance of mandatorily redeemable Series E Preferred Stock |
30,000,112 | — | — | |||||||||
| Proceeds from issuance of common stock per Purchase Agreement |
25,000,000 | — | — | |||||||||
| Repurchase of common stock pursuant to reverse stock split |
— | — | (1,796 | ) | ||||||||
| Proceeds form exercise of common stock warrants |
— | — | 693,526 | |||||||||
| Proceeds from private placement of common stock |
— | — | 10,000,000 | |||||||||
| Net cash provided by financing activities |
66,321,185 | 31,978,374 | 30,726,264 | |||||||||
| Effect of exchange rate fluctuations on cash |
(110,838 | ) | 305,121 | (453,568 | ) | |||||||
| Net increase in cash and cash equivalents |
14,222,652 | 12,510 | (11,144,891 | ) | ||||||||
| Cash and cash equivalents balance at beginning of period |
267,048 | 254,538 | 11,399,429 | |||||||||
| Cash and cash equivalents balance at end of period |
$ | 14,489,700 | $ | 267,048 | $ | 254,538 | ||||||
| Supplemental disclosures: |
||||||||||||
| Interest paid during the period |
$ | 565,786 | $ | 1,222,439 | $ | 468,088 | ||||||
| Income taxes paid during the period |
$ | — | $ | — | $ | — | ||||||
| Non-cash investing and financing activities: |
||||||||||||
| Conversion of notes payable and accrued interest to Series D Units |
$ | 40,590,248 | $ | — | $ | — | ||||||
| Conversion of accrued guaranty fees and interest to Series D Units |
$ | 1,694,482 | $ | — | $ | — | ||||||
| Conversion of Series E Units to common stock |
$ | 49,748,792 | $ | — | $ | — | ||||||
| Conversion of Series D Preferred Stock to common stock |
$ | 275,022,999 | $ | — | $ | — | ||||||
| Value of common stock issued in connection with acquisition of Lighting Science Group BV |
$ | — | $ | — | $ | 22,233,600 | ||||||
The accompanying notes are an integral part of the consolidated financial statements.
F-6
Table of Contents
LIGHTING SCIENCE GROUP CORPORATION AND SUBSIDIARIES
NOTES TO THE CONSOLIDATED FINANCIAL STATEMENTS
Note 1: DESCRIPTION OF BUSINESS AND BASIS OF PRESENTATION
Overview
Lighting Science Group Corporation (the “Company”) was incorporated in Delaware in 1988 and it designs, develops, manufactures and markets general illumination products that exclusively use light emitting diodes (“LEDs”) as their light source. The Company’s product portfolio includes LED-based retrofit lamps (replacement bulbs) that can be used in existing light fixtures and sockets as well as purpose built LED-based luminaires (light fixtures) for many common indoor and outdoor residential, commercial, industrial and public infrastructure lighting applications. The Company assembles and manufactures its products both internally and through its contract manufacturer in Asia.
Basis of Financial Statement Presentation
The accompanying consolidated financial statements have been prepared in accordance with accounting principles generally accepted in the United States and the rules of the Securities Exchange Commission (“SEC”). The consolidated financial statements include the accounts of the Company and its wholly-owned subsidiaries. All significant intercompany accounts and transactions have been eliminated in the accompanying consolidated financial statements.
Note 2: SUMMARY OF SIGNIFICANT ACCOUNTING POLICIES
Use of Estimates
The preparation of financial statements in conformity with generally accepted accounting principles requires management to make estimates and assumptions that affect the reported amounts of assets and liabilities and disclosure of contingent assets and liabilities at the dates of the financial statements and the reported amounts of revenue and expenses during the reporting periods. Actual results could differ from these estimates.
Foreign Currency Translation
The functional currency for the foreign operations of the Company is the local currency of the respective foreign subsidiary. For Lighting Science Group B.V. (“LSGBV”), the Company’s Netherlands based operation, the functional currency is the Euro. The translation of foreign currencies into U.S. dollars is performed for balance sheet accounts using exchange rates in effect at the balance sheet dates and for revenue and expense accounts using the average exchange rate for each period during the year. Any gains or losses resulting from the translation are included in accumulated other comprehensive loss in the consolidated statements of stockholders’ equity (deficit) and are excluded from net loss.
Cash and Cash Equivalents
The Company considers all highly liquid investments with original maturities of three months or less at the date of purchase to be cash equivalents. As of December 31, 2010 and 2009, the Company had $286,000 and $0, respectively, in cash equivalents. The Company regularly maintains cash balances in excess of federally insured limits. To date, the Company has not experienced any losses on its cash and cash equivalents. As of December 31, 2010, the Company had $14.5 million in cash and cash equivalents held in banks in the United States in excess of the federally insured limits.
Accounts Receivable
The Company records accounts receivable at the invoiced amount when its products are shipped to customers or upon the completion of specific milestone billing requirements. The Company’s receivable balance is recorded net of allowances for amounts not expected to be collected from our customers. This allowance for
F-7
Table of Contents
doubtful accounts is the Company’s best estimate of probable credit losses in the Company’s existing accounts receivable. Estimates used in determining the allowance for doubtful accounts are based on historical collection experience, aging of receivables and known collectability issues. The Company writes off accounts receivable when it becomes apparent, based upon age or customer circumstances that such amounts will not be collected. The Company reviews its allowance for doubtful accounts on a quarterly basis. Recovery of bad debt amounts previously written off is recorded as a reduction of bad debt expense in the period the payment is collected. Generally, the Company does not require collateral for its accounts receivable and does not regularly charge interest on past due amounts. As of December 31, 2010 and 2009, accounts receivable of the Company are reflected net of an allowance for doubtful accounts of $851,000 and $655,000, respectively.
As of December 31, 2010 and 2009, there were $10.9 million and $1.5 million, respectively of accounts receivable pledged as collateral for the Company’s lines of credit with Wells Fargo Bank, N.A. (“Wells Fargo”) and IFN Finance.
Inventories
Inventories, which consist of raw materials and purchased components and subsystems, work-in-process and finished lighting products, are stated at the lower of cost or market. Cost of raw materials is determined using a weighted average method. Work in process and finished lighting products include raw materials, labor and allocated overhead. Slow product adoption, rapid technological changes and new product introductions and enhancements could result in excess or obsolete inventory. The Company evaluates inventory levels and expected usage on a periodic basis to specifically identify obsolete, slow-moving or non-salable inventory.
Property and Equipment
Property and equipment are stated at cost less accumulated depreciation. Equipment under capital leases is stated at the present value of future minimum lease payments. Depreciation is provided using the straight-line method over the estimated economic lives of the assets, as follows:
| Estimated Useful Lives | ||
| Leasehold improvements |
1-5 years | |
| Office, furniture and equipment |
2-5 years | |
| Tooling, production and test equipment |
4 years |
Leasehold improvements and equipment under capital leases are amortized on a straight-line basis over the shorter of the minimum lease term or the estimated useful life of the assets. Expenditures for repairs and maintenance are charged to expense as incurred. The costs for major renewals and improvements are capitalized and depreciated over their estimated useful lives.
Intangible Assets and Goodwill
The Company records the assets acquired and liabilities assumed in business combinations at their respective fair values at the date of acquisition, with any excess purchase price recorded as goodwill. Valuation of intangible assets entails significant estimates and assumptions including, but not limited to, estimating future cash flows from product sales, developing appropriate discount rates, continuation of customer relationships and renewal of customer contracts and approximating the useful lives of the intangible assets acquired.
Intangible assets with estimable useful lives are amortized over their respective useful lives. The Company is currently amortizing its acquired intangible assets with definite lives over periods ranging from three to twenty years. Goodwill is not amortized, but instead the Company performs a goodwill impairment analysis, using the two-step method at the end of the Company’s third quarter, and whenever events or changes in circumstances indicate that the carrying value of goodwill may not be recoverable.
F-8
Table of Contents
The recoverability of goodwill is measured at the reporting unit level. The fair value of each reporting unit is estimated using a discounted cash flow methodology. This analysis requires significant judgments, including estimation of future cash flows, which is dependent on internal forecasts, estimation of the long-term growth rate for the business, the useful life over which cash flows will occur and the determination of the weighted average cost of capital. If the fair value of a reporting unit is less than the carrying amount, goodwill of the reporting unit is considered impaired and the second step is performed. The second step of the impairment test, when required, compares the implied fair value of the reporting unit goodwill with the carrying amount of that goodwill. If the carrying amount of the reporting unit goodwill exceeds the implied fair value of that goodwill, an impairment charge is recognized for the amount equal to that excess.
The Company completed its annual goodwill impairment test as of September 30, 2010, 2009 and 2008. A test was completed as of June 30, 2010 for the intangible assets and goodwill related to LSGBV due to a triggering event, caused by on-going negative cash flows and other factors. In addition, the Company performed an impairment analysis of the intangible assets related to the acquisition of LED Effects, Inc. (“LED Effects”) as of December 31, 2010 due to the greater than anticipated headcount reductions, a triggering event in the fourth quarter of 2010, associated with the restructuring of the Company’s California based operations, including the closure of the California location and subsequent move of the business to the Company’s Satellite Beach, FL headquarters. As of December 31, 2008, due to changes in circumstances in the fourth quarter of 2008, an additional test was completed for the intangible assets and goodwill related to the acquisitions completed in 2008. Impairment charges related to goodwill and identified intangible assets of $11.5 million, $0 and $53.1 million were recorded for the years ended December 31, 2010, 2009 and 2008, respectively.
Impairment of Long-lived Assets
The Company reviews long-lived assets such as property, equipment and definite lived intangible assets for impairment when events and circumstances indicate that the carrying amount of an asset may not be recoverable. In making these determinations, the Company uses certain assumptions, including but not limited to: (i) estimations of the fair market value of the assets and (ii) estimations of the future cash flows expected to be generated by these assets, which are based on additional assumptions such as asset utilization, length of service the asset will be used in the Company’s operations and estimated salvage values. Recoverability of assets to be held and used is measured by a comparison of the carrying value of the assets to the estimated undiscounted future cash flows expected to be generated by the assets. If the carrying value of the assets exceeds their estimated future cash flows, an impairment charge is recognized in the amount by which the carrying amount of the assets exceeds their fair value.
Derivatives
All derivatives are recorded at fair value on the consolidated balance sheets and changes in the fair value of such derivatives are measured in each period and are reported in other income (expense).
Fair Value of Financial Instruments
The Fair Value Measurements and Disclosures Topic of the Financial Accounting Standards Board (“FASB”) Accounting Standards Codification defines fair value as the price at which an asset could be exchanged in a current transaction between knowledgeable, willing parties. A liability’s fair value is defined as the amount that would be paid to transfer the liability to a new obligor, not the amount that would be paid to settle the liability with the creditor.
F-9
Table of Contents
Assets and liabilities measured at fair value are categorized based upon the level of judgment associated with the inputs used to measure their fair value. Hierarchical levels are directly related to the amount of subjectivity associated with the inputs to a fair valuation of these assets and liabilities and are as follows:
Level 1 — Unadjusted quoted prices that are available in active markets for the identical assets or liabilities at the measurement date.
Level 2 — Other observable inputs available at the measurement date, other than quoted prices included in Level 1, either directly or indirectly, including:
| • | Quoted prices for similar assets or liabilities in active markets; |
| • | Quoted prices for identical or similar assets in non-active markets; |
| • | Inputs other than quoted prices that are observable for the asset or liability; and |
| • | Inputs that are derived principally from or corroborated by other observable market data. |
Level 3 — Unobservable inputs that cannot be corroborated by observable market data and reflect the use of significant management judgment. These values are generally determined using pricing models for which the assumptions utilize management’s estimates of market participant assumptions.
Revenue Recognition
The Company records revenues when its products are shipped and title passes to customers. When sales of products are subject to certain customer acceptance terms, revenue from such sales is recognized once these terms have been met. We also provide our customers with limited rights of return for non-conforming shipments or product warranty claims.
The Company recognizes revenue on certain long-term, fixed price, custom lighting design projects using the percentage of completion method measured by the ratio of costs incurred in a period to the estimated total costs to be incurred for each contract. Contract costs include all direct material, direct labor and other indirect costs related to contract performance. Provisions for estimated losses on uncompleted contracts are made in the period in which such losses are determined. Changes in job performance, job conditions, estimated profitability and final contract settlements may result in revisions to costs and income and are recognized in the period in which the revisions are determined.
For smaller or shorter term custom lighting design projects or projects where estimated total costs cannot be determined, revenue is recognized using the completed contract method and revenue is recognized upon substantial completion and acceptance by the customer of the project. Amounts received as deposits against future completion of completed contract method projects are recorded as unearned revenue until such projects are completed and title passes to the customer.
Shipping and Handling Fees and Costs
Shipping and handling fees billed to customers are included in revenue. Shipping and handling costs associated with in-bound freight are recorded in cost of goods sold. Other shipping and handling costs are included in sales and marketing expenses and totaled $2.1 million, $149,000, and $264,000 for the years ended December 31, 2010, 2009 and 2008, respectively.
Research and Development
The Company expenses all research and development costs, including amounts for design prototypes and modifications made to existing prototypes, as incurred, except for prototypes that have alternative future uses. All costs incurred for building of production tooling and molds are capitalized and amortized over the estimated useful life of the tooling set or mold.
F-10
Table of Contents
Product Warranties
The Company provides a limited warranty covering defective materials and workmanship. The Company generally provides a five year warranty on its products and such warranty may require the Company to repair, replace or reimburse the purchaser for the purchase price of the product. The estimated costs related to warranties are accrued at the time products are sold based on various factors, including the Company’s stated warranty policies and practices, the historical frequency of claims and the cost to repair or replace its products under warranty. The following table summarizes warranty provision activity during the years ended December 31, 2010 and 2009:
| Warranty provision at December 31, 2008 |
$ | 302,173 | ||
| Additions to provision |
628,000 | |||
| Less warranty costs |
(486,186 | ) | ||
| Warranty provision at December 31, 2009 |
443,987 | |||
| Additions to provision |
749,327 | |||
| Less warranty costs |
(582,426 | ) | ||
| Warranty provision at December 31, 2010 |
$ | 610,888 | ||
Share Based Compensation
As of December 31, 2010, the Company had two share based compensation plans. The fair value of share based compensation awards, which historically have included stock options and restricted stock awards, is recognized as compensation expense in the statement of operations. The fair value of stock options is estimated on the date of grant using the Black-Scholes option pricing model. Option valuation methods require the input of highly subjective assumptions, including the expected stock price volatility. Measured compensation expense related to such option grants is recognized ratably over the vesting period of the related grants. Restricted stock awards are valued on the date of grant.
Income taxes
The Company employs the asset and liability method in accounting for income taxes. Under this method, deferred tax assets and liabilities are determined based on temporary differences between the financial reporting and tax bases of assets and liabilities and net operating loss carryforwards, and are measured using enacted tax rates and laws that are expected to be in effect when the differences are reversed.
Valuation Allowance—Deferred Tax Assets
The Company records a valuation allowance to reduce its deferred tax assets to the amount which, the Company estimates, is more likely than not to be realized. The Company’s ability to realize its deferred tax assets is generally dependent on the generation of taxable income during the future periods in which the temporary differences are deductible and the net operating losses can be offset against taxable income. The Company increased its valuation allowance in 2010 and believes the increase is appropriate based on its pre-tax losses in the past several years and accounting guidelines that provide that cumulative losses in recent years provide significant evidence that a company should not recognize tax benefits that depend on the generation of taxable income from future operations. If the Company were to determine that it would be able to realize deferred tax assets in the future in excess of the net recorded amount, the resulting adjustment to deferred tax assets would increase net earnings in the period in which such a determination was made.
Earnings (Loss) Per Share
Basic earnings per share is computed by dividing net income (loss) available to common stockholders by the weighted average number of common shares outstanding for the applicable period. Diluted earnings per share is
F-11
Table of Contents
computed in the same manner as basic earnings per share except the number of shares is increased to assume exercise of potentially dilutive stock options, unvested restricted stock and contingently issuable shares using the treasury stock method, unless the effect of such increases would be anti-dilutive. In periods in which a net loss has been incurred, all potentially dilutive common shares are considered anti-dilutive and thus are excluded from the calculation. The incremental shares from the assumed conversion of the Company’s potential common stock, such as stock options and have not been used in the calculation of diluted net loss per share because to do so would be anti-dilutive.
Advertising
Advertising costs, included in sales and marketing expenses, are expensed when the advertising first takes place. The Company primarily promotes its product lines through print media and trade shows, including trade publications and promotional brochures. Advertising expenses were $548,000, $564,000 and $583,000 for the years ended December 31, 2010, 2009 and 2008, respectively.
Segment Reporting
The Company operates as a single segment under Accounting Standard Codification (“ASC”) 280-10-50, “Disclosures about Segments of an Enterprise and Related Information”. The Company’s chief operating decision maker reviews financial information at the enterprise level and makes decisions accordingly.
Reclassification
Certain prior period amounts in the accompanying consolidated financial statements have been reclassified to conform to the current year presentation. These reclassifications had no effect on previously reported net loss or shareholders’ deficit.
New Accounting Pronouncements
The Company has reviewed all recently issued accounting pronouncements and does not believe the adoption of any of these pronouncements has had or will have a material impact on the Company’s consolidated financial condition or the results of its operations or cash flows.
NOTE 3: LIQUIDITY
As shown in the consolidated financial statements, the Company has experienced significant net losses as well as negative cash flows from operations since 2007. The Company’s anticipated growth is expected to significantly increase its working capital needs during 2011, and meeting these needs will be an ongoing challenge. The Company’s primary sources of liquidity have historically been sales of common stock and preferred stock to, and short-term loans from, affiliates of Pegasus Capital Advisors, L.P. (“Pegasus Capital”), including Pegasus Partners IV, L.P. (“Pegasus IV”) and LSGC Holdings, LLC (“LSGC Holdings”), which together with its affiliates, is the Company’s controlling stockholder and, to a lesser extent, draws from its lines of credit with Bank of Montreal (“BMO”), ABN AMRO, IFN Finance, Wells Fargo and other short-term loans.
The Company has historically been dependent on affiliates of Pegasus Capital for its liquidity needs because other sources of liquidity have been insufficient or unavailable to meet its anticipated working capital needs. Cash outflows primarily relate to procurement of inventory and payment of salaries, benefits and other operating costs. As of December 31, 2010, the Company had cash and cash equivalents of approximately $14.5 million.
On September 30, 2010, the Company entered into a Stock Purchase, Exchange and Recapitalization Agreement (the “Recapitalization Agreement”) with Pegasus IV, LSGC Holdings, and LED Holdings, LLC (“LED Holdings”). Pursuant to the Recapitalization Agreement, LSGC Holdings purchased $25.0 million of the Company’s common stock and Pegasus IV and LED Holdings agreed to participate in a recapitalization of the Company (the “Recapitalization”).
F-12
Table of Contents
On October 4, 2010, the Company terminated its BMO revolving line of credit and the related guaranty agreement pursuant to the terms of the Recapitalization Agreement. On November 22, 2010, the Company entered into an asset-based lending facility with Wells Fargo that provides it with borrowing capacity of up to a maximum of $15.0 million, up to 85% of its applicable and eligible inventory and accounts receivable plus qualified cash. As of December 31, 2010, the Company had approximately $4.7 million outstanding under this facility and additional borrowing capacity of approximately $9.5 million.
LSGBV has also negotiated short and long term debt facilities with ABN AMRO and a working capital facility with IFN Finance B.V. As of December 31, 2010, the ABN AMRO facility had a maximum availability of €200,000 and on December 31, 2010, the total amount outstanding under the ABN AMRO facilities was €171,000, or $226,000. The IFN Finance facility is an asset based facility with a maximum line of credit of €1.5 million and availability is based on 82% of LSGBV’s eligible trade receivable invoices. As of December 31, 2010, the total amount outstanding under the IFN Finance facility was €873,000, or $1.2 million. Both of these facilities are due on demand.
The Company may need to raise additional capital through the issuance of equity, equity-related or debt securities or through obtaining additional credit through financial institutions. The Company cannot be certain that these additional funds will be available on terms satisfactory to it or at all. In January 2011, the Company received approximately $18.0 million from a private placement led by its affiliates, including Pegasus Capital and two of its directors, and expects to receive $7.0 million in life insurance proceeds during 2011 from a key-man life insurance policy issued on Zachary Gibler, the Company’s former Chairman and Chief Executive Officer. The Company filed a registration statement on February 10, 2011 relating to a proposed underwritten public offering of up to $150.0 million of its common stock, but such offering remains subject to a number of conditions. Upon receipt of the proceeds from such life insurance policy and the anticipated offering, the Company believes it will be able to fund its operations for the next 12 months.
The Company also received a commitment from Pegasus IV to fund its cash flow needs as it has done in the past, through March 31, 2012.
NOTE 4: FAIR VALUE MEASUREMENTS
Cash and cash equivalents, accounts receivable, note and accounts payable, amounts due under lines of credit, promissory notes, including convertible notes, accrued expenses and other current liabilities are carried at book value amounts, which approximate fair value due to the short-term maturity of these instruments.
Long-term debt bears interest at variable interest rates and, therefore, its carrying value approximates fair value.
The fair value of the LSGBV assets and the associated goodwill was estimated using the discounted cash flow method, which was based on the future expected cash flows to be generated by LSGBV, discounted to their present values, using a discount rate of 17%. Amortizable intangible assets related to the acquisition of LSGBV were written down to their estimated fair values as of June 30, 2010 and certain amortizable intangible assets related to the acquisition of LED Effects were written down to their estimated fair value as of December 31, 2010. The estimated fair values were determined under various methodologies under the income approach of valuation and using discount rates comparable to those used to value the Company’s goodwill.
The fair value of the interest rate swap (used for non-speculative purposes) was based on observable yield curves and was included in accrued expenses.
The Company has applied liability accounting to the Series D and Series E Warrants (defined in Note 10) for 2010 and these warrants were recorded at fair value using the Monte Carlo valuation method and were valued on a recurring basis for the year ended December 31, 2010. The Company has also applied liability accounting to the warrants issued to certain directors and officers of a predecessor company for 2009. These warrants were
F-13
Table of Contents
recorded at fair value using the Black Scholes valuation method and were valued on a recurring basis for the years ended December 31, 2010 and 2009. Both the Monte Carlo valuation method and the Black Scholes valuation method used Level 3 inputs in valuing these instruments.
The following table sets forth by level within the fair value hierarchy the Company’s financial assets and liabilities that were accounted for at fair value on a non-recurring basis as of December 31, 2010, according to the valuation techniques the Company used to determine their fair values:
| Fair Value Measurement as of December 31, 2010 | ||||||||||||
| Quoted Price in Active Markets for Identical Assets |
Significant Other Observable Inputs |
Significant Unobservable Inputs |
||||||||||
| Level 1 | Level 2 | Level 3 | ||||||||||
| Assets (Non-recurring): |
||||||||||||
| Intangible assets |
$ | — | $ | — | $ | 822,958 | ||||||
| Goodwill |
— | — | — | |||||||||
| $ | — | $ | — | $ | 822,958 | |||||||
The Company had no financial assets or liabilities as of December 31, 2010 that were accounted for at fair value on a recurring basis.
The following table is a reconciliation of the beginning and ending balances for assets that were accounted for at fair value on a recurring basis using Level 3 inputs as defined above for the year ended December 31, 2010:
| Derivative Financial Instruments |
||||
| Beginning balance |
$ | 1 | ||
| Realized and unrealized gains included in net loss |
150,557,529 | |||
| Realized and unrealized losses included in other comprehensive loss |
— | |||
| Purchases, sale, issuances and settlements |
73,123,016 | |||
| Transfers in or out of Level 3 |
(223,680,546 | ) | ||
| Ending balance |
$ | — | ||
The following table sets forth by level within the fair value hierarchy the Company’s financial assets and liabilities that were accounted for at fair value on a recurring basis as of December 31, 2009, according to the valuation techniques the Company used to determine their fair values:
| Fair Value Measurement as of December 31, 2009 | ||||||||||||
| Quoted Price in Active Markets for Identical Assets |
Significant Other Observable Inputs |
Significant Unobservable Inputs |
||||||||||
| Level 1 | Level 2 | Level 3 | ||||||||||
| Assets (Recurring): |
||||||||||||
| Interest rate swap |
$ | — | $ | 21,745 | $ | — | ||||||
| $ | — | $ | 21,745 | $ | — | |||||||
| Liabilities (Recurring): |
||||||||||||
| Liabilities under derivative contracts |
$ | — | $ | — | $ | 1 | ||||||
| $ | — | $ | — | $ | 1 | |||||||
F-14
Table of Contents
The Company had no financial assets or liabilities as of December 31, 2009 that were accounted for at fair value on a non-recurring basis.
NOTE 5: INVENTORIES
Inventories are comprised of the following:
| As of December 31, | ||||||||
| 2010 | 2009 | |||||||
| Raw materials and components |
$ | 21,749,105 | $ | 13,082,060 | ||||
| Work-in-process |
761,171 | 331,417 | ||||||
| Finished lighting products |
4,875,301 | 2,493,750 | ||||||
| Less reserve for obsolescence |
(4,338,665 | ) | (7,842,603 | ) | ||||
| Total inventory |
$ | 23,046,912 | $ | 8,064,624 | ||||
On a quarterly basis, the Company performs a review of its inventory for estimated obsolescence or slow-moving inventory based upon assumptions about future demand and market conditions. As a result of these reviews, the Company recorded a provision for obsolescence of $1.5 million for the year ended December 31, 2010, with the expense included in cost of goods sold. $898,000 of the provision for obsolescence in 2010 was driven by restructuring activities for both the European operations and the operations previously based in California related to the discontinuation of certain products previously produced exclusively in these locations.
Due to the early developmental stage of the applicable products and the Company’s focus on research and development during these periods, the Company recorded provisions for obsolescence in research and development for the years ended December 31, 2009 and 2008, of $4.8 million and $4.5 million, respectively.
NOTE 6: PROPERTY AND EQUIPMENT
Property and equipment consists of the following:
| As of December 31, | ||||||||
| 2010 | 2009 | |||||||
| Leasehold improvements |
$ | 500,244 | $ | 2,727,334 | ||||
| Office, furniture and equipment |
3,906,000 | 4,495,919 | ||||||
| Tooling, production and test equipment |
7,334,068 | 5,959,658 | ||||||
| Construction-in-process |
997,112 | — | ||||||
| Total property and equipment |
12,737,424 | 13,182,911 | ||||||
| Accumulated depreciation |
(4,907,083 | ) | (9,891,615 | ) | ||||
| Total property and equipment, net |
$ | 7,830,341 | $ | 3,291,296 | ||||
Depreciation expense was $1.4 million, $1.3 million and $1.2 million for the years ended December 31, 2010, 2009 and 2008, respectively.
F-15
Table of Contents
NOTE 7: INTANGIBLE ASSETS AND GOODWILL
Intangible assets with estimable useful lives are amortized over their respective useful lives. The intangible assets, their original fair values, adjusted for impairment charges, and their ranges of estimated useful lives are detailed below as of December 31, 2010 and 2009:
| Cost, Less Impairment Charges |
Accumulated Amortization |
Net Book Value |
Estimated Remaining Useful Life |
|||||||||||||
| December 31, 2010: |
||||||||||||||||
| Technology and intellectual property |
$ | 3,849,156 | $ | (2,067,991 | ) | $ | 1,781,165 | 1.7 to 13.4 years | ||||||||
| Trademarks |
1,070,483 | (407,517 | ) | 662,966 | 2.3 to 17.6 years | |||||||||||
| Customer relationships |
3,460,132 | (1,999,859 | ) | 1,460,273 | 1.3 to 11.5 years | |||||||||||
| License agreements |
2,077,668 | (2,029,145 | ) | 48,523 | 7.3 years | |||||||||||
| $ | 10,457,439 | $ | (6,504,512 | ) | $ | 3,952,927 | ||||||||||
| Goodwill |
$ | 1,626,482 | $ | — | $ | 1,626,482 | ||||||||||
| December 31, 2009: |
||||||||||||||||
| Technology and intellectual property |
$ | 5,152,229 | $ | (2,574,421 | ) | $ | 2,577,808 | 0.5 to 14.5 years | ||||||||
| Trademarks |
1,566,910 | (311,428 | ) | 1,255,482 | 3.5 to 18.5 years | |||||||||||
| Customer relationships |
6,049,000 | (1,525,729 | ) | 4,523,271 | 2.5 to 12.5 years | |||||||||||
| License agreements |
7,642,500 | (2,516,325 | ) | 5,126,175 | 8.5 years | |||||||||||
| $ | 20,410,639 | $ | (6,927,903 | ) | $ | 13,482,736 | ||||||||||
| Goodwill |
$ | 5,770,245 | $ | — | $ | 5,770,245 | ||||||||||
Total intangible asset amortization expense was $1.5 million, $4.0 million and $3.2 million for the years ended December 31, 2010, 2009 and 2008, respectively.
The changes in the carrying amounts of goodwill for the years ended December 31, 2010 and 2009 were as follows:
| Balance as of December 31, 2008 |
$ | 6,799,962 | ||
| Goodwill acquired during the year |
— | |||
| Impairment charges |
— | |||
| Currency translation adjustments |
(1,029,717 | ) | ||
| Balance as of December 31, 2009 |
5,770,245 | |||
| Goodwill acquired during the year |
— | |||
| Impairment charges |
(3,529,609 | ) | ||
| Currency translation adjustments |
(614,154 | ) | ||
| Balance as of December 31, 2010 |
$ | 1,626,482 | ||
Impairment of Goodwill and Intangible Assets
Because of LSGBV’s on-going negative cash flows and other factors, as of June 30, 2010, the Company performed an impairment analysis of LSGBV’s assets to determine whether any goodwill or intangible assets were impaired. The fair value of the LSGBV assets and the associated goodwill were estimated using the discounted cash flow and income approaches, which were based on the future expected cash flows to be generated by LSGBV, discounted to their present values, using a 17% discount rate. Amortizable intangible assets with carrying values were tested to determine their recoverability by comparing the future undiscounted cash flows expected to be generated by such assets (or asset groups),to their carrying values. Because the carrying values exceeded their undiscounted cash flows, such assets were written down to their estimated fair
F-16
Table of Contents
values as of June 30, 2010. The estimated fair values were determined under various methodologies under the income approach of valuation and using discount rates comparable to those used to value the Company’s goodwill. The result of these valuations was that an impairment charge totaling $10.5 million was recorded as of June 30, 2010.
The Company performed an impairment analysis of the intangible assets related to the acquisition of LED Effects as of December 31, 2010, due to the greater than anticipated headcount reductions, a triggering event in the fourth quarter of 2010, associated with the restructuring of the Company’s California based operations, including the closure of the California location and subsequent move of the business to the Company’s Satellite Beach, FL headquarters. This review included an assessment of the current use of these intangible assets and the estimated useful lives. The result of this assessment was that an impairment charge of $1.1 million was recorded as of December 31, 2010.
The following table summarizes the total impairment charges recorded by the Company in 2010:
| Goodwill arising on the acquisition of LSGBV |
$ | 3,529,609 | ||
| Trademarks acquired on the acquisition of LSGBV |
191,500 | |||
| Customer relationships acquired on the acquisition of LSGBV |
1,967,400 | |||
| License agreements acquired on the acquisition of LSGBV |
4,766,500 | |||
| Trademarks acquired on the acquisition of LED Effects |
533,975 | |||
| Customer relationships acquired on the acquisition of LED Effects |
559,666 | |||
| Total impairment charge |
$ | 11,548,650 | ||
Because of the significant decline in the Company’s stock price during the fourth quarter of 2008, the Company tested its goodwill for impairment and its intangible assets for recoverability as of December 31, 2008. For goodwill, the fair value of the Company’s operations and the associated goodwill was estimated using the discounted cash flow method, which is based on the future expected cash flows to be generated by the reporting units, discounted to their present values, using discount rates ranging from 17.5% to 25.0%. Amortizable intangible assets, with carrying values were tested to determine their recoverability by comparing the future undiscounted cash flows expected to be generated by such assets to their carrying values. Because the carrying values exceeded their undiscounted cash flows, such assets were written down to their estimated fair values as of December 31, 2008. The estimated fair values were determined under various methodologies under the income approach of valuation, using discount rates comparable to those used to value the Company’s goodwill. The result of these valuations were that a material impairment charge totaling $53.1 million was recorded as of December 31, 2008.
F-17
Table of Contents
The following table summarizes the total impairment charges recorded by the Company in 2008:
| Goodwill arising on the acquisition of Lighting Science Group Corp |
$ | 42,605,552 | ||
| Technology and patents acquired on the acquisition of Lighting Science Group Corp |
2,419,984 | |||
| Goodwill arising on the acquisition of LSGBV |
6,159,000 | |||
| Trademarks acquired on the acquisition of LSGBV |
796,741 | |||
| Technology and patents acquired on the acquisition of LSGBV |
322,856 | |||
| Customer relationships acquired on the acquisition of LSGBV |
806,000 | |||
| Total impairment charge |
$ | 53,110,133 | ||
No impairments to goodwill were recorded at September 30, 2010, 2009 or 2008, as a result of the Company’s annual testing in accordance with its accounting policy for goodwill.
The table below is the estimated amortization expense, adjusted for any impairment charges, for the Company’s intangible assets for each of the next five years and thereafter:
| 2011 |
844,643 | |||
| 2012 |
756,536 | |||
| 2013 |
686,667 | |||
| 2014 |
673,757 | |||
| 2015 |
155,098 | |||
| Thereafter |
836,098 | |||
| 3,952,799 | ||||
NOTE 8: SHORT-TERM DEBT
The Company and its subsidiaries had the following balances outstanding under lines of credit and other short-term debt facilities:
| Balance Outstanding as of December 31, |
||||||||
| Facility |
2010 | 2009 | ||||||
| ABN AMRO Bank, revolving line of credit |
$ | 226,421 | $ | — | ||||
| Wells Fargo, revolving line of credit |
4,691,852 | — | ||||||
| IFN Finance, working capital line |
1,157,406 | 1,132,229 | ||||||
| ABN AMRO term note payable |
— | 1,791,525 | ||||||
| Bank of Montreal, demand line of credit |
— | 15,600,000 | ||||||
| Convertible notes issued to related parties |
— | 32,846,619 | ||||||
| Convertible note issued to Philips Electronics |
— | 5,000,000 | ||||||
| Other |
— | 29,800 | ||||||
| $ | 6,075,679 | $ | 56,400,173 | |||||
ABN AMRO Bank
As of December 31, 2010, the ABN AMRO revolving line of credit had a maximum liability of €200,000 and the interest rate on the facility was 7.5% and 6.90% as of December 31, 2010 and 2009, respectively. The ABN AMRO revolving line of credit is payable on demand. ABN AMRO has a senior security interest in the inventory, property and equipment of LSGBV. The ABN AMRO term note payable matured on December 15, 2010.
F-18
Table of Contents
IFN Finance
As of December 31, 2010, the maximum line of credit on the IFN Finance facility was €1.5 million and availability is based on 82% of the value of trade receivable invoices and as of December 31, 2010 there were $1.8 million of accounts receivable pledged as collateral. Interest is payable monthly on this facility and the interest rate was 7.15% as of both December 31, 2010 and 2009. The IFN Finance facility is payable on demand. IFN Finance has a senior security interest in all accounts receivable of LSGBV.
Wells Fargo
On November 22, 2010, the Company executed an asset-based revolving credit facility with Wells Fargo (the “Wells Fargo ABL”) that provides borrowing capacity of up to 85% of its applicable and eligible inventory and accounts receivable plus qualified cash, up to a maximum of $15.0 million. As of December 31, 2010 qualified collateral included $9.1 million of accounts receivable, $2.3 million of inventory and $10.0 million of qualified cash. Borrowings under the Wells Fargo ABL bear interest at one of the following two rates (at the Company’s election): (a) the sum of (1) the greater of: (x) the federal funds rate plus 0.50%, (y) the daily three month LIBOR rate plus 1.0% and (z) Wells Fargo’s prime rate; and (2) 0.75%, 1.25% or 1.75%, as applicable, depending on the amount available for borrowing under the facility and subject to any reserves established by Wells Fargo in accordance with the terms of the facility; or (b) the sum of (1) the daily three month LIBOR rate; plus 3.0%, 3.5% or 4.0%, as applicable, depending on the amount available for borrowing under the facility and subject to any reserves established by Wells Fargo in accordance with the terms of the facility. The annual interest rate was equal to 3.9% as of December 31, 2010.
The Company is required to pay certain fees, including an unused line fee ranging from 0.375% to 1.0% of the unused portion of the facility. Outstanding loans may be prepaid without penalty or premium, except that the Company is required to pay a termination fee ranging from $75,000 to $300,000 (depending on the date of termination) if the facility is terminated by the Company prior to the scheduled maturity date of November 22, 2013 or by Wells Fargo during a default period.
The Wells Fargo ABL contains customary financial covenants, which limit the Company’s ability to incur additional indebtedness or guarantee indebtedness of others, create liens on the Company’s assets, enter into mergers or consolidations, dispose of assets, prepay indebtedness or make changes to the Company’s governing documents and certain agreements, pay dividends or make other distributions on the Company’s capital stock, redeem or repurchase capital stock, make investments, including acquisitions; and enter into transactions with affiliates. The Company is also required to maintain minimum excess borrowing availability of $4.0 million and would be required to comply with certain specified EBITDA requirements in the event that the Company has less than $6.0 million available for borrowing on the Wells Fargo ABL. The Wells Fargo ABL also contains customary events of default and affirmative covenants. The Company was compliant with all covenants under the Wells Fargo ABL as of December 31, 2010. At December 31, 2010, the Company had additional borrowing capacity under the Wells Fargo ABL of $9.5 million. The Wells Fargo ABL contains a subjective acceleration clause, a lockbox requirement and cross default provisions.
Bank of Montreal
The BMO revolving line of credit and the related guaranty agreement was terminated on October 4, 2010. The loan agreement required monthly payments of interest only and interest was calculated on the outstanding balance at the greater of prime plus 0.50% per annum and 7.25% per annum (7.25% as of December 31, 2009). The BMO loan was scheduled to mature on written demand by BMO, but in no event later than April 19, 2011. Any outstanding balance under the Loan Agreement was payable on written demand by BMO, provided that the Company would have 14 business days to make any such payment. The Loan Agreement was not secured by any assets of the Company, but was guaranteed by Pegasus IV. During the years ended December 31, 2010, 2009 and
F-19
Table of Contents
2008, the Company recorded guaranty and transaction fee expenses of $906,000, $1.9 million and $669,000, respectively, related to the guaranty of the BMO facility by Pegasus IV. As of December 31, 2010 and 2009, the Company had accrued total guaranty fees payable to Pegasus IV of $0 and $748,000, respectively, related to the BMO facility, which amounts were included in interest expense.
Related Party
As of December 31, 2009, the Company had an outstanding unsecured convertible note to Pegasus IV for $32.8 million with interest accruing at the rate of 14.00% per annum. In conjunction with the Company’s consummation of a rights offering on March 3, 2010, $35.2 million of principal and interest on the Pegasus Convertible Note automatically converted into 35,017,667 Series D Units (defined in Note 9).
Philips Electronics
On August 27, 2009, the Company entered into an unsecured Convertible Note Agreement (the “Philips Convertible Note”) with Koninklijke Philips Electronics N.V. (“Philips Electronics”) pursuant to which the Company borrowed $5.0 million. As of December 31, 2009, the balance of the Philips Convertible Note was $5.0 million with interest accruing at the rate of 14.0% per annum. In conjunction with the Company’s consummation of a rights offering on March 3, 2010, $5.4 million of principal and interest on the Philips Convertible Note automatically converted into 5,330,482 Series D Units (defined in Note 9).
NOTE 9: CONVERTIBLE NOTE ISSUANCES
Pegasus IV
On May 15, 2009, the Company entered into a convertible note agreement (the “Original Pegasus Convertible Note”) with Pegasus IV, which provided the Company with approximately $31.6 million. Effective as of July 31, 2009, the Company entered into the First Amendment to the Convertible Note Agreement, pursuant to which the maturity date of the Original Pegasus Convertible Note was extended.
On August 27, 2009, the Original Pegasus Convertible Note (as amended) was terminated, and the Company entered into the New Pegasus Convertible Note with Pegasus IV in the principal amount of $32.8 million, which represented the outstanding principal and accrued interest on the Original Pegasus Convertible Note as of August 27, 2009. Interest on the New Pegasus Convertible Note accrued at the rate of 14% per annum. The outstanding principal and interest was scheduled to become due upon the earlier of: (a) July 31, 2010 and (b) the date of the consummation of the Company’s rights offering. Pursuant to the New Pegasus Convertible Note, the Company agreed to use commercially reasonable efforts to conduct the rights offering as soon as reasonably practical. The New Pegasus Convertible Note also granted Pegasus IV the right to acquire any units not otherwise subscribed for pursuant to the terms of the rights offering (the “Standby Purchase Option”).
On March 3, 2010, the Company consummated the rights offering and approximately $35.2 million of principal and accrued interest on the New Pegasus Convertible Note automatically converted into 35,017,667 Series D Units. Each Series D Unit consisted of one share of Series D Non-Convertible Preferred Stock (“Series D Preferred Stock”) and a warrant (the “Series D Warrant”) to purchase one share of the Company’s common stock.
Philips Electronics
On August 27, 2009, the Company entered into the Philips Convertible Note with Philips pursuant to which the Company borrowed $5.0 million. Interest on the outstanding principal balance under the Philips Convertible Note accrued at the rate of 14% per annum. All principal and interest on the Philips Convertible Note was scheduled to become due on the earliest of the following three dates (such date, the “Maturity Date”): (a) July 31, 2010, (b) the date of the consummation of the Company’s rights offering or (c) the first business day
F-20
Table of Contents
immediately following the date on which the Company notified Philips that Pegasus IV had voluntarily converted the outstanding principal and interest under the New Pegasus Convertible Note. As a result of the Company’s consummation of the rights offering on March 3, 2010, approximately $5.4 million of principal and accrued interest on the Philips Convertible Note automatically converted into 5,330,482 Series D Units.
NOTE 10: SERIES D AND SERIES E PREFERRED UNITS
Series D Units and Series D Preferred Stock
On March 3, 2010, the Company consummated a rights offering and $35.2 million of principal and interest on the New Pegasus Convertible Note and $5.4 million of principal and interest on the Philips Convertible Note automatically converted into 35,017,667 Series D Units and 5,330,482 Series D Units, respectively. On March 5, 2010, the Company received $303,000 from the sale of 301,268 Series D Units. On April 19, 2010, Pegasus IV and certain assignees of Pegasus IV purchased 24,966,925 Series D Units pursuant to the Standby Purchase Option, resulting in the Company’s receipt of $25.4 million in gross proceeds in connection with the closing of the rights offering and the exercise of the Standby Purchase Option. On April 20, 2010, the Company issued 1,555,860 Series D Units to Pegasus IV in satisfaction of its guaranty fee of $1.6 million relating to the BMO line of credit. On July 9, 2010, in conjunction with an amendment to the BMO line of credit and in accordance with the Company’s guaranty agreement with Pegasus IV, the Company issued Pegasus IV 88,102 Series D Units in satisfaction of its guaranty fee of $89,000.
The Series D Preferred Stock was recorded at issuance at the proceeds net of the fair value of the Series D Warrants, which was determined using the Monte Carlo valuation method at issuance. The difference between the amount recorded at issuance and the original issue price was accreted using the effective interest method over the term of the Series D Preferred Stock. The Series D Preferred Stock was recorded as a liability because it was mandatorily redeemable. The accretion for the Series D Preferred Stock was $49.0 million for the year ended December 31, 2010, as the full amount of the accretion was recognized prior to converting the Series D Preferred Stock into common stock under the terms of the Recapitalization Agreement (defined in Note 10).
Series D Warrants
Each Series D Warrant comprising part of the Series D Units evidenced the right to purchase one share of the Company’s common stock at an exercise price of $6.00 per share of common stock except the Series D Warrants comprising the Series D Units issued to Philips, which had an exercise price of $12.00 per share. As of December 21, 2010, the Company entered into a Warrant Agreement, which effectively amended the terms of the outstanding Series D Warrant. Pursuant to the Warrant Agreement, the exercise price of the Series D Warrants was reduced from $6.00 to between $5.90 and $5.92 per share of common stock (depending on the date of issuance) except the Series D Warrants issued to Philips, which adjusted from $12.00 to $11.90 per share of common stock., This reduction corresponded to the amount of such holders’ accrued Exercise Price Accrual. Each Series D Warrant expires on the twelfth anniversary of the date of issuance.
Each Series D Warrant holder also agreed to receive a credit for their benefit, which equaled the total unaccrued Annual Dividend (as defined in the Series D Certificate) of each share of Series D Preferred Stock that would have accrued following September 30, 2010, the date of the Recapitalization Agreement (defined in Note 10), through the eighth anniversary of the issuance of the Series D Preferred Stock (the “Accrual Credit”). Pursuant to the Warrant Agreement, each Series D Warrant holder received an Accrual Credit for each share of common stock into which such warrant is exercisable. The Accrual Credit may only be used to fund the payment of the exercise price of all or a portion of such holder’s Series D Warrants upon the earlier of: (i) the passage of eight years from the date of issuance of each Series D Warrant or (ii) a Liquidation Event of the Company (as defined in the Warrant Agreement). The Accrual Credit will remain credited to the account of each Series D Warrant holder until used or until the date that such warrants are no longer exercisable in accordance with their terms. After application of the Accrual Credit, the remaining exercise price of each Series D Warrant, following a
F-21
Table of Contents
change of control or the eighth anniversary of their issuance, would be between $1.02 to $1.05 per share of common stock, (depending on the date of issuance of the related shares of Series D Preferred Stock) except in the case of the Series D Warrants of Philips, whose effective exercise price would decrease to approximately $7.05 per share of common stock.
Upon issuance, the Series D Warrants were considered a derivative financial instrument under FASB ASC 815-10-15, “Derivatives and Hedging,” due to a down round provision contained in the warrants and the Series D Warrants were recorded as a liability at fair value using the Monte Carlo valuation method with changes in fair value measured and recorded at the end of each quarter. Pursuant to the terms of the Warrant Agreement, the Series D Warrants were amended to omit the down round provision, which had originally resulted in the Series D Warrants being recorded as liabilities. As of December 21, 2010, the effective date of the Warrant Agreement, the Series D Warrants were adjusted to fair value using the Monte Carlo valuation method and then reclassified to additional paid-in capital. The change in fair value for the year ended December 31, 2010 related to the Series D Warrants is an increase of $155.5 million. The change is recorded in the increase in fair value of liabilities under derivative contracts in the consolidated statement of operations and comprehensive loss. The change in fair value for the year ended December 31, 2010 was due primarily to the fluctuations in the price of the Company’s common stock.
Series E Units and Series E Preferred Stock
On June 23, 2010, the Company entered into the Subscription Agreement with Pegasus IV, pursuant to which it sold Pegasus IV 235,295 Series E Units at a price per Series E Unit of $127.50, for an aggregate purchase price of $30.0 million. Each Series E Unit consisted of: (a) one share of the Company’s newly designated Series E Preferred Stock (“Series E preferred Stock”) and (b) a warrant (the “Series E Warrant”) representing the right to purchase 50 shares of the Company’s common stock, par value $0.001 per share at a price per share of $7.00, subject to adjustment. Pursuant to the Subscription Agreement, the Company agreed to apply a portion of the proceeds to repay all amounts outstanding under the Company’s line of credit with the BMO. The Series E Preferred Stock was required to be redeemed on the eighth anniversary of the date of issuance or upon the Company’s earlier liquidation, dissolution or change of control.
The Series E Preferred Stock was recorded at issuance at the proceeds net of the fair value of the Series E Warrants, which was determined using the Monte Carlo valuation method at issuance. The difference between the amount recorded at issuance and the original issue price was accreted using the effective interest method over the expected term of the Series E Preferred Stock. The Series E Preferred Stock was recorded as a liability because it was mandatorily redeemable. The accretion for the Series E Preferred Stock was $24.1 million for the year ended December 31, 2010, as the full amount of the accretion was recognized prior to converting the Series E Preferred Stock into common stock under the terms of the Recapitalization Agreement (defined in Note 10). On September 30, 2010, pursuant to the Recapitalization Agreement, Pegasus IV exchanged all of its outstanding shares of Series E Preferred Stock and its Series E Warrant for shares of common stock.
Each share of Series E Preferred Stock underlying the Series E Units was entitled to an annual cumulative dividend of 13.454%, subject to adjustment, which compounded annually on the anniversary of the date of issuance.
Series E Warrants
Each Series E Unit was also comprised of a Series E Warrant representing the right to purchase 50 shares of the Company’s common stock. Each such Series E Warrant had an exercise price of $7.00 per share of common stock. Each Series E Warrant was scheduled to expire on the twelfth anniversary of the date of issuance. The Series E Warrants were considered a derivative financial instrument under the same guidance and due to the same down round provision as the Series D Warrants and were recorded as a liability at fair value using the Monte Carlo valuation method upon issuance. The change in fair value for the year ended December 31, 2010
F-22
Table of Contents
related to the Series E Warrants was a decrease of $5.0 million. The change was recorded in the increase in fair value of liabilities under derivative contracts in the consolidated statement of operations and comprehensive loss. The change in fair value for the year ended December 31, 2010 was due primarily to fluctuations in the price of the Company’s common stock.
The following table sets forth the allocation of the proceeds on the Series D and Series E Units between the fair market value of the warrants and the redeemable preferred shares:
| Total Proceeds |
Fair Market Value of Warrants |
Preferred Stock |
||||||||||
| Series D Units: |
||||||||||||
| March 3, 2010 |
$ | 40,893,316 | $ | 27,644,882 | $ | 13,248,434 | ||||||
| April 18, 2010 |
26,681,922 | 21,236,793 | 5,445,129 | |||||||||
| July 9, 2010 |
88,630 | 178,898 | — | |||||||||
| Total Series D Units |
$ | 67,663,868 | $ | 49,060,573 | $ | 18,693,563 | ||||||
| Series E Units: |
||||||||||||
| June 23, 2010 |
$ | 30,000,112 | $ | 24,062,443 | $ | 5,937,669 | ||||||
NOTE 11: STOCKHOLDERS’ EQUITY AND RECAPITALIZATION AGREEMENT
On September 30, 2010, the Company entered into the Stock Purchase, Exchange and Recapitalization Agreement (the “Recapitalization Agreement”) with Pegasus IV, LSGC Holdings and LED Holdings. Pursuant to the Recapitalization Agreement on September 30, 2010, LSGC Holdings purchased 12,500,000 shares of common stock at a price per share of $1.60, for an aggregate purchase price of $20.0 million. On October 5, 2010, LSGC Holdings exercised its option to purchase an additional 3,125,000 shares of common stock at a price per share of $1.60, for an aggregate purchase price of $5.0 million. In total, the Company issued 15,625,000 shares of common stock to LSGC Holdings for an aggregate purchase price of $25.0 million.
In conjunction with the Recapitalization, Pegasus IV, LED Holdings and an unrelated holder exchanged all of their respective shares of Series B Preferred Stock (the “Series B Preferred Stock”), Series C Preferred Stock (the “Series C Preferred Stock”), Series E Preferred Stock, and the Series E Warrant for 32,612,249 shares of common stock. The holders of the Series C Preferred Stock held warrants (“Series C Warrants”) to purchase a total of 3,776,078 shares of common stock. These warrants were exercisable only following the dissolution, winding-up or change of control of the Company or the repurchase or other acquisition by the Company of all of the Series C Preferred Stock. These warrants had an exercise price of $0.85 per share and a term of five years. On September 30, 2010 and in conjunction with the Recapitalization Agreement, the holders of all of the Series C Warrants exercised such warrants, in accordance with their terms, on a cashless basis for 1,937,420 shares of common stock.
On September 30, 2010 and in conjunction with the Recapitalization Agreement, the Board of Directors of the Company approved, and recommended to the stockholders for approval, a Certificate of Amendment to the Certificate of Incorporation of the Company (the “Certificate of Amendment”) that amended the Certificate of Designation (the “Series D Certificate”) concerning the Company’s Series D Preferred Stock to provide for the automatic conversion of all shares of Series D Preferred Stock into common stock upon the filing of the Certificate of Amendment with the Secretary of State of the State of Delaware. Pegasus IV, as holder of the majority of the Series D Preferred Stock, and, together with LSGC Holdings, the majority holders of the voting power of the Company, approved the Certificate of Amendment. The Company filed the Certificate of Amendment on December 21, 2010. After the Certificate of Amendment was effective, holders of Series D Preferred Stock received between 0.64 to 0.66 shares of common stock for each share of Series D Preferred Stock they held (dependent upon the date of issuance of their Series D Preferred Stock) for a total of 44,072,123 shares of common stock.
F-23
Table of Contents
As of September 30, 2010, pursuant to the terms of the Recapitalization Agreement, the exercise price of certain outstanding warrants adjusted, pursuant to the terms of such warrants, from $6.00 to $1.60 per share of common stock. The number of shares of common stock into which such warrants were exercisable also adjusted, pursuant to the terms of such warrants, from 842,742 to 3,160,281 shares.
6% Convertible Preferred Stock
As of December 31, 2009, there were 196,902 outstanding shares of 6% Convertible Preferred Stock, the conversion price was $6.00 per share and all shares were redeemable on May 10, 2010. In conjunction with the issuance of the 6% Convertible Preferred Stock, warrants were issued to the purchasers of the 6% Convertible Preferred Stock to purchase additional shares of common stock exercisable at the election of the holder. These warrants expired on May 10, 2010.
As of December 31, 2010, 186,528 shares of the 6% Convertible Preferred Stock were redeemed for $597,000. As of December 31, 2010, 10,374 shares of 6% Convertible Preferred Stock were effectively redeemed, but had not been presented for redemption. Upon presentment, the Company will pay $33,000 to redeem these shares and this amount is included in accrued expenses as of December 31, 2010.
Warrants for the Purchase of Common Stock
At December 31, 2010, the Company had the following warrants outstanding for the purchase of common stock:
| Warrant Holder |
Reason for Issuance |
Number of Common Shares |
Exercise Price |
Expiration Date | ||||||||
| Investors in March 2007 Private Placement |
Private Placement A Warrants | 3,160,281 | $ | 1.60 | March 9, 2012 through June 29, 2012 | |||||||
| Pegasus IV |
Guaranty of BMO line of credit | 942,857 | $ | 7.00 | July 25, 2013 | |||||||
| Line of Credit Guarantors |
Financing guarantees | 121,375 | $ | 6.00 | September 22, 2011 through March 31, 2012 | |||||||
| Icurie |
Marketing agreement | 6,250 | $ | 6.40 | September 13, 2011 | |||||||
| Investors in Series D Preferred Stock |
Series D Warrants | 61,929,821 | $ | 6.00 | March 3, 2022 through April 19, 2022 | |||||||
| Phillips Electronics |
Series D Warrants | 5,330,482 | $ | 12.00 | March 3, 2022 | |||||||
| 71,491,066 | ||||||||||||
As of December 31, 2010, all warrants shown in the table above are fully vested.
On February 9, 2011, the Company entered into an Exchange Agreement (the “Exchange Agreement”), effective as of February 9, 2011, with LSGC Holdings pursuant to which, the Company agreed to issue 54,500,000 shares of common stock in exchange for its Series D Warrant to purchase 60,758,777 shares of common stock and its warrant to purchase 942,857 shares of common stock, which was previously issued in connection with the original guaranty of the Company’s line of credit with BMO.
NOTE 12: RELATED PARTY TRANSACTIONS
Effective June 23, 2010, the Company entered into a support services agreement with Pegasus Capital, pursuant to which the Company agreed to pay Pegasus Capital $750,000 as reimbursement for prior financial, strategic planning, monitoring and other related services previously provided by Pegasus Capital. In addition, the Company agreed to pay $187,500 for the next four calendar quarters and $125,000 for each of the four calendar quarters thereafter in exchange for these support services during such periods. Pegasus Capital is an affiliate of Pegasus IV and LSGC Holdings, which are the Company’s largest stockholders and beneficially owned approximately 88.0% of the Company’s common stock as of December 31, 2010.
F-24
Table of Contents
During the years ended December 31, 2010, 2009 and 2008, the Company recorded $1.7 million, $4.7 million and $676,000, respectively, in combined interest expense, guaranty fee expense and transaction fee expense related to Pegasus IV’s promissory notes and guarantee of the BMO facility.
During the year ended December 31, 2010, the Company incurred consulting fees of $379,000 for services provided by MWW Group, which is owned by Michael Kempner, a director of the Company.
In connection with the acquisition of LSGBV in 2008, the Company paid $400,000 to an affiliate of Pegasus Capital for expenses incurred in performing certain due diligence and other activities. These costs have been reflected in the transaction fees associated with the acquisition.
NOTE 13: EQUITY BASED COMPENSATION PLANS
On July 26, 2005, a predecessor company adopted the Lighting Science Group Corporation 2005 Equity-Based Incentive Compensation Plan (the “2005 Plan”), and a proposal to implement such plan was approved at the annual stockholders’ meeting in August 2005. In April 2008, the Company’s Board of Directors amended, restated and renamed the 2005 Plan (the “Equity Plan”), and a proposal to approve the Equity Plan was approved at the annual stockholders’ meeting in October 2008. On August 31, 2009, the Board of Directors approved an amendment to the Equity Plan that among other things increased the total number of shares of common stock available for issuance thereunder from 5,000,000 shares to 20,000,000 shares. Such amendment was subsequently approved at the annual stockholders’ meeting on May 26, 2010. On February 10, 2011, the Board of Directors approved an additional amendment to the Equity Plan that increased the total number of shares of common stock available for issuance thereunder from 20,000,000 shares to 28,000,000 shares. The Company’s Board of Directors intends to submit this Equity Plan amendment to the Company’s stockholders at its next annual meeting.
Awards granted under the Amended and Restated Plan may include incentive stock options, which are qualified under Section 422 of the Internal Revenue Code (the “Code”), stock options other than incentive stock options, which are not qualified under Section 422 of the Code, stock appreciation rights, restricted stock, phantom stock, bonus stock and awards in lieu of obligations, dividend equivalents and other stock-based awards. Awards may be granted to employees, members of the Board of Directors, and consultants. The Equity Plan is generally administered by the Compensation Committee of the Board of Directors. Vesting periods and terms for awards are determined by the plan administrator. The exercise price of each stock option or stock appreciation right is equal to or greater than the market price of the Company’s stock on the date of grant and no stock option or stock appreciation right granted may have a term in excess of ten years.
Stock Option Awards
The following table summarizes stock option activity as of December 31, 2010 and changes during the year then ended:
| Number of Shares |
Weighted Average Exercise Price |
Weighted Average Remaining Contractual Term |
Total Intrinsic Value |
|||||||||||||
| Outstanding as of December 31, 2009 |
9,356,501 | $ | 1.28 | |||||||||||||
| Granted |
7,356,300 | 1.37 | ||||||||||||||
| Exercised |
(358,165 | ) | 0.98 | |||||||||||||
| Forfeited or expired |
(3,600,880 | ) | 1.19 | |||||||||||||
| Outstanding as of December 31, 2010 |
12,753,756 | $ | 1.38 | 8.35 | $ | 24,883,303 | ||||||||||
| Vested or expected to vest as of December 31, 2010 |
7,537,017 | $ | 1.24 | 7.73 | $ | 16,095,853 | ||||||||||
| Exercisable as of December 31, 2010 |
7,537,017 | $ | 1.24 | 7.73 | $ | 16,095,853 | ||||||||||
F-25
Table of Contents
The stock option agreements issued on August 21, 2009 and November 18, 2009 contained a clause whereby all nonvested, outstanding options would become fully vested upon the occurrence of a Capitalization Threshold Event. For purposes of these options a “Capitalization Threshold Event” was deemed to have occurred on the first trading day immediately following any sixty consecutive trading day period during which the Company’s market capitalization, including all issued and outstanding common and preferred stock, exceeded $300.0 million. The Capitalization Threshold Event was deemed to have occurred as of December 31, 2010 and 4,531,875 options vested.
The total intrinsic value in the table above represents the total pretax intrinsic value, which is the total difference between the closing price of the Company’s common stock on December 31, 2010 and the exercise price for each in-the-money option that would have been received by the holders if all instruments had been exercised on December 31, 2010. This value fluctuates with the changes in the price of the Company’s common stock. As of December 31, 2010, there was $5.0 million of unrecognized compensation cost related to unvested stock options, which is expected to be recognized over a weighted average period of 3.35 years.
The following table summarizes information about stock options outstanding and exercisable at December 31, 2010:
| Options Outstanding | Options Exercisable | |||||||||||||||||||
| Range of Exercise Price |
Number | Weighted Average Remaining Contractual Term |
Weighted Average Exercise Price |
Number | Weighted Average Exercise Price |
|||||||||||||||
| $0.600—$1.000 |
9,864,927 | 8.36 | $ | 1.00 | 7,152,527 | $ | 1.00 | |||||||||||||
| $1.010—$2.000 |
1,200,000 | 9.48 | $ | 1.33 | — | $ | — | |||||||||||||
| $2.010—$3.000 |
405,000 | 9.45 | $ | 2.37 | — | $ | — | |||||||||||||
| $3.010—$4.000 |
807,500 | 9.92 | $ | 3.23 | — | $ | — | |||||||||||||
| $4.010—$10.000 |
463,829 | 1.60 | $ | 5.37 | 371,990 | $ | 5.37 | |||||||||||||
| $10.010—$17.400 |
12,500 | 3.59 | $ | 10.80 | 12,500 | $ | 10.80 | |||||||||||||
| Total |
12,753,756 | 8.35 | $ | 1.38 | 7,537,017 | $ | 1.24 | |||||||||||||
Other information pertaining to stock options is as follows:
| For the Years Ended December 31, | ||||||||||||
| 2010 | 2009 | 2008 | ||||||||||
| Weighted average grant date fair value per share of options |
$ | 1.00 | $ | 0.27 | $ | 2.77 | ||||||
| Total intrinsic value of options exercised |
$ | 659,148 | $ | — | $ | — | ||||||
Restricted Stock Awards
In August 2007, a predecessor company entered into a restricted stock agreement with one of its executives under which it may be required to issue up to 250,000 shares of common stock. The restricted stock vested as follows: (i) 25% on award date and (ii) 25% on each anniversary date of the grant. The Company valued the restricted stock grant at $2.7 million, being the value of the shares on the day the agreement was completed. The total cost of the restricted stock grant was recognized in the statement of operations over an estimated period of 2.5 years. In the first quarter of 2009, the executive’s employment with the Company was terminated and the 125,000 unvested shares were forfeited by the executive. For the years ended December 31, 2010, 2009 and 2008, the Company recorded compensation expense related to this restricted stock award of $0, $0 and $386,000, respectively.
In April 2008, the Company issued restricted stock awards to certain of its management staff for a total of 841,250 shares of common stock. The vesting schedule for these restricted stock awards is as follows: (i) 33% of
F-26
Table of Contents
the total awarded shares vest on the first date after the grant date that the Company’s “Recognized Revenue” equals $50 million, (ii) 34% of the awarded shares vest on the first date after the grant date that the Company’s Recognized Revenue is greater than $115 million and (iii) 33% of the awarded shares shall vest on the first day after the grant date that the Company’s Recognized Revenue is greater than $150 million. In any event, all outstanding restricted stock awards will vest on the third anniversary of the grant date. For purposes of the vesting schedule, Recognized Revenue is defined as the cumulative gross revenue generated by (i) sales of products that have been delivered to customers of the Company or one of its subsidiaries, or (ii) licensing of the technology developed by the Company or one of its subsidiaries, since January 1, 2008. For the years ended December 31, 2010, 2009 and 2008, the Company recorded compensation expense related to these restricted stock awards of $(14,000), $2.1 million and $663,000, respectively. The 2009 compensation expense related to restricted stock awards has been revised from amounts previously disclosed by the Company.
A summary of nonvested shares of restricted stock awards (“RSAs”) outstanding under the Company’s Equity Plan as of December 31, 2010 and changes during the year then ended is as follows:
| Number of Shares |
Weighted Average Grant Date Fair Value |
|||||||
| Nonvested as of December 31, 2009 |
722,500 | $ | 2.60 | |||||
| Granted |
— | — | ||||||
| Vested |
(237,498 | ) | 2.59 | |||||
| Forfeited |
(308,334 | ) | 2.51 | |||||
| Nonvested as of December 31, 2010 |
176,668 | $ | 2.77 | |||||
The fair value of the restricted stock that vested during the years ended December 31, 2010 and 2009 was $1.1 million and $0, respectively. As of December 31, 2010, there was no unrecognized compensation cost related to restricted stock granted under the Equity Plan.
Stock–Based Compensation Valuation and Expense
The Company accounts for its stock-based compensation plan using the fair value method. The fair value method requires the Company to estimate the grant date fair value of its stock based awards and amortize this fair value to compensation expense over the requisite service period or vesting term. To estimate the fair value of the Company’s stock-based awards the Company currently uses the Black-Scholes pricing model. The determination of the fair value of stock-based awards on the date of grant using an option- pricing model is affected by the Company’s stock price as well as assumptions regarding a number of complex and subjective variables. These variables include the expected stock price volatility over the term of the awards, actual and projected employee stock option exercise behaviors, the risk-free interest rate and expected dividends. Due to the inherent limitations of option-valuation models available today, including future events that are unpredictable and the estimation process utilized in determining the valuation of the stock-based awards, the ultimate value realized by award holders may vary significantly from the amounts expensed in the Company’s financial statements. For restricted stock awards, grant date fair value is based upon the market price of the Company’s common stock on the date of the grant. This fair value is then amortized to compensation expense over the requisite service period or vesting term.
Stock-based compensation expense is recorded net of estimated forfeitures such that expense is recorded only for those stock-based awards that are expected to vest. A forfeiture rate is estimated at the time of grant and revised, if necessary, in subsequent periods if actual forfeitures differ from initial estimates.
The Company recorded stock option expense of $3.9 million, $1.3 million and $2.1 million for the years ended December 31, 2010, 2009 and 2008, respectively. The 2009 compensation expense related to stock options has been revised from amounts previously disclosed by the Company.
F-27
Table of Contents
The weighted average assumptions used to value stock option grants were as follows:
| For the Years Ended December 31, | ||||||||||||
| 2010 | 2009 | 2008 | ||||||||||
| Stock Option Grants: |
1.33%-2.61 | % | 2.43%-3.52 | % | 1.99 | % | ||||||
| Risk-free interest rate |
0.12-6.25 | 10.0 | 4.0 | |||||||||
| Expected life, in years |
63.4%-86.1 | % | 75.0 | % | 75.0 | % | ||||||
| Expected volatility |
23.0 | % | 0.0 | % | 0.0 | % | ||||||
| Expected forfeiture rate |
||||||||||||
| Dividend yield |
— | — | — | |||||||||
| Calculated fair value per share |
$0.29-$2.28 | $0.28-$0.35 | $2.77 | |||||||||
The following describes each of these assumptions and the Company’s methodology for determining each assumption:
Risk-Free Interest Rate
The Company estimates the risk-free interest rate using the U.S. Treasury bill rate with a remaining term equal to the expected life of the award.
Expected Life
The expected life represents the period that the stock option awards are expected to be outstanding derived using the “simplified” method as allowed under the provisions of the SEC’s Staff Accounting Bulletin No. 107 as the Company does not believe it has sufficient historical data to support a more detailed assessment of the estimate.
Expected Volatility
The Company estimates expected volatility based on the historical volatility of the Company’s common stock and its peers.
Expected Dividend Yield
The Company estimates the expected dividend yield by giving consideration to its current dividend policies as well as those anticipated in the future considering the Company’s current plans and projections.
NOTE 14: RESTRUCTURING EXPENSES
In August 2010, the Company announced restructuring plans to increase efficiencies across the organization and lower the overall cost structure. These plans included the consolidation of the Company’s research and development and product development operations, including its California operations to the Company’s headquarters in Satellite Beach, FL and the restructuring of the European operations from a development and manufacturing business to a sales and marketing business. These restructuring plans included a reduction in full time headcount in the United States and Europe, which was partially completed by December 2010 and is expected to be completed in the first quarter of 2011. For the year ended December 31, 2010, the Company incurred $1.7 million of severance and termination benefits and rent costs as a result of the closing of the California offices and a reduction in workforce and relocation to smaller offices in The Netherlands. These expenses were partially offset by the $601,000 gain on the exit of LEDS Japan, the Company’s Japanese operation.
In the second quarter of 2009, the Company determined it would consolidate U.S. operations from four locations to two and moved both the Dallas, Texas based headquarters and the New Jersey based light engine
F-28
Table of Contents
business to Satellite Beach. In addition, headcount was reduced for the California business. For the year ended December 31, 2010, the Company incurred $950,000, respectively, of costs related to severance and termination benefits related to these headcount reductions.
A summary of the restructuring and other costs recognized for the years ended December 31, 2010 and 2009 are as follows:
| Workforce Reduction |
Excess Facilities |
Other Exit Costs |
Total | |||||||||||||
| Amounts expected to be incurred |
$ | 1,664,062 | $ | 764,718 | $ | 385,243 | $ | 2,814,023 | ||||||||
| Amounts incurred in: |
||||||||||||||||
| 2009 |
702,625 | 408,565 | — | 1,111,190 | ||||||||||||
| 2010 |
961,437 | 356,153 | 385,243 | 1,702,833 | ||||||||||||
| Cumulative amount incurred as of December 31, 2010 |
$ | 1,664,062 | $ | 764,718 | $ | 385,243 | $ | 2,814,023 | ||||||||
These expenses were partially offset by the $601,000 gain on the exit of LEDS Japan, the Company’s Japanese operation. The Company expects to incur additional charges during the first quarter of 2011, as a result of additional reduction in full time headcount.
As of December 31, 2010 and 2009, the accrued liability associated with the restructuring and other related charges consisted of the following:
| Workforce Reduction |
Excess Facilities |
Total | ||||||||||
| 2009 | ||||||||||||
| Charges |
$ | 702,625 | $ | 408,565 | $ | 1,111,190 | ||||||
| Payments |
(100,027 | ) | — | (100,027 | ) | |||||||
| Accrued liability at December 31, 2009 |
602,598 | 408,565 | 1,011,163 | |||||||||
| 2010 | ||||||||||||
| Charges |
961,438 | 356,154 | 1,317,592 | |||||||||
| Payments |
(1,400,259 | ) | (297,412 | ) | (1,697,671 | ) | ||||||
| Accrued liability at December 31, 2010 |
$ | 163,777 | $ | 467,307 | $ | 631,084 | ||||||
The remaining accrual as of December 31, 2010, of $631,084 consists of $497,623, expected to be paid during the year ending December 31, 2011 and $133,461, expected to be paid during the year ending December 31, 2012.
The restructuring and other related charges are included in the line item Restructuring expenses in the consolidated statement of operations.
F-29
Table of Contents
NOTE 15: INCOME TAXES
The components of the consolidated income tax provision (benefit) from continuing operations are as follows:
| For the Years Ended December 31, | ||||||||||||
| 2010 | 2009 | 2008 | ||||||||||
| Loss before taxes |
||||||||||||
| Domestic |
$ | (280,248,240 | ) | $ | (41,270,723 | ) | $ | (92,269,577 | ) | |||
| Foreign |
(16,013,806 | ) | (7,279,206 | ) | (4,901,386 | ) | ||||||
| Total |
$ | (296,262,046 | ) | $ | (48,549,929 | ) | $ | (97,170,963 | ) | |||
| Deferred income tax expense (benefit) |
||||||||||||
| Federal |
$ | — | $ | 1,191,588 | $ | (1,264,436 | ) | |||||
| State |
— | — | — | |||||||||
| Foreign |
(1,123,107 | ) | (1,604,590 | ) | (943,071 | ) | ||||||
| Deferred income tax benefit |
$ | (1,123,107 | ) | $ | (413,002 | ) | $ | (2,207,507 | ) | |||
| Income tax benefit |
$ | (1,123,107 | ) | $ | (413,002 | ) | $ | (2,207,507 | ) | |||
The reconciliation of the provision for income taxes from continuing operations at the United States Federal statutory tax rate of 34% is as follows:
| For the Years Ended December 31, | ||||||||||||
| 2010 | 2009 | 2008 | ||||||||||
| Loss before taxes |
$ | (296,262,046 | ) | $ | (48,549,929 | ) | $ | (97,170,963 | ) | |||
| Income tax benefit applying United States federal statutory rate of 34% |
$ | (100,729,096 | ) | $ | (16,506,976 | ) | $ | (33,038,127 | ) | |||
| State taxes, net of federal benefit |
(1,862,197 | ) | ||||||||||
| Permanent differences |
||||||||||||
| Impairment charges |
— | — | 18,057,445 | |||||||||
| Accretion of preferred stock |
24,846,275 | — | — | |||||||||
| Preferred stock dividends |
1,201,830 | — | — | |||||||||
| Derivative fair value adjustment |
51,189,560 | — | — | |||||||||
| Qualified stock option expense |
754,640 | — | — | |||||||||
| Other |
— | 61,791 | 134,060 | |||||||||
| Increase in valuation allowance |
27,396,343 | 15,992,522 | 12,478,941 | |||||||||
| Change in effective tax rate—United States |
(4,138,374 | ) | — | — | ||||||||
| Change in effective tax rate—foreign |
406,760 | — | — | |||||||||
| Rate difference between United States federal statutory rate and Netherlands statutory rate |
2,241,933 | 577,652 | 355,136 | |||||||||
| Other |
(2,430,781 | ) | (537,991 | ) | (194,962 | ) | ||||||
| Income tax expense (benefit) |
$ | (1,123,107 | ) | $ | (413,002 | ) | $ | (2,207,507 | ) | |||
F-30
Table of Contents
Deferred income taxes reflect the net tax effects of temporary differences between the carrying amounts of assets and liabilities for financial reporting purposes and the amounts used for income tax purposes. The significant components of the Company’s deferred tax assets and liabilities are as follows:
| As of December 31, | ||||||||
| 2010 | 2009 | |||||||
| Deferred income tax assets |
||||||||
| Net operating loss carryforwards |
$ | 62,204,274 | $ | 34,994,946 | ||||
| Net operating loss carryforwards recorded by foreign subsidiary |
2,565,528 | 2,496,279 | ||||||
| Charitable contribution carryforward |
10,348 | — | ||||||
| Stock based compensation |
1,517,591 | 2,108,925 | ||||||
| Inventories |
1,048,025 | 1,627,452 | ||||||
| Accounts receivable |
170,472 | 97,304 | ||||||
| Warranty reserve |
204,942 | — | ||||||
| Accrued vacation |
175,629 | 230,410 | ||||||
| Total deferred income tax assets |
67,896,809 | 41,555,316 | ||||||
| Less: valuation allowance |
(67,896,809 | ) | (40,500,466 | ) | ||||
| Net deferred tax assets |
$ | — | $ | 1,054,850 | ||||
| Deferred income tax liabilities |
||||||||
| Derivatives |
$ | — | $ | (96,879 | ) | |||
| Intangible assets |
— | (2,081,078 | ) | |||||
| Total deferred income tax liabilities |
— | (2,177,957 | ) | |||||
| Net deferred tax liabilities |
$ | — | $ | (1,123,107 | ) | |||
As of December 31, 2010, the Company had tax loss carryforwards available to offset future income taxes, subject to expiration as follows:
| Year of Expiration |
United States Net Operating Tax Loss Carryforwards |
The Netherlands Net Operating Tax Loss Carryforwards |
||||||
| 2012 |
$ | 4,586,864 | $ | — | ||||
| 2016 |
— | 3,869,995 | ||||||
| 2017 |
— | 4,265,206 | ||||||
| 2018 |
13,760,592 | 4,692,440 | ||||||
| 2019 |
2,293,432 | — | ||||||
| 2020 |
1,473,066 | — | ||||||
| 2021 |
2,769,043 | — | ||||||
| 2022 |
1,840,300 | — | ||||||
| 2023 |
2,031,270 | — | ||||||
| 2024 |
3,353,481 | — | ||||||
| 2025 |
2,293,432 | — | ||||||
| 2026 |
2,293,432 | — | ||||||
| 2027 |
9,937,230 | — | ||||||
| 2028 |
33,456,349 | — | ||||||
| 2029 |
33,916,313 | — | ||||||
| 2030 |
51,300,204 | |||||||
| Total |
$ | 165,305,008 | $ | 12,827,641 | ||||
F-31
Table of Contents
At the time of the reverse merger transaction and resulting change in control, the Company had accumulated approximately $75.0 million in loss carryforwards. As a result of the change in control, the Company is limited by Section 382 of the Internal Revenue Code in the amount of loss carryforwards that it may apply to its taxable income in any tax year. These loss carryforwards expire from 2012 through 2030. To the extent the Company is able to utilize available loss carryforwards that arose from operations in tax years prior to September 26, 2003, any benefit realized will be credited to income tax expense. The valuation allowance increased $28.0 million for the current year.
The Company recognizes tax benefits from uncertain tax positions only if it is more likely than not that the tax position will be sustained on examination by the taxing authorities, based on the technical merits of the position. The tax benefits recognized in the financial statements from such positions are measured based on the largest benefit that has a greater than 50% likelihood of being realized upon ultimate settlement. As of December 31, 2010 and 2009, the Company had no unrecognized tax benefits. The Company’s policy is to recognize interest and penalties related to income taxes in its income tax provision. The Company has not accrued or paid interest or penalties which were material to its results of operations for the years ended December 31, 2010, 2009 and 2008. The Company files income tax returns in its U.S. federal jurisdictions and various state jurisdictions.
As of December 31, 2010, the Company’s 2007, 2008 and 2009 federal income tax returns are open to examination by the Internal Revenue Service. The Company’s 2008 federal income tax return is currently being examined by the Internal Revenue Service. Additionally, income tax returns filed in The Netherlands for the years 2009 and 2010 are still open to examination by taxing authorities.
NOTE 16: GEOGRAPHIC INFORMATION
For the years ended December 31, 2010, 2009 and 2008, the Company has determined that the United States and The Netherlands were the only regions from which the Company had in excess of 10% of revenue. The following tables set out the total revenue and total assets of the geographical regions:
| Years Ended December 31, | ||||||||||||
| Total Revenues by Geographical Region |
2010 | 2009 | 2008 | |||||||||
| United States |
$ | 42,223,225 | $ | 18,270,531 | $ | 10,165,476 | ||||||
| The Netherlands |
8,843,899 | 10,428,418 | 2,623,873 | |||||||||
| Other |
2,101,889 | 2,677,867 | 7,969,244 | |||||||||
| $ | 53,169,013 | $ | 31,376,816 | $ | 20,758,593 | |||||||
| As of December 31, | ||||||||
| Total Assets by Geographical Region |
2010 | 2009 | ||||||
| United States |
$ | 64,860,527 | $ | 18,977,612 | ||||
| The Netherlands |
4,675,136 | 19,478,340 | ||||||
| Other |
2,957,700 | 12,862 | ||||||
| $ | 72,493,363 | $ | 38,468,814 | |||||
NOTE 17: CONCENTRATIONS OF CREDIT RISK
For the year ended December 31, 2010, the Company had two customers whose revenue collectively represented 56% of total revenue. For the years ended December 31, 2009 and 2008, the Company had no customers whose revenue was greater than 10 percent of total revenue.
As of December 31, 2010, the Company had two customers whose accounts receivable balance collectively represented 47% of accounts receivables, net of reserves. As of December 31, 2009, the Company had no customers whose accounts receivable balance individually represented 10% or more of accounts receivables, net of reserves.
F-32
Table of Contents
NOTE 18: COMMITMENTS AND CONTINGENCIES
Lease Commitments
As of December 31, 2010, the Company has the following commitments under operating leases for property and equipment for each of the next five years:
| Year |
Amount | |||
| 2011 |
$ | 1,272,003 | ||
| 2012 |
822,976 | |||
| 2013 |
372,082 | |||
| 2014 |
343,106 | |||
| 2015 |
307,695 | |||
| Thereafter |
— | |||
| $ | 3,118,862 | |||
During the years ended December 31, 2010, 2009 and 2008, the Company incurred rent expense of $1.4 million, $1.5 million and $1.1 million, respectively.
Agreements with Contract Manufacturers
The Company currently depends on a small number of contract manufacturers to manufacture its products. If any of these contract manufacturers were to terminate their agreements with the Company or fail to provide the required capacity and quality on a timely basis, the Company may be unable to manufacture and ship products until replacement contract manufacturing services could be obtained.
Other Contingencies
From time to time, the Company may become involved in lawsuits or other legal proceedings, which arise, in the ordinary course of business. However, litigation is subject to inherent uncertainties, and an adverse result in these or other matters may arise from time to time that may harm its business. Management is not currently aware of any such legal proceedings or claims that it believes will have a material adverse effect on the business, financial condition or operating results.
NOTE 19: DEFINED CONTRIBUTION PLAN
The Company has a qualified 401(k) plan (the “401(k) Plan”) covering substantially all employees in the United States. The 401(k) Plan was established under Internal Revenue Code Section 401(k). No contributions were made to the 401(k) Plan for the years ended December 31, 2010, 2009 or 2008. As of January 1, 2011, the Company began matching 50% of the first 6% of employee contributions.
NOTE 20: SUBSEQUENT EVENTS
On January 13, 2011, the Company issued a Warrant to The Home Depot pursuant to which The Home Depot may purchase up to 5.0 million shares of the Company’s common stock at an exercise price of $2.00 per share, subject to certain vesting conditions. The Warrant was issued in connection with the Company’s Strategic Purchasing Agreement with The Home Depot, which it entered into on July 23, 2010 and pursuant to which it supplies The Home Depot with LED retrofit lamps and fixtures. The Warrant provides that 1.0 million shares of common stock will be eligible for vesting following each fiscal year ending December 31, 2011 through December 31, 2015, if The Home Depot’s gross product orders from the Company, in dollar terms, are at least 20% more than the gross product orders in the immediately preceding fiscal year. For the shares underlying the Warrant to be eligible for vesting following the fiscal years ending December 31, 2014 and 2015, The Home
F-33
Table of Contents
Depot would be required to extend the Strategic Purchasing Agreement for additional one-year periods beyond its initial term of three years. Each vested portion of the Warrant will expire on the third anniversary following the vesting of such portion. The $2.00 exercise price was established based upon the market price of the Company’s common stock during negotiations with The Home Depot in July 2010 when the Company entered into the Strategic Purchasing Agreement. The fair value of these warrants will be adjusted at each reporting date until they have been earned for each year and these adjustments will be recorded as a reduction in the related revenues from The Home Depot.
On January 26, 2011, the Company raised $18.0 million in a private placement pursuant to which it issued 5,454,545 shares of common stock to an affiliate of Pegasus Capital, Michael Kempner, Leon Wagner, certain other operating advisors of Pegasus Capital, and certain trusts affiliated with, and business associates of, Mr. Wagner. Mr. Kempner and Mr. Wagner serve on the Company’s Board of Directors.
On February 9, 2011, the Company entered into the Exchange Agreement with LSGC Holdings pursuant to which the Company agreed to issue 54,500,000 shares of common stock in exchange for its Series D Warrant to purchase 60,758,777 shares of common stock and its warrant to purchase 942,857 shares of common stock, which was previously issued in connection with the original guaranty of the Company’s line of credit with BMO.
F-34
Table of Contents
Through and including , 2011 (25 days after the date of this prospectus), all dealers that buy, sell or trade our common stock, whether or not participating in this offering, may be required to deliver a prospectus. This delivery requirement is in addition to the obligation of dealers to deliver a prospectus when acting as underwriters and with respect to their unsold allotments or subscriptions.
Shares
Common Stock
PROSPECTUS
| Credit Suisse | J.P.Morgan |
| Stifel Nicolaus Weisel | Moelis & Company | Piper Jaffray |
, 2011
Table of Contents
Part II
Information Not Required in Prospectus
| Item 13. | Other Expenses of Issuance and Distribution. |
The following table sets forth all costs and expenses, other than the underwriting discounts and commissions payable by us, in connection with the offer and sale of the securities being registered. All amounts shown are estimates except for the SEC registration fee and the Financial Industry Regulatory Authority, Inc., or FINRA, filing fee.
| SEC registration fee |
$ | 17,415 | ||
| FINRA filing fee |
$ | 15,500 | ||
| Printing expenses |
$ | |||
| Legal fees and expenses |
$ | |||
| Accounting fees and expenses |
$ | |||
| Miscellaneous expenses |
$ | |||
| Total expenses |
$ | |||
| Item 14. | Indemnification of Directors and Officers. |
Section 102(b)(7) of the General Corporation Law of the State of Delaware (the “DGCL”) allows a corporation to provide in its certificate of incorporation that a director of the corporation will not be personally liable to the corporation or its stockholders for monetary damages for breach of fiduciary duty as a director, except where the director breached the duty of loyalty, failed to act in good faith, engaged in intentional misconduct or knowingly violated a law, authorized the payment of a dividend or approved a stock repurchase in violation of Delaware corporate law or obtained an improper personal benefit. Our certificate of incorporation provides for this limitation of liability.
Section 145 of the DGCL (“Section 145”) provides that a Delaware corporation may indemnify any person who was, is or is threatened to be made, party to any threatened, pending or completed action, suit or proceeding, whether civil, criminal, administrative or investigative (other than an action by or in the right of such corporation), by reason of the fact that such person is or was an officer, director, employee or agent of such corporation or is or was serving at the request of such corporation as a director, officer, employee or agent of another corporation or enterprise. The indemnity may include expenses (including attorneys’ fees), judgments, fines and amounts paid in settlement actually and reasonably incurred by such person in connection with such action, suit or proceeding, provided such person acted in good faith and in a manner he reasonably believed to be in or not opposed to the corporation’s best interests and, with respect to any criminal action or proceeding, had no reasonable cause to believe that his conduct was illegal. A Delaware corporation may indemnify any persons who are, or were, a party to any threatened, pending or completed action or suit by or in the right of the corporation by reason of the fact that such person is or was a director, officer, employee or agent of another corporation or enterprise. The indemnity may include expenses (including attorneys’ fees) actually and reasonably incurred by such person in connection with the defense or settlement of such action or suit, provided such person acted in good faith and in a manner he reasonably believed to be in or not opposed to the corporation’s best interests, provided that no indemnification is permitted without judicial approval if the officer, director, employee or agent is adjudged to be liable to the corporation. Where an officer or director is successful on the merits or otherwise in the defense of any action referred to above, the corporation must indemnify him against the expenses which such officer or director has actually and reasonably incurred.
Section 145 further authorizes a corporation to purchase and maintain insurance on behalf of any person who is or was a director, officer, employee or agent of the corporation or is or was serving at the request of the
II-1
Table of Contents
corporation as a director, officer, employee or agent of another corporation or enterprise, against any liability asserted against him and incurred by him in any such capacity, or arising out of his status as such, whether or not the corporation would otherwise have the power to indemnify him under Section 145.
Our bylaws provide that we will indemnify our directors and officers to the fullest extent authorized by the DGCL and must also pay expenses incurred in defending any such proceeding in advance of its final disposition upon delivery of an undertaking, by or on behalf of an indemnified person, to repay all amounts so advanced if it should be determined ultimately that such person is not entitled to be indemnified under this section or otherwise.
The indemnification rights set forth above shall not be exclusive of any other right which an indemnified person may have or hereafter acquire under any statute, provision of our certificate of incorporation or bylaws, agreement, vote of stockholders or disinterested directors or otherwise.
We maintain a general liability insurance policy that covers certain liabilities of directors and officers of our corporation arising out of claims based on acts or omissions in their capacities as directors or officers.
In the underwriting agreement we enter into in connection with the sale of common stock being registered hereby, the underwriters will agree to indemnify, under certain conditions, us, our directors, our officers and persons who control us with the meaning of the Securities Act against certain liabilities.
| Item 15. | Recent Sales of Unregistered Securities. |
Set forth below is information regarding all securities sold by us within the past three years. Also included is the consideration, if any, received by us for such shares, options and warrants and information relating to the section of the Securities Act, or rule of the SEC, under which exemption from registration was claimed.
Issuances During Fiscal Year 2008
| 1. | On February 5, 2008, we issued a total of 5,436 shares of common stock to our outside directors in settlement of director fees for the third quarter of 2007. These shares of common stock were issued pursuant to the exemption from registration provided by Section 4(2) of the Securities Act and the safe harbors for sales provided by Regulation D promulgated thereunder. |
| 2. | On February 5, 2008, we issued 2,143 shares of common stock to an employee in settlement of $15,000 owed pursuant to the employee’s employment contract. These shares of common stock were issued pursuant to the exemption from registration provided by Section 4(2) of the Securities Act. |
| 3. | On February 13, 2008, we issued 93,751 shares of common stock to two warrant holders upon the exercise of such warrants. These shares of common stock were issued pursuant to the exemption from registration provided by Section 4(2) of the Securities Act and the safe harbors for sales provided by Regulation D promulgated thereunder. |
| 4. | On February 13, 2008, we issued 10,000 shares of common stock upon conversion of 18,700 shares of our 6% Convertible Preferred Stock. These shares of common stock were issued pursuant to the exemption from registration provided by Section 3(a)(9) of the Securities Act. |
| 5. | On April 22, 2008, we issued an aggregate of 2,083,333 shares of common stock to LED Holdings, LLC for an aggregate price of $10,000,000. These shares of common stock were issued pursuant to the exemption from registration provided by Section 4(2) of the Securities Act and the safe harbors for sales provided by Regulation D promulgated thereunder. |
| 6. | On April 22, 2008, we issued 4,632,000 shares of common stock as partial consideration in the acquisition of Lighting Partner, B.V. (“LPBV”). These shares of common stock were issued to the former shareholders of LPBV pursuant to the exemption from registration provided by Section 4(2) of the Securities Act and the safe harbors for sales provided by Regulation D promulgated thereunder. |
II-2
Table of Contents
| 7. | On April 22, 2008, we issued 5,860 shares of common stock to a warrant holder upon the exercise of such warrants. These shares of common stock were issued pursuant to the exemption from registration provided by Section 4(2) of the Securities Act and the safe harbors for sales provided by Regulation D promulgated thereunder. |
| 8. | On April 30, 2008, we issued a total of 1,780 shares of common stock to two warrant holders upon the exercise of such warrants. These shares of common stock were issued pursuant to the exemption from registration provided by Section 4(2) of the Securities Act and the safe harbors for sales provided by Regulation D promulgated thereunder. |
| 9. | On June 18, 2008, we issued a total of 44,660 shares of common stock to our outside directors in settlement of director fees for the fourth quarter of 2007 and first quarter of 2008. These shares of common stock were issued pursuant to the exemption from registration provided by Section 4(2) of the Securities Act and the safe harbors for sales provided by Regulation D promulgated thereunder. |
| 10. | On June 18, 2008, we issued 2,393 shares of common stock to a former employee in a private placement in settlement of her final pay. These shares of common stock were issued pursuant to the exemption from registration provided by Section 4(2) of the Securities Act and the safe harbors for sales provided by Regulation D promulgated thereunder. |
| 11. | On July 25, 2008, we issued Pegasus Partners IV, L.P. (“Pegasus IV”) a warrant to purchase 942,857 shares of common stock at an exercise price of $7.00 per share as consideration for providing a guaranty to enable us to obtain a line of credit with one of our lending institutions. The warrant expires on July 29, 2013. The warrant was issued pursuant to the exemption from registration provided by Section 4(2) of the Securities Act and the safe harbors for sales provided by Regulation D promulgated thereunder. |
| 12. | On August 25, 2008, we issued a total of 24,423 shares of common stock to our outside directors in settlement of director fees for the second quarter of 2008. These shares of common stock were issued pursuant to the exemption from registration provided by Section 4(2) of the Securities Act and the safe harbors for sales provided by Regulation D promulgated thereunder. |
| 13. | On November 11, 2008, we issued a total of 59,073 shares of common stock to our outside directors in settlement of director fees for the third quarter of 2008. These shares of common stock were issued pursuant to the exemption from registration provided by Section 4(2) of the Securities Act and the safe harbors for sales provided by Regulation D promulgated thereunder. |
| 14. | On December 31, 2008, we issued an aggregate of 251,739 shares of Series C Preferred Stock and Warrants (the “Series C Warrants”) to purchase an aggregate of 3,776,078 shares of common stock at an exercise price of $0.85 per share to two of our law firms in consideration for services rendered. The Series C Warrants have a term of five years and are exercisable only following the dissolution, winding-up or change of control of the Company or the repurchase or other acquisition by the Company of all of the Series C Preferred Stock. The shares of Series C Preferred Stock and Series C Warrants were issued pursuant to the exemption from registration provided by Section 4(2) of the Securities Act and the safe harbors for sales provided by Regulation D promulgated thereunder. |
Issuances During Fiscal Year 2009
| 15. | On March 20, 2009, we issued a total of 237,692 shares of common stock to our outside directors in settlement of director fees for the fourth quarter of 2008. These shares of common stock were issued pursuant to the exemption from registration provided by Section 4(2) of the Securities Act and the safe harbors for sales provided by Regulation D promulgated thereunder. |
| 16. | On May 15, 2009, we entered into a Convertible Note Agreement with Pegasus IV (the “Pegasus Convertible Note”), which provided us with approximately $31,650,000. Pursuant to the Pegasus Convertible Note, upon the consummation of a rights offering, each $1.006 of outstanding principal |
II-3
Table of Contents
| and interest owed to Pegasus IV would automatically convert into one unit (a “Series D Unit”) consisting of: (i) one share of Series D Non-Convertible Preferred Stock (“Series D Preferred Stock”) and (ii) a Warrant (a “Series D Warrant”) to purchase one share of our common stock at an exercise price of $6.00. The Pegasus Convertible Note was issued pursuant to the exemption from registration provided by Section 4(2) of the Securities Act and the safe harbors for sales provided by Regulation D promulgated thereunder. |
| 17. | On August 27, 2009, we entered into a new Convertible Note Agreement (the “New Pegasus Convertible Note”) with Pegasus IV in the principal amount of $32,846,619. Pursuant to the New Pegasus Convertible Note, upon the consummation of a rights offering, each $1.006 of outstanding principal and interest owed to Pegasus IV would automatically convert into one Series D Unit. The New Pegasus Convertible Note replaced the Pegasus Convertible Note and was issued pursuant to the exemption from registration provided by Section 4(2) of the Securities Act and the safe harbors for sales provided by Regulation D promulgated thereunder. |
| 18. | On August 27, 2009, we entered into the Convertible Note Agreement (the “Philips Convertible Note”) with Koninklijke Philips Electronics N.V. (“Philips”), pursuant to which we borrowed $5,000,000. Pursuant to the Philips Convertible Note, upon the consummation of a rights offering, each $1.006 of outstanding principal and interest owed to Philips would automatically convert into one Series D Unit consisting of: (i) one share of our Series D Preferred Stock and (ii) a Series D Warrant to purchase one share of our common stock at an exercise price of $12.00. The Philips Convertible Note was issued pursuant to the exemption from registration provided by Section 4(2) of the Securities Act and the safe harbors for sales provided by Regulation D promulgated thereunder. |
| 19. | On September 11, 2009, we issued a total of 393,666 shares of common stock to our outside directors in settlement of director fees for the first and second quarters of 2009. These shares were issued pursuant to the exemption from registration provided by Section 4(2) of the Securities Act and the safe harbors for sales provided by Regulation D promulgated thereunder. |
| 20. | On November 14, 2009, we issued a total of 185,983 shares of common stock to our outside directors in settlement of director fees for the third quarter of 2009. These shares were issued pursuant to the exemption from registration provided by Section 4(2) of the Securities Act and the safe harbors for sales provided by Regulation D promulgated thereunder. |
| 21. | During 2009, we issued 8,108 shares of our common stock to certain employees under the 2008 Employee Stock Purchase Plan (the “2008 ESPP”) at prices ranging from $0.43 to $1.44 per share. These shares were issued pursuant to the exemption from registration provided by Section 4(2) of the Securities Act. |
Issuances During Fiscal Year 2010
| 22. | On January 1, 2010, we issued a total of 149,737 shares of common stock to our outside directors in settlement of director fees for the fourth quarter of 2009. These shares were issued pursuant to the exemption from registration provided by Section 4(2) of the Securities Act and the safe harbors for sales provided by Regulation D promulgated thereunder. |
| 23. | On March 3, 2010, in connection with the consummation of our rights offering, we issued 35,017,667 Series D Units to Pegasus IV in satisfaction of approximately $35,200,000 in principal and accrued interest owed to Pegasus IV pursuant to the New Pegasus Convertible Note. These Series D Units were issued pursuant to the exemption from registration provided by Section 3(a)(9) of the Securities Act. |
| 24. | On March 3, 2010, in connection with the consummation of our rights offering, we issued 5,330,482 Series D Units to Philips in satisfaction of approximately $5,400,000 in principal and accrued interest owed to Philips pursuant to the Philips Convertible Note. The Series D Warrant underlying the Series D Units issued to Pegasus had an exercise price of $12.00 per share. These Series D Units were issued pursuant to the exemption from registration provided by Section 3(a)(9) of the Securities Act. |
II-4
Table of Contents
| 25. | On April 19, 2010, we issued 24,097,148 Series D Units to Pegasus IV and 869,777 Series D Units to certain of Pegasus IV’s assignees pursuant to a standby purchase option previously granted to Pegasus IV in the New Pegasus Convertible Note. These Series D Units were issued pursuant to the exemption from registration provided by Section 4(2) of the Securities Act and the safe harbors for sales provided by Regulation D promulgated thereunder. |
| 26. | On April 20, 2010, we issued 1,555,860 Series D Units to Pegasus IV in satisfaction of a guaranty fee of $1,565,195 payable pursuant to a Guaranty Extension Agreement with Pegasus IV. These Series D Units were issued pursuant to the exemption from registration provided by Section 4(2) of the Securities Act and the safe harbors for sales provided by Regulation D promulgated thereunder. |
| 27. | On April 23, 2010, we issued a total of 640,000 shares of common stock to our outside directors in settlement of director fees for 2010. These shares were issued pursuant to the exemption from registration provided by Section 4(2) of the Securities Act and the safe harbors for sales provided by Regulation D promulgated thereunder. |
| 28. | On June 23, 2010, we issued 235,295 units (“Series E Units”), with each Series E Unit consisting of: (i) one share of Series E Non-Convertible Preferred Stock (“Series E Preferred Stock”) and (ii) a warrant (the “Series E Warrant”) representing the right to purchase 50 shares of common stock at an exercise price of $7.00 per share. The Series E Units were sold for $127.50 per Series E Unit for an aggregate purchase price of $30,000,112.50. These Series E Units were issued pursuant to the exemption from registration provided by Section 4(2) of the Securities Act and the safe harbors for sales provided by Regulation D promulgated thereunder. |
| 29. | On July 9, 2010, we issued 88,102 Series D Units to Pegasus IV in satisfaction of an accrued portion of a guaranty fee payable to Pegasus IV. These Series D Units were issued pursuant to the exemption from registration provided by Section 4(2) of the Securities Act and the safe harbors for sales provided by Regulation D promulgated thereunder. |
| 30. | On July 14, 2010, we issued 50,000 shares of common stock to a consultant in accordance with the terms of our consulting agreement. These shares were issued pursuant to the exemption from registration provided by Section 4(2) of the Securities Act. |
| 31. | On July 19, 2010, we issued 16,000 shares of common stock to Huibrecht Kodde. These shares were issued in connection with our previous acquisition of Lighting Partner B.V. in 2008 and specifically in consideration of Mr. Kodde’s termination of the United States distributorship of certain products of Lighting Partner B.V. These shares were issued pursuant to the exemption from registration provided by Section 4(2) of the Securities Act. |
| 32. | On September 30, 2010, we issued LSGC Holdings 12,500,000 shares of common stock and an option to purchase an additional 3,125,000 shares of common stock exercisable at a price of $1.60 per share for an aggregate purchase price of $20,000,000. These shares of common stock and the option were each issued pursuant to the exemption from registration provided by Section 4(2) of the Securities Act and the safe harbors for sales provided by Regulation D promulgated thereunder. |
| 33. | On September 30, 2010, Pegasus IV and Govi Rao exercised their 3,605,316 and 176,739 Series C Warrants, respectively, on a cashless basis pursuant to the terms of the Series C Warrants for 1,846,882 and 90,538 shares of common stock, respectively. Such shares underlying the Series C Warrants were each exempt from registration under the Securities Act, pursuant to an exemption from registration in accordance with Section 3(a)(9) of the Securities Act. |
| 34. | On September 30, 2010, we exchanged all of our outstanding shares of Series B Preferred Stock, Series C Preferred Stock, Series E Preferred Stock and the Series E Warrant for 32,612,249 shares of common stock. These shares of common stock were issued pursuant to the exemption from registration provided by Section 3(a)(9) of the Securities Act. |
II-5
Table of Contents
| 35. | On October 6, 2010, LSGC Holdings exercised its option to purchase 3,125,000 shares of common stock for $5,000,000. These shares of common stock were issued pursuant to the exemption from registration provided by Section 4(2) of the Securities Act and the safe harbors for sales provided by Regulation D promulgated thereunder. |
| 36. | On December 21, 2010, we issued 17,333 shares of our common stock to one of our outside directors as pro-rata settlement of director fees for 2010. These shares were issued pursuant to the exemption from registration provided by Section 4(2) of the Securities Act and the safe harbors for sales provided by Regulation D promulgated thereunder. |
| 37. | On December 21, 2010, we issued 44,072,123 shares of our common stock in exchange for all of our 67,260,303 outstanding shares of Series D Preferred Stock. These shares of common stock were issued pursuant to the exemption from registration provided by section 3(a)(9) of the Securities Act. |
| 38. | During 2010, we issued 6,047 shares of our common stock to certain employees under the 2008 ESPP at prices ranging from $0.82 to $3.28 per share. These shares of common stock were issued pursuant to the exemption from registration provided by Section 4(2) of the Securities Act. |
| Item 16. | Exhibits and Financial Statement Schedules. |
| (a) | Exhibits |
The exhibit index attached hereto is incorporated herein by reference.
| (b) | Financial Statement Schedules |
No financial statement schedules are provided because the information called for is not applicable or is shown in the financial statements or notes.
| Item 17. | Undertakings. |
Insofar as indemnification for liabilities arising under the Securities Act of 1933 may be permitted to directors, officers and controlling persons of the registrant pursuant to the foregoing provisions, or otherwise, the registrant has been advised that, in the opinion of the Securities and Exchange Commission, such indemnification is against public policy as expressed in the Securities Act and is, therefore, unenforceable. In the event that a claim for indemnification against such liabilities (other than the payment by the registrant of expenses incurred or paid by a director, officer or controlling person of the registrant in the successful defense of any action, suit or proceeding) is asserted by such director, officer or controlling person in connection with the securities being registered, the registrant will, unless in the opinion of its counsel the matter has been settled by controlling precedent, submit to a court of appropriate jurisdiction the question whether such indemnification by it is against public policy as expressed in the Securities Act and will be governed by the final adjudication of such issue.
The undersigned registrant hereby undertakes that:
(1) For purposes of determining any liability under the Securities Act of 1933, the information omitted from the form of prospectus filed as part of this registration statement in reliance upon Rule 430A and contained in a form of prospectus filed by the registrant pursuant to Rule 424(b)(1) or (4) or 497(h) under the Securities Act shall be deemed to be part of this registration statement as of the time it was declared effective.
(2) For purposes of determining any liability under the Securities Act of 1933, each post-effective amendment that contains a form of prospectus shall be deemed to be a new registration statement relating to the securities offered therein, and the offering of such securities at that time shall be deemed to be the initial bona fide offering thereof.
(3) For the purpose of determining liability under the Securities Act of 1933 to any purchaser, each prospectus filed pursuant to Rule 424(b) as part of a registration statement relating to an offering, other than registration statements relying on Rule 430B or other than prospectuses filed in reliance on Rule 430A, shall be
II-6
Table of Contents
deemed to be part of and included in the registration statement as of the date it is first used after effectiveness. Provided, however, that no statement made in a registration statement or prospectus that is part of the registration statement or made in a document incorporated or deemed incorporated by reference into the registration statement or prospectus that is part of the registration statement will, as to a purchaser with a time of contract of sale prior to such first use, supersede or modify any statement that was made in the registration statement or prospectus that was part of the registration statement or made in any such document immediately prior to such date of first use.
(4) For the purpose of determining liability of the registrant under the Securities Act of 1933 to any purchaser in the initial distribution of the securities, in a primary offering of securities of the undersigned registrant pursuant to this registration statement, regardless of the underwriting method used to sell the securities to the purchaser, if the securities are offered or sold to such purchaser by means of any of the following communications, the undersigned registrant will be a seller to the purchaser and will be considered to offer or sell such securities to such purchaser:
(i) Any preliminary prospectus or prospectus of the undersigned registrant relating to the offering required to be filed pursuant to Rule 424;
(ii) Any free writing prospectus relating to the offering prepared by or on behalf of the undersigned registrant or used or referred to by the undersigned registrant;
(iii) The portion of any other free writing prospectus relating to the offering containing material information about the undersigned registrant or its securities provided by or on behalf of the undersigned registrant; and
(iv) Any other communication that is an offer in the offering made by the undersigned registrant to the purchaser.
II-7
Table of Contents
SIGNATURES
Pursuant to the requirements of the Securities Act of 1933, the registrant has duly caused this registration statement to be signed on its behalf by the undersigned, thereunto duly authorized in the City of Satellite Beach, State of Florida, on April 20, 2011.
| LIGHTING SCIENCE GROUP CORPORATION |
| /s/ Richard Weinberg |
| Richard Weinberg Chief Executive Officer |
Pursuant to the requirements of the Securities Act of 1933, as amended, this Registration Statement has been signed by the following persons in the capacities indicated on the 20th day of April 2011.
| Signature |
Capacity in which Signed | |
| /s/ Richard Weinberg Richard Weinberg |
Chairman and Chief Executive Officer (Principal Executive Officer) | |
| /s/ Gregory T. Kaiser Gregory T. Kaiser |
Chief Financial Officer (Principal Financial Officer and Principal Accounting Officer) | |
| * Charles Darnell |
Vice Chairman | |
| * Donald R. Harkleroad |
Vice Chairman | |
| * Robert E. Bachman |
Director | |
| * David Bell |
Director | |
| * Michael Kempner |
Director | |
| * Leon Wagner |
Director | |
| *By: | /s/ Gregory T. Kaiser. | |
| Gregory T. Kaiser | ||
| Attorney-in-Fact | ||
II-8
Table of Contents
EXHIBIT INDEX
| EXHIBIT NUMBER |
DESCRIPTION | |
| 1.1 | Form of Underwriting Agreement. | |
| 3.1 | Amended and Restated Certificate of Incorporation of Lighting Science Group Corporation (previously filed as Exhibit 3.1 to the Quarterly Report on Form 10-Q filed on October 14, 2009, File No. 0-20354, and incorporated herein by reference). | |
| 3.2 | Amended and Restated Bylaws of Lighting Science Group Corporation (previously filed as Exhibit 3.1 to the Current Report on Form 8-K filed on December 28, 2010, File No. 0-20354, and incorporated herein by reference). | |
| 3.3 | Certificate of Elimination of the Certificates of Designations of Preferred Stock filed with the Secretary of State of Delaware on April 5, 2011 (previously filed as Exhibit 3.1 to the Current Report on Form 8-K filed on April 5, 2011, File No. 0-20354, and incorporated herein by reference). | |
| 4.1 | Form of Warrant A, dated March 9, 2007 (previously filed as Exhibit 10.2 to the Current Report on Form 8-K filed on March 12, 2007, File No. 0-20354, and incorporated herein by reference). | |
| 4.2 | Amended and Restated Registration Rights Agreement, dated April 22, 2008, among Lighting Science Group Corporation, C. van de Vrie Holding B.V., W. van de Vrie Holding B.V., R.Q. van de Vrie Holding B.V. and Q. van de Vrie Jr. Holding B.V., Y.B. van de Vrie Holding B.V. and LED Holdings, LLC (previously filed as Exhibit 4.1 to the Current Report on Form 8-K filed on April 24, 2008, File No.0-20354, and incorporated by reference). | |
| 4.3 | Amended and Restated Registration Rights Agreement, dated as of January 23, 2009 between Lighting Science Group Corporation and Pegasus Partners IV, L.P. (previously filed as Exhibit 4.1 to the Current Report on Form 8-K filed on January 30, 2009, File No. 0-20354, and incorporated herein by reference). | |
| 4.4 | Specimen Common Stock Certificate (previously filed as Exhibit 4.14 to Amendment No. 1 to the Registration Statement on Form S-1 filed on January 12, 2010, File No. 333-162966, and incorporated herein by reference). | |
| 4.5 | Warrant Agreement, dated as of December 22, 2010 among Lighting Science Group Corporation and American Stock Transfer & Trust Company, LLC (previously filed as Exhibit 4.1 to the Current Report on Form 8-K filed on January 4, 2011, File No. 0-20354, and incorporated herein by reference). | |
| 4.6 | Warrant to Purchase Common Stock of Lighting Science Group Corporation, dated January 13, 2011 and issued to The Home Depot, Inc. (previously filed as Exhibit 4.1 to the Current Report on Form 8-K filed on January 20, 2011, File No. 0-20354, and incorporated herein by reference). | |
| 4.7 | Registration Rights Agreement, dated January 14, 2011 between Lighting Science Group Corporation and The Home Depot, Inc. (previously filed as Exhibit 4.2 to the Current Report on Form 8-K filed on January 20, 2011, File No. 0-20354, and incorporated herein by reference). | |
| 5.1# | Opinion of Haynes and Boone, LLP. | |
| 10.1 | Amended and Restated Equity Based Compensation Plan (previously filed as Appendix A to the Proxy Statement on Schedule 14A filed on September 18, 2008, File No. 0-20354 and incorporated herein by reference). | |
| 10.2 | Amendment to the Lighting Science Group Corporation Amended and Restated Equity-Based Compensation Plan dated August 21, 2009 (previously filed as Exhibit 10.4 to the Current Report on Form 8-K filed on August 27, 2009, File No. 0-20354, and incorporated herein by reference). | |
| 10.3 | Form of Lighting Science Group Corporation 2005 Equity-Based Compensation Plan Stock Option Agreement (previously filed as Exhibit 4.13 to the Registration Statement on Form S-8 filed on May 5, 2008, File No. 0-20354, and incorporated herein by reference). | |
| 10.4 | Form of Lighting Science Group Corporation 2005 Equity-Based Compensation Plan Employee Incentive Stock Option Agreement, (previously filed as Exhibit 4.14 to the Registration Statement on Form S-8 filed on May 5, 2008, File No. 0-20354, and incorporated herein by reference). | |
II-9
Table of Contents
| EXHIBIT NUMBER |
DESCRIPTION | |
| 10.5 | Form of Lighting Science Group Corporation 2005 Equity-Based Compensation Plan Restricted Stock Award Agreement (previously filed as Exhibit 4.15 to the Registration Statement on Form S-8 filed on May 5, 2008, File No. 0-20354, and incorporated herein by reference). | |
| 10.6 | Form of Lighting Science Group Corporation Amended and Restated Equity-Based Compensation Plan Nonqualified Stock Option Agreement (previously filed as Exhibit 10.5 to the Current Report on Form 8-K filed on August 27, 2009, File No. 0-20354, and incorporated herein by reference). | |
| 10.7 | Form of Lighting Science Group Corporation Amended and Restated Equity-Based Compensation Incentive Stock Option Agreement (previously filed as Exhibit 10.6 to the Current Report on Form 8-K filed on August 27, 2009, File No. 0-20354, and incorporated herein by reference). | |
| 10.8 | Governing Agreement and Complete Releases, dated August 27, 2009, among Lighting Science Group Corporation, LED Holdings, LLC, LED Effects, Inc., Pegasus Capital Advisors, L.P., Pegasus Partners IV, L.P., Philips Electronics North America Corporation, Philips Solid-State Lighting Solutions, Inc. and Koninklijke Philips Electronics N.V. (previously filed as Exhibit 10.1 to the Current Report on Form 8-K filed on August 28, 2009, File No. 0-20354, and incorporated herein by reference). | |
| 10.9 | Support Services Agreement, dated as of June 23, 2010, between Lighting Science Group Corporation and Pegasus Capital Advisors, L.P. (previously filed as Exhibit 10.3 to the Current Report on Form 8-K filed on June 29, 2010, File No. 0-20354, and incorporated herein by reference). | |
| 10.10 | Stock Purchase, Exchange and Recapitalization Agreement, dated as of September 30, 2010, among Lighting Science Group Corporation and Pegasus Partners IV, L.P., LSGC Holdings LLC, and LED Holdings, LLC. (previously filed as Exhibit 10.1 to the Current Report on Form 8-K filed on October 6, 2010, File No. 0-20354, and incorporated herein by reference). | |
| 10.11 | Loan and Security Agreement, dated as of November 22, 2010, among Lighting Science Group Corporation, Biological Illumination, LLC, LSGC, LLC and Wells Fargo Bank, National Association, in its capacity as issuing bank and agent (previously filed as Exhibit 10.1 to the Current Report on Form 8-K filed on November 29, 2010, File No. 0-20354, and incorporated herein by reference). | |
| 10.12 | Subscription Agreement, dated as of January 26, 2011, between Lighting Science Group Corporation and each of the Purchasers (previously filed as Exhibit 10.1 to the Current Report on Form 8-K filed on January 28, 2011, File No. 0-20354, and incorporated herein by reference). | |
| 10.13 | Exchange Agreement, dated as of February 9, 2011, between Lighting Science Group Corporation and LSGC Holdings LLC (previously filed as Exhibit 10.1 to the Current Report on Form 8-K filed on February 10, 2011, File No. 0-20354, and incorporated herein by reference). | |
| 10.14 | Amendment to the Lighting Science Group Corporation Amended and Restated Equity-Based Compensation Plan dated February 10, 2011 (previously filed as Exhibit 4.10 to the Registration Statement on Form S-8 filed on February 25, 2011, File No. 333-172461, and incorporated herein by reference). | |
| 10.15 | Lighting Science Group Corporation 2011 Employee Stock Purchase Plan (previously filed as Exhibit 4.8 to the Registration Statement on Form S-8 filed on February 5, 2011, File No. 333-172466, and incorporated herein by reference). | |
| 10.16 | Employment Letter, dated March 30, 2011 but effective as of February 10, 2011, between Lighting Science Group Corporation and Fredric Maxik (previously filed as Exhibit 10.1 to the Current Report on Form 8-K filed on April 5, 2011, File No. 0-20354, and incorporated herein by reference). | |
| 10.17 | Employment Letter, dated March 30, 2011 but effective February 10, 2011, between Lighting Science Group Corporation and John Stanley (previously filed as Exhibit 10.2 to the Current Report on Form 8-K filed on April 5, 2011, File No. 0-20354, and incorporated herein by reference). | |
| 10.18 | Employment Letter, dated March 30, 2011 but effective as of February 10, 2011, between Lighting Science Group Corporation and Gregory Kaiser (previously filed as Exhibit 10.3 to the Current Report on Form 8-K filed on April 5, 2011, File No. 0-20354, and incorporated herein by reference). | |
II-10
Table of Contents
| EXHIBIT NUMBER |
DESCRIPTION | |
| 21.1 | Subsidiaries of Lighting Science Group Corporation (previously filed as Exhibit 21.1 to the Annual Report on Form 10-K filed on April 1, 2011, File No. 0-20354, and incorporated herein by reference). | |
| 23.1† | Consent of McGladrey & Pullen, LLP. | |
| 23.3# | Consent of Haynes and Boone, LLP (included in Exhibit 5.1). | |
| 24.1* | Power of Attorney. | |
| * | Previously filed. |
| † | Filed herewith. |
| + | Confidential treatment has been granted with respect to certain provisions of this agreement. |
| # | To be filed by amendment. |
II-11