Attached files
| file | filename |
|---|---|
| EX-99.1 - EX-99.1 - DORAL FINANCIAL CORP | g26918exv99w1.htm |
| 8-K - FORM 8-K - DORAL FINANCIAL CORP | g26918e8vk.htm |
EXHIBIT 99.2

| Doral Financial Corporation Q1 Investor Presentation April 2011 |

| Disclaimer 2 This presentation may include forward-looking statements as defined in the Private Securities Litigation Reform Act of 1995 (the "PSLRA"). These include comments with respect to our objectives and strategies, and the results of our operations and our business. Forward-looking statements can be identified by the fact that they do not relate strictly to historical or current facts. They often include words such as "expects," "anticipates," "intends," "plans," "believes," "seeks," "estimates," or words of similar meaning, or future or conditional verbs such as "will," "would," "should," "could" or "may." We intend these forward-looking statements to be covered by the safe harbor provisions of the PSLRA. Forward-looking statements provide our expectations or predictions of future conditions, events or results. They are, by their nature, subject to risks and uncertainties. They are not guarantees of future performance, and actual results may differ materially. By their nature, these forward-looking statements involve numerous assumptions and uncertainties, both general and specific, including those discussed in Doral Financial Corporation's 2010 Annual Report on Form 10-K and other filings we make with the Securities and Exchange Commission. Risk factors and uncertainties that could cause the Company's actual results to differ materially from those described in forward-looking statements can be found in the Company's 2010 Annual Report on Form 10-K, which is available in the Company's website at www.doralfinancial.com. The statements in this presentation speak only as of the date they are made. We do not undertake to update forward-looking statements to reflect the impact of circumstances or events that arise after the date the forward-looking statements were made. |

| Q1 Summary 3 Reduced Non-Performing Assets by a further $74MM (9%) Mortgage NPLs were reduced by $26MM (9%) Net Interest Margin Increased to 223 bps (38 bps increase) Net Interest Income improved to $43MM (up $6MM) Non-Interest Income generated $29MM of revenue Banking and Insurance fees delivered $9MM of revenue Operating Expenses declined $16MM to $61 MM Credit related expenses declined by $6MM to under $4MM Doral delivered $3.3MM of Net Income in Q1 |

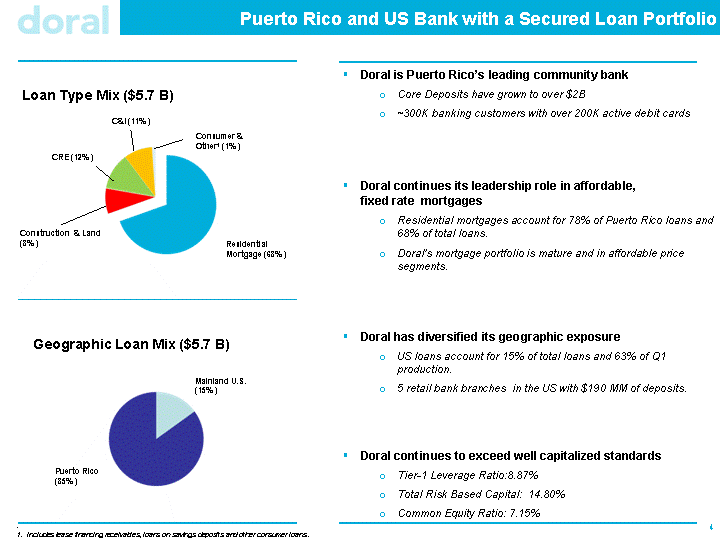
| Puerto Rico and US Bank with a Secured Loan Portfolio 4 . Includes lease financing receivables, loans on savings deposits and other consumer loans. Residential Mortgage (68%) Consumer & Other1 (1%) C&I (11%) Construction & Land (8%) CRE (12%) Loan Type Mix ($5.7 B) Doral is Puerto Rico's leading community bank Core Deposits have grown to over $2B ~300K banking customers with over 200K active debit cards Doral continues its leadership role in affordable, fixed rate mortgages Residential mortgages account for 78% of Puerto Rico loans and 68% of total loans. Doral's mortgage portfolio is mature and in affordable price segments. Doral has diversified its geographic exposure US loans account for 15% of total loans and 63% of Q1 production. 5 retail bank branches in the US with $190 MM of deposits. Doral continues to exceed well capitalized standards Tier-1 Leverage Ratio:8.87% Total Risk Based Capital: 14.80% Common Equity Ratio: 7.15% Puerto Rico (85%) Mainland U.S. (15%) Geographic Loan Mix ($5.7 B) |

| Asset Quality Trends Continued to Improve 5 Non Performing Assets fell an additional $74MM (9%) in the first quarter. Non-Performing Assets ($ MM) Q4 2010 Q1 2011 Change Residential Mortgage1 $280.8 $254.9 $(25.9) Commercial Real Estate 193.6 187.1 (6.5) Construction & Land 148.7 126.2 (22.5) Commercial & Industrial 2.5 2.8 0.3 Consumer / Other 0.9 0.5 (0.4) Total $626.5 $571.5 (55.0) FHA / VA Guaranteed Residential Mortgage 121.3 99.4 (21.9) OREO 100.3 103.8 3.5 Other 3.7 3.3 (0.4) Total Non-Performing Assets $851.8 $778.0 (73.8) Delinquency (30 - 89 Days) ($MM) Residential Mortgage1 Delinquency $71.8 $71.5 (0.3) 1 Excludes FHA / VA Guaranteed Loans |

| 6 Positive Earnings Performance Across All Categories Doral Financial Corp. ($MM) Income Statement Q4 2010 Q1 2011 Net interest income $37.6 $43.2 Provision 21.1 2.6 Non-interest income 27.8 28.6 Non-interest expense 76.4 60.8 Pre-tax income (loss) (32.1) 8.4 Tax 4.0 5.5 Net income (loss) (36.1) 3.3 Net income (loss) to common (38.5) 0.9 Balance Sheet Data ($B) Loans $5.8 $5.7 Total assets 8.6 8.5 Retail Deposits 2.3 2.2 Non-performing assets ($M) 851.8 778.0 Ratios Net Interest Margin (bps) 185 223 Tier 1 Leverage Ratio 8.6% 8.9% Total Risk Based Capital Ratio 14.5% 14.8% Tier 1 Common / Risk Weighted Assets 7.0% 7.2% Tangible Book Value / Share $3.97 $3.96 Net Income improved $39.4MM to $3.3MM Pre-Tax, Pre-Provision Income improved $22MM to $11.0MM Pre-Tax Income improved $40.5MM to $8.4MM Net Interest Margin improved 38 bps to 2.23% Net Interest Income rose to $43.2MM driven by lower NPLs and improved funding costs. Restructured $555MM of FHLB borrowings, reducing funding cost by $1.7MM / quarter ($1.2MM in Q1). Non-Interest Expense fell $15.6 MM driven by Lower credit costs ($6.4 MM decrease) $2.0 MM reduction in professional services as a result of reduced legacy related items. Provision expense fell $18.5MM driven by continued improvement in mortgage delinquency and non-performing loans. Mortgage NPLs continued to decline ($25.9MM reduction in the quarter) Tax expense reflects net effect on the DTA from the change in Puerto Rico corporate tax rate from 39% to 30% and annual earnings forecast updates on profitable Puerto Rico subsidiaries. |

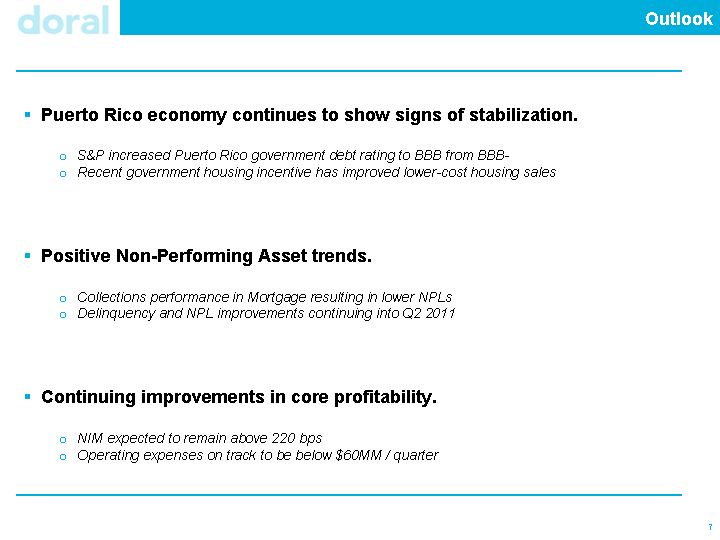
| Outlook 7 Puerto Rico economy continues to show signs of stabilization. S&P increased Puerto Rico government debt rating to BBB from BBB- Recent government housing incentive has improved lower-cost housing sales Positive Non-Performing Asset trends. Collections performance in Mortgage resulting in lower NPLs Delinquency and NPL improvements continuing into Q2 2011 Continuing improvements in core profitability. NIM expected to remain above 220 bps Operating expenses on track to be below $60MM / quarter |
