Attached files
| file | filename |
|---|---|
| 8-K - BROOKLINE BANCORP, INC. 8-K - BROOKLINE BANCORP INC | a6690663.htm |
| EX-99.1 - EXHIBIT 99.1 - BROOKLINE BANCORP INC | a6690663ex99_1.htm |
Exhibit 99.2
1 Brookline Bancorp, Inc. Annual Meeting of Stockholders THE BROOKLINE WAY

2 Brookline Bancorp, Inc. Annual Meeting of Stockholders Agenda Welcoming Remarks Introduction of Directors, Secretary of the Annual Meeting and Inspector of Election Procedural Matters Relating to the Conduct of the Annual Meeting Presentation of the Five Proposals before the Annual Meeting Opening of Polls and Balloting Closing of Polls Report of the Inspector of Elections Adjournment of Formal Portion of the Annual MeetingReport of the CEO, Paul Perrault General Question and Answer Period
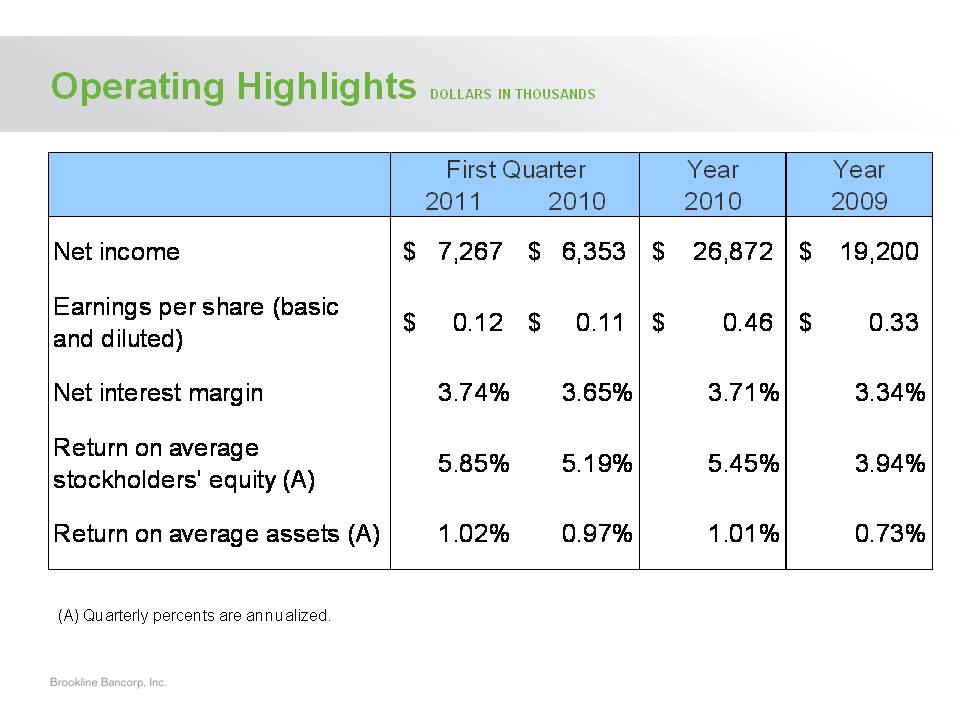
3 Operating Highlights DOLLARS IN THOUSANDS First Quarter Year Year 2011 2010 2010 2009 Net income 7,267 $ 6,353 $ 26,872 $ 19,200 $ Earnings per share (basic and diluted) 0.12 $ 0.11 $ 0.46 $ 0.33 $ Net interest margin 3.74% 3.65% 3.71% 3.34% Return on average stockholders' equity (A) 5.85% 5.19% 5.45% 3.94% Return on average assets (A) 1.02% 0.97% 1.01% 0.73% (A) Quarterly percents are annualized.
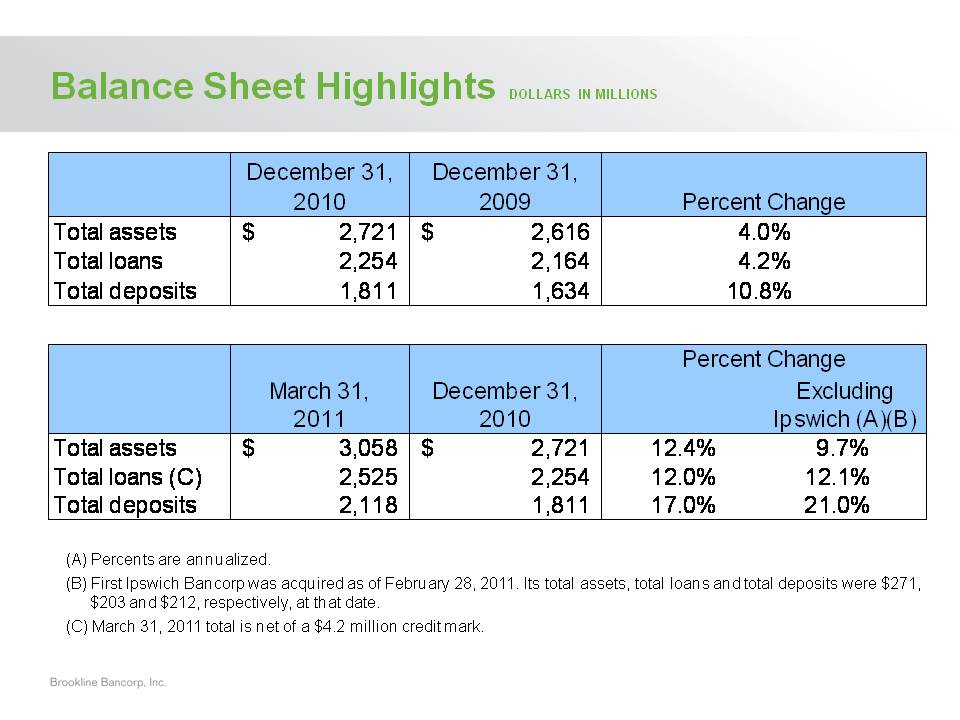
4 Balance Sheet Highlights DOLLARS IN MILLIONS December 31, 2010 December 31, 2009 Percent Change Total assets 2,721 $ 2,616 $ Total loans 2,254 2,164 Total deposits 1,811 1,634 4.0% 4.2% 10.8% March 31, 2011 December 31, 2010 Percent Change Excluding Ipswich (A)(B) Total assets 3,058 $ 2,721 $ 12.4% 9.7% Total loans (C) 2,525 2,254 12.0% 12.1% Total deposits 2,118 1,811 17.0% 21.0% (A) Percents are annualized. (B) First Ipswich Bancorp was acquired as of February 28, 2011. Its total assets, total loans and total deposits were $271, $203 and $212, respectively, at that date. (C) March 31, 2011 total is net of a $4.2 million credit mark.
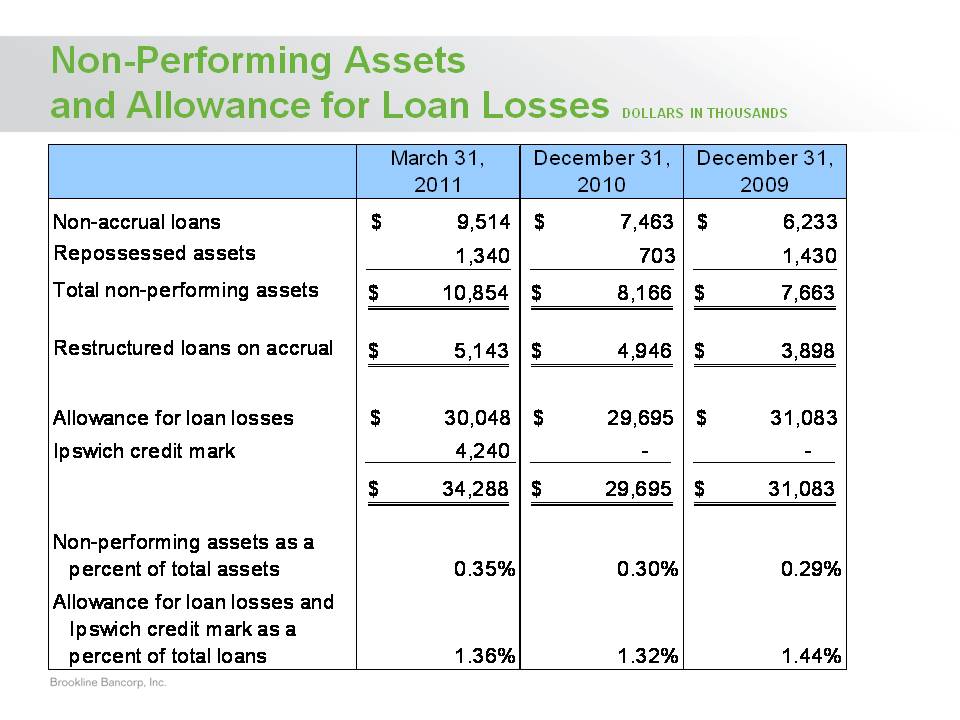
5 Non-Performing Assets and Allowance for Loan Losses DOLLARS IN THOUSANDS March 31, 2011 December 31, 2010 December 31, 2009 Non-accrual loans $ 9,514 $ 7,463 $ 6,233 Repossessed assets 1,340 703 1,430 Total non-performing assets 10,854 $ 8,166 $ 7,663 $ Restructured loans on accrual 5,143 $ 4,946 $ 3,898 $ Allowance for loan losses $ 30,048 $ 29,695 $ 31,083 Ipswich credit mark 4,240 - - 34,288 $ 29,695 $ 31,083 $ Non-performing assets as a percent of total assets 0.35% 0.30% 0.29% Allowance for loan losses and Ipswich credit mark as a percent of total loans 1.36% 1.32% 1.44%
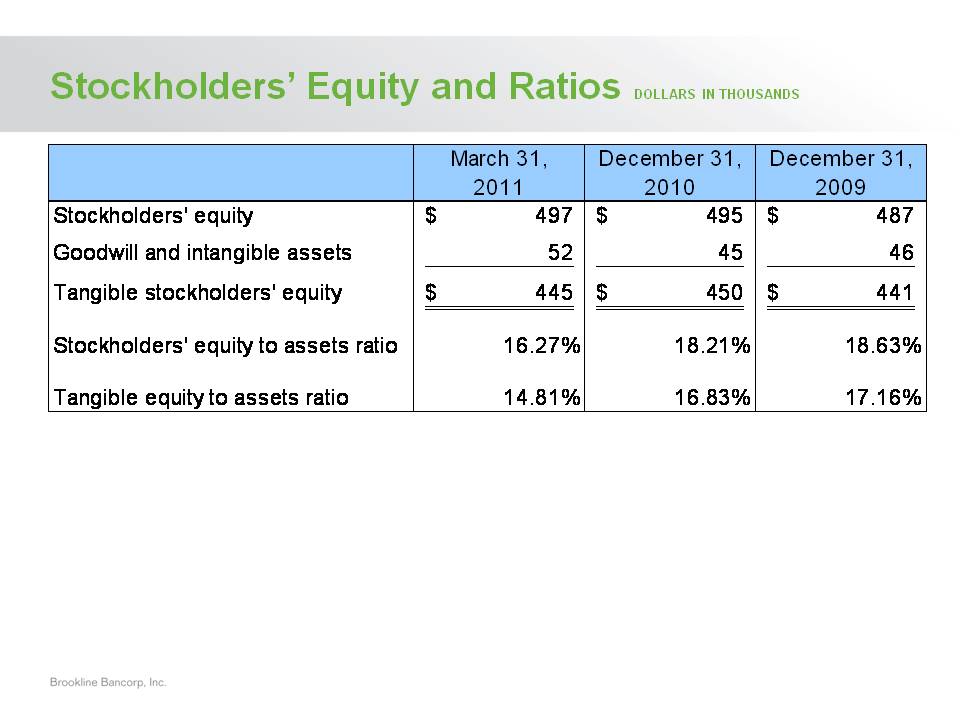
6 Stockholders’ Equity and Ratios DOLLARS IN THOUSANDS March 31, 2011 December 31, 2010 December 31, 2009 Stockholders' equity 497 $ 495 $ 487 $ Goodwill and intangible assets 52 45 46 Tangible stockholders' equity 445 $ 450 $ 441 $ Stockholders' equity to assets ratio 16.27% 18.21% 18.63% Tangible equity to assets ratio 14.81% 16.83% 17.16%
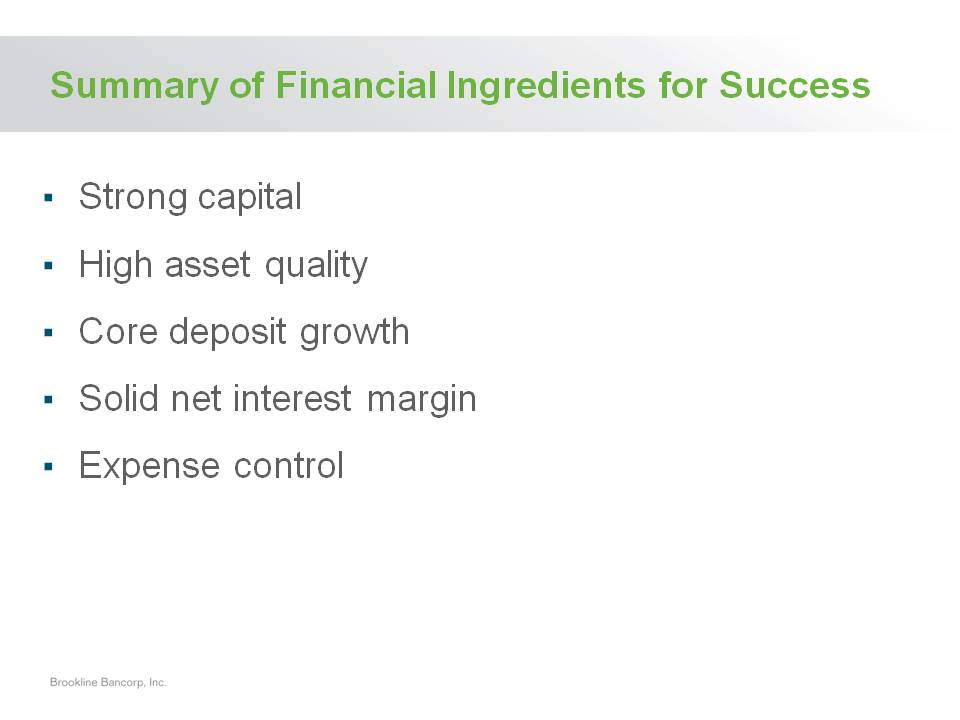
7 Summary of Financial Ingredients for Success Strong capital High asset quality Core deposit growth Solid net interest margin Expense control