Attached files
| file | filename |
|---|---|
| 8-K - CURRENT REPORT ON FORM 8-K - Simulations Plus, Inc. | simulations_8k-041811.htm |
Exhibit 99.1

Simulations Plus, Inc.
(NASDAQ:SLP)
Second Quarter FY 2011
Conference Call and Webinar
April 18, 2011

With the exception of historical information, the matters discussed in this
presentation are forward looking statements that involve a number of risks
and uncertainties. The actual results of the Company could differ
significantly from those statements. Factors that could cause or contribute
to such differences include, but are not limited to: continuing demand for
the Company’s products, competitive factors, the Company’s ability to
finance future growth, the Company’s ability to produce and market new
products in a timely fashion, the Company’s ability to continue to attract
and retain skilled personnel, and the Company’s ability to sustain or
improve current levels of productivity. Further information on the
Company’s risk factors is contained in the Company’s quarterly and
annual reports and filed with the Securities and Exchange Commission.
Safe Harbor Statement
• 2Q11 compared to 2Q10:
– 14th consecutive profitable quarter
– 2Q11 sales up 13.5% to Record $3.35 MM from $2.95 MM
– Net Income up 41.6%
– Pharmaceutical segment sales up 17.7%
– Words+ subsidiary sales up 0.7%
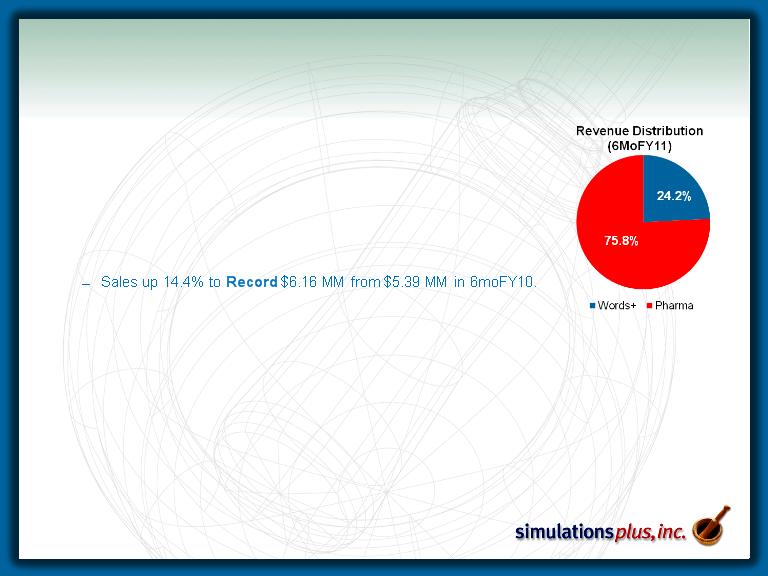
• 6moFY11 compared to 6moFY10:
– Net Income up 37.7% to $1.475 million from $1.071 million
– Pharmaceutical segment sales up 17.9%
– Words+ subsidiary sales up 4.4%
– Diluted earnings per share up 39.1% to $0.09 from $0.06.
• Strong balance sheet:
– Cash $8.76 MM at 2/28/11, after using cash of $4.2 million to
repurchase more than 2,022,000 shares over the past two years
repurchase more than 2,022,000 shares over the past two years
– Shareholders’ equity decreased 3% to $12.66 million from $13.05
million at 9/1/10 due to cash used for share repurchases
million at 9/1/10 due to cash used for share repurchases
– No debt
SLP 2Q11 Highlights
Three months ended 2/28/11
Three months ended 2/28/11
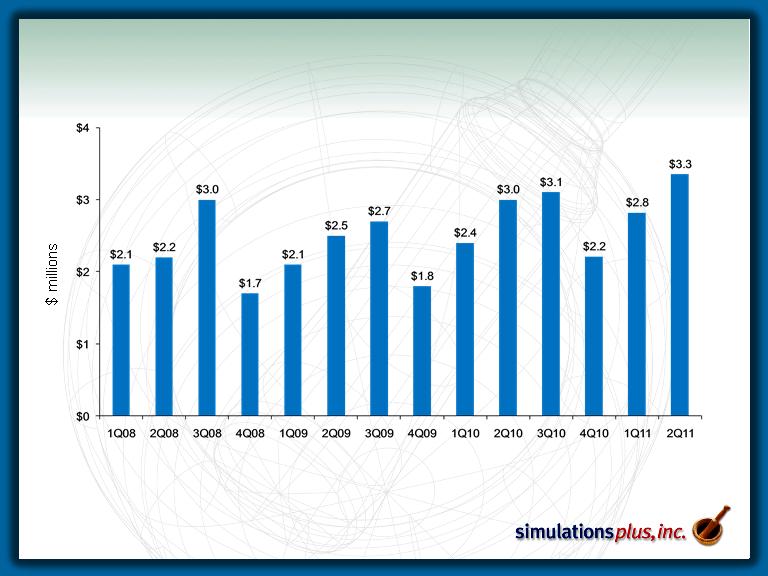
Consolidated Revenue

Revenue History
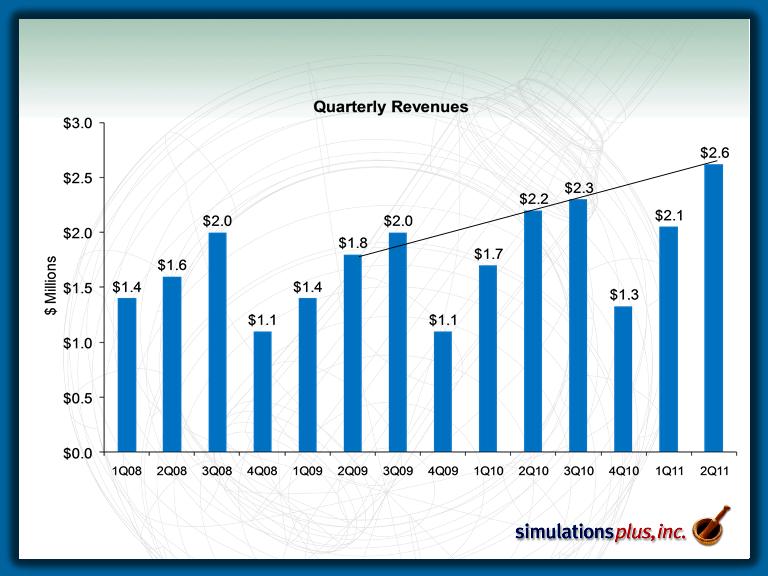
Pharmaceutical Growth

Gross Margin (consolidated)
75.6%
78.9%
78.8%
70.4%
73.8%
74.4%
80.0%
67.9%
75.0%
76.3%
77.6%
75.6%
73.6%
77.6%

Income Before Taxes

Net Income
$243K
$565K
$764K
$165K
$312K
$368K
$569K
$163K
$430K
$641K
$740K
$345K
$567K
$907K

Consolidated Income Statement
($ millions)
|
|
2Q11
|
2Q10
|
|
Pharmaceutical software and services revenue
|
2.621
|
2.227
|
|
Words+ revenue
|
0.728
|
0.723
|
|
Consolidated revenue
|
3.349
|
2.950
|
|
Gross profit
|
2.601
|
2.249
|
|
Gross profit margin
|
77.6%
|
76.3%
|
|
SG&A
|
0.980
|
1.089
|
|
R&D
|
0.255
|
0.252
|
|
Total operating expenses
|
1.235
|
1.341
|
|
Income before income taxes
|
1.394
|
0.974
|
|
Net income
|
0.907
|
0.641
|
|
Earnings per share (diluted)
|
0.056
|
0.039
|

Select Balance Sheet Items
($ millions)
|
|
February 28, 2011
|
February 28, 2010
|
|
Cash and cash equivalents
|
$8.759
|
$8.641
|
|
Total current assets
|
12.403
|
11.448
|
|
Total assets
|
$14.785
|
$13.613
|
|
|
|
|
|
Total current liabilities
|
1.460
|
1.294
|
|
Total liabilities
|
2.130
|
2.152
|
|
|
|
|
|
Shareholders’ equity
|
12.655
|
11.461
|
|
Total liabilities and shareholders’ equity
|
14.785
|
13.613
|

Share Repurchase Program
• The board of directors approved a second share repurchase
program beginning February 2010 for one year (Phase II)
program beginning February 2010 for one year (Phase II)
• The Phase II program authorized repurchase of up to
1,000,000 shares through February 2011
1,000,000 shares through February 2011
• The repurchase program is now complete
• Over both Phase I and Phase II, the company repurchased 2,023,000
shares at an average price of $2.05 per share
shares at an average price of $2.05 per share
• The board of directors could authorize another phase of share
repurchases at any time
repurchases at any time
• As of today the board has no plans for doing so

Marketing and Sales Program
• Fundamental industry shift continues
– Pharma increasingly utilizing simulation software and modeling tools
to increase productivity - steady stream of scientific meetings
to increase productivity - steady stream of scientific meetings
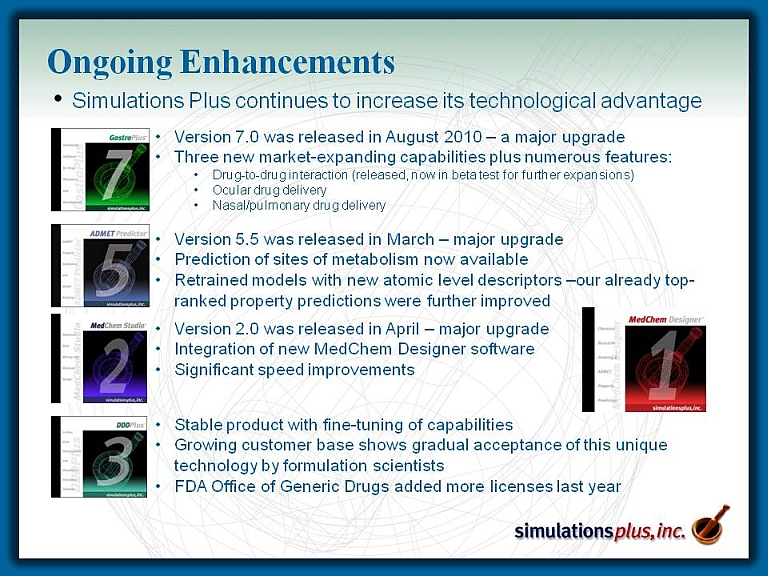
– Software tools are always evolving, and as the technology advances,
new capabilities attract new users, such as the improved and
expanded structure-property models in ADMET Predictor 5.5; the drug
-drug interaction, ocular and nasal/pulmonary delivery capabilities in
GastroPlus 7.0; and the powerful de novo molecule design capabilities
in MedChem Studio, and our fantastic new MedChem
Designer/ADMET Predictor combination.
– Our team continues its prolific generation of scientific papers, posters,
and podium presentations, with > 30 in the past year
and podium presentations, with > 30 in the past year
– Collaborations/Consulting/Grants
– We have now completed our SBIR grant and all of the large funded
collaborations that contributed to revenues and earnings for several
years; however study contracts continue to be strong with a number of
customers coming back for repeated consulting work.
collaborations that contributed to revenues and earnings for several
years; however study contracts continue to be strong with a number of
customers coming back for repeated consulting work.
– We recently signed a 5-year collaboration with the FDA Center for
Food Safety and Applied Nutrition to build toxicity models with ADMET
Predictor/Modeler™ for food additives and contaminants
Food Safety and Applied Nutrition to build toxicity models with ADMET
Predictor/Modeler™ for food additives and contaminants
– We recently formed a second studies team for informatics to address
the need for consulting work in that area (ADMET Predictor &
MedChem Studio).
the need for consulting work in that area (ADMET Predictor &
MedChem Studio).

MedChem Designer - new and powerful!
Make copies of a
starting molecule,
modify them,
then click on the
AP button and see
>120 predicted
properties for
each of them.
Decide in a few
seconds whether
you want to keep
any of them or try
different changes
to the structure.
modify them,
then click on the
AP button and see
>120 predicted
properties for
each of them.
Decide in a few
seconds whether
you want to keep
any of them or try
different changes
to the structure.

Summary
• For the trailing twelve months through February 28:
– Revenues = $11.486 million
– Net Income = $2.542 million (22.3%)
– Earnings/share = $0.16 (16.218 million shares)
• Simulations Plus is globally recognized as a leader in our
respective market niches, with an outstanding reputation for
scientific expertise, technological innovation, and strong
customer support.
respective market niches, with an outstanding reputation for
scientific expertise, technological innovation, and strong
customer support.
• We are expanding our Life Sciences team to promote faster
development of new products and services as well as to
reinforce marketing and sales efforts.
development of new products and services as well as to
reinforce marketing and sales efforts.

Q&A